arXiv:1210.2936v1 [astro-ph.GA] 10 Oct 2012
An XMM-Newton view of the M 17 nebula
✩F. Mernier, G. Rauw
Groupe d’Astrophysique des Hautes Energies, Institut d’Astrophysique et de G´eophysique, Universit´e de Li`ege, 17, All´ee du 6 Aoˆut, B5c, B-4000 Sart Tilman, Belgium
Abstract
We present the analysis of an XMM-Newton observation of the M 17 nebula. The X-ray point source population consists of massive O-type stars and a population of probable low-mass pre-main sequence stars. CEN 1a,b and OI 352, the X-ray brightest O-type stars in M 17, display hard spectra (kT of 3.8 and 2.6 keV) consistent with a colliding wind origin in binary/multiple systems. We show that the strong interstellar reddening towards the O-type stars of M 17 yields huge uncertainties on their LX/Lbolvalues. The
low-mass pre-main sequence stars exhibit hard spectra resulting from a combination of high plasma temperatures and very large interstellar absorption. We find evidence for considerable long term (months to years) variability of these sources. M 17 is one of the few star formation complexes in our Galaxy producing diffuse X-ray emission. We analyze the spectrum of this emission and compare it with previous studies. Finally, we discuss the Optical Monitor UV data obtained simultaneously with the X-ray images. We find very little correspondence between the UV and X-ray sources, indicating that the majority of the UV sources are foreground stars, whilst the bulk of the X-ray sources are deeply embedded in the M 17 complex.
Key words: stars: early-type, X-rays: stars, ISM: individual objects: M 17
1. Introduction
M 17 is one of the most luminous H ii regions of our Galaxy. This nebula hosts the very young open cluster NGC 6618 which probably reflects the second stage in a still on-going se-quential (massive) star formation process (Hanson et al., 1997; Povich et al., 2009). These properties make M 17 a privileged target for the observational study of massive star formation. In-deed, M 17 harbors several cocoon stars, which are still embed-ded in the relics of their cradles of circumstellar material (e.g. Chini & Kr¨ugel, 1985; Hanson et al., 1997; Chini et al., 2000; Kassis et al., 2002). Several interesting objects are found along the interface between the H ii region and the molecular cloud M 17SW, supporting the idea that they were formed through the interaction between the H ii region and the molecular cloud. Recent studies reported evidence for still accreting massive or intermediate-mass protostars for a couple of objects which were identified as silhouette disks sometimes associated with H2jets
(e.g. N¨urnberger et al., 2007; Nielbock et al., 2007, 2008). The distance of the M 17 complex remains somewhat un-certain. From multi-color photometry and spectroscopy, Hoffmeister et al. (2008) inferred a distance of 2.1 ±0.2 kpc and a ratio of total to selective extinction of RV = 3.9. These
au-thors argued that previous photometric and spectrophotometric distance estimates, around 1.6 kpc, were probably biased by
ig-✩Based on observations collected with XMM-Newton, an ESA Science
Mis-sion with instruments and contributions directly funded by ESA Member States and the USA (NASA).
Email addresses:mernier@astro.ulg.ac.be (F. Mernier), rauw@astro.ulg.ac.be (G. Rauw)
noring the multiplicity of O-type stars in NGC 6618 (see also the discussion in Povich et al., 2009).
The total extinction towards M 17 consists of a foreground extinction, a local dust component inside M 17 and, in some cases, absorption by circumstellar disks or dust. This results in a very large optical extinction with a very complex spatial distribution (Povich et al., 2009).
The stellar population of M 17 features a number of very young, hot and massive objects. The main exciting source of M 17 is CEN 1 (Chini et al., 1980), also known as Klein-mann’s Anonymous Star1. CEN 1 is a Trapezium-like system consisting of two spectroscopic binaries (CEN 1a and 1b) that form a visual pair with an angular separation of 1.8 arcsec. Each of these spectroscopic binaries is of spectral type O4 V (Hoffmeister et al., 2008)2. Actually, multiplicity might be
quite common among the O-type stars of NGC 6618. Indeed, CEN 18 (O6-8 V) was also found to display double absorp-tion lines, and CEN 37 (O3-6 V), being over-luminous for its spectral type, was suggested to be another binary candidate (Hoffmeister et al., 2008). VLA radio observations at 3.6 and 6 cm wavelength revealed several compact radio sources, two of them being associated with the components of the visual bi-nary CEN 1 (Rodr´ıguez et al., 2009). CEN 1a is detected only at the shortest wavelength. Both radio sources, especially the one associated with CEN 1a, have flux densities that exceed the expected level of free-free emission from their stellar winds.
1Throughout this paper, we adopt the naming convention of Chini et al. (1980, CEN designations) and Ogura & Ishida (1976, OI designations).
2The physical association of the two binaries is still controversial since they are subject to different optical extinctions (Hoffmeister et al., 2008).
Rodr´ıguez et al. (2009) accordingly suggest that the observed radio emission could, at least partially, stem from the syn-chrotron process in a colliding wind region of the binary sys-tem.
Although stellar winds account only for a very small fraction (a few percent at most) of the overall energy input of early-type stars into H ii regions, their mechanical power determines the dynamics of a nebula and produces so-called wind-blown bub-bles or superbubbub-bles (in the case of clusters of early-type stars). The superbubble blown by the stellar winds of the OB stars in M 17 is highly asymmetric due to its interaction with the neigh-boring molecular cloud M 17SW. Soft X-ray emission spatially coincident with the superbubble of M 17 was detected with pre-vious X-ray observations using ROSAT (Dunne et al., 2003), Chandra (Townsley et al., 2003a,b) and Suzaku (Hyodo et al., 2008). Beside this diffuse emission, these X-ray observations also revealed a number of point sources. For instance, a 40 ksec Chandra-ACIS observation led to the detection of 886 point-like sources in the field of M 17 (Broos et al., 2007).
In the present paper we discuss the results of an XMM-Newton observation of M 17 with the goal to quantify the prop-erties of the brightest X-ray sources in the field. Section 2 pro-vides an overview of our observations. In Sect. 3, we analyze the X-ray sources found in the field of M 17. We cross-correlate their position with various catalogs to identify counterparts at other wavelengths. We then analyze the spectra of twenty X-ray bright point like sources as well as of the diffuse X-X-ray emission. Finally, in Sect. 4, we summarize the most important results of our study and present our conclusions.
Figure 1: Energy-coded three-color X-ray image of M 17 built from the EPIC-MOS data. North is up and east is to the left. The field of view of the EPIC instruments is centered on CEN 1 and has a radius of 15 arcmin. The red, green, and blue colors correspond to the soft, medium, and hard energy bands used throughout this paper (see Sect. 2). The individual images were exposure cor-rected, before they were combined. Note the reddish emission lane that extends to the east-south-east of the central cluster.
Figure 2: Energy-coded three color UV image of M 17 as built from the UVW1 (red), UV M2 (green) and UVW2 (blue) OM data. The OM field of view covers a region of 17 × 17 arcmin2, centered on CEN 1. Note the diffuse emission that is seen eastward of the center. The brightest point-like sources are affected by some artifacts (see Sect. 2).
2. Observations
M 17 was observed for 30 ksec with the XMM-Newton satellite (Jansen et al., 2001) on 3 November 2003 (JD 2 452 710.170 – 2 452 710.520). The two EPIC-MOS detectors (Turner et al., 2001) and the EPIC-pn camera (Str¨uder et al., 2001) were all used in full frame mode with the medium filter to reject optical light.
The raw data were processed with the SAS software (version 10.0). Our observation was affected by a high radiation back-ground. As the background showed no isolated flares, but rather a general high level affecting the entire duration of the observa-tion, we did not define good time intervals and kept the entire observation instead.
Images were extracted for soft (0.5 – 1.0 keV), medium (1.0 – 2.0 keV), and hard (2.0 – 10.0 keV) energy bands. An energy-coded three-color image of the combined field of view of the two EPIC-MOS instruments is shown in Fig. 1. In this image, we have emphasized the soft band to highlight the weak dif-fuse emission that extends to the east-south-east of the central cluster.
The Optical Monitor (OM, Mason et al., 2001) instrument aboard XMM-Newton observed M 17 through the three UV fil-ters UVW1, UV M2 and UVW2 with exposure times of 4, 4 and 8 ksec respectively. The OM was operated in ‘full frame low-resolution’ mode covering a 17 × 17 arcmin2 square field
of view centered on the same coordinates as the X-ray cam-eras. The UVW1, UV M2 and UVW2 filters have bandwidths of 2450 – 3200, 2050 – 2450, and 1800 – 2250 Å, respectively (Mason et al., 2001).
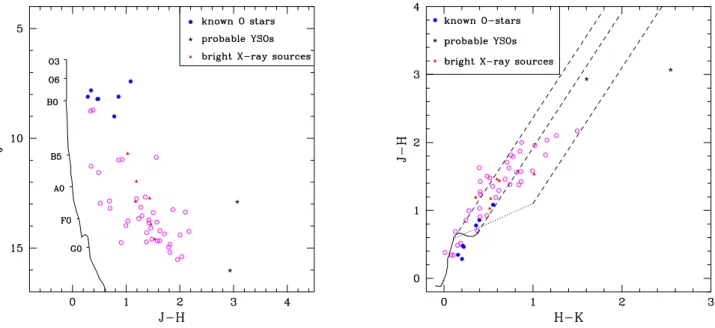
Figure 3: Color-magnitude (left) and color-color (right) diagrams of the near-IR counterparts of the X-ray sources detected with EPIC in the M 17 field of view. Only 2MASS data with reliable photometry are plotted. The known O-stars and the bright X-ray sources are objects that are studied spectroscopically in Sect. 3.2. The slope of the reddening relation in the color-color diagram, indicated by the dashed lines, is taken to be E(J − H)/E(H − K) = 2 in agreement with Hoffmeister et al. (2008) and Straiˇzys & Laugalys (2008). The solid line yields the locus of the un-reddened main-sequence according to Tokunaga (2000) and Martins & Plez (2006) and shifted by a distance modulus of 11.61 in the color-magnitude diagram. The dotted straight line in the color-color diagram indicates the locus of the un-reddened classical T-Tauri stars following Meyer et al. (1997).
The OM data were processed with the relevant command chain of the SAS software. The data from the three filters were used to build a color-coded image (Fig. 2). The OM images ex-hibit some artifacts such as smoke-ring ghosts caused by light reflected off a chamfer in the detector window and modulo-8 pattern around bright sources (Mason et al., 2001). Neverthe-less, Fig. 2 reveals also some genuine diffuse emission in the UVW1 filter. A total of 614 point sources are detected in the OM images (a Table with all the detections will be made avail-able electronically), 128 of them being detected in all three passbands.
The OM detector has a read-out time of 11 ms and sources with a count rate of 10 counts s−1 typically suffer from
coinci-dence losses of about 10% (Mason et al., 2001). These losses are partially recovered during the data processing to provide ‘corrected’ count rates, which are then converted into AB mag-nitudes (Oke, 1974). With the filters used during our obser-vation, corrected count rates of 10 counts s−1 correspond to
UVW1, UV M2 and UVW2 AB-magnitudes of 16.066, 14.912 and 14.072, respectively. The reconstructed photometry of sources much brighter than this should be considered with cau-tion.
3. X-ray sources in M 17
Figure 1 shows that the X-ray emission of M 17 is dominated by a few bright point sources along with a number of fainter point sources and some diffuse emission. The SAS detection routines produced a list of 99 sources in the combined EPIC
images with a significance threshold3of 10.
All these sources were inspected by eye and 16 of them were rejected as spurious. This inspection revealed another 9 sources that were clearly seen on the image, but were not found by the detection algorithm. The reasons the detection routines did a rather poor job on these data are essentially the diffuse ground as well as the generally high level of particle back-ground. We ended up with a final list of 92 sources (a table with these detections will be made available electronically). This is far less than the number of sources (886) detected by Broos et al. (2007) with Chandra. The main reasons for this situation are the wider point spread function of XMM-Newton compared to Chandra and the high background level of our ob-servation. From a histogram of the number of sources versus count rate, we conclude that our detections are complete down to rates of 0.004 and 0.002 cts s−1for the EPIC-pn and the
indi-vidual EPIC-MOS cameras, respectively. 3.1. Cross-correlation with other catalogs
To start, we have cross-correlated the list of X-ray sources with the 2MASS point sources catalog (Cutri et al., 2003; Skrutskie et al., 2006). Using the technique of Jeffries et al. (1997), the optimal cross-correlation radius, which offers the best compromise between obtaining the maximum number of true identifications and avoiding contamination by spurious co-incidences, was established to be 2.5 arcsec. For this correla-tion radius, we expect to find fewer than 7% of spurious cross-identifications among the 67 positive matches listed.
3This implies a probability of ≤ e−10that a random Poissonian fluctuation could have caused the observed source counts inside the detection cell.
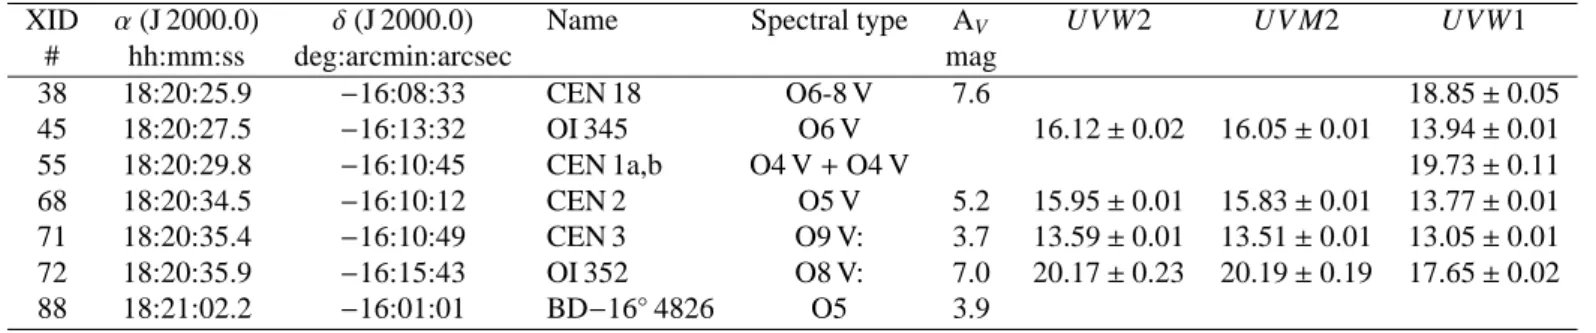
Table 1: Results of the cross-correlation between the list of X-ray sources detected with our EPIC data of M 17 and the list of OB stars from Povich et al. (2009). Spectral types with a colon are uncertain, and could actually be earlier than quoted here.
XID α(J 2000.0) δ(J 2000.0) Name Spectral type AV UVW2 UV M2 UVW1
# hh:mm:ss deg:arcmin:arcsec mag 38 18:20:25.9 −16:08:33 CEN 18 O6-8 V 7.6 18.85 ± 0.05 45 18:20:27.5 −16:13:32 OI 345 O6 V 16.12 ± 0.02 16.05 ± 0.01 13.94 ± 0.01 55 18:20:29.8 −16:10:45 CEN 1a,b O4 V + O4 V 19.73 ± 0.11 68 18:20:34.5 −16:10:12 CEN 2 O5 V 5.2 15.95 ± 0.01 15.83 ± 0.01 13.77 ± 0.01 71 18:20:35.4 −16:10:49 CEN 3 O9 V: 3.7 13.59 ± 0.01 13.51 ± 0.01 13.05 ± 0.01 72 18:20:35.9 −16:15:43 OI 352 O8 V: 7.0 20.17 ± 0.23 20.19 ± 0.19 17.65 ± 0.02 88 18:21:02.2 −16:01:01 BD−16◦4826 O5 3.9
The J versus J − H color-magnitude and J − H versus H − K color-color diagrams of the 2MASS counterparts of the sources detected with EPIC are shown in Fig. 3. The main-sequence relation in these figures is taken from Tokunaga (2000) for stars later than spectral type O, and from Martins & Plez (2006) for O-type stars. As can be seen on these diagrams, there is a wide range of reddening values, which hampers a direct comparison with theoretical isochrones. We note that about 1/6 of the X-ray sources have a near-IR counterpart that falls in the region occupied by classical T-Tauri stars (cTTs) which exhibit IR-excess emission from a circumstellar disk (Meyer et al., 1997). This result is in excellent agreement with the finding of Broos et al. (2007) who noted that whilst most of the Chandra sources occupied the near-IR color space associated with reddened weak-line T Tauri stars, about one sixth of their sources fell in a region of the near-IR color-color diagram where classical T Tauri and Herbig AeBe stars are expected. This contrasts with the situation in some other young open clusters (e.g. Cyg OB2, Rauw 2011; NGC 6231, Sana et al. 2007; and NGC 6383, Rauw et al. 2003), where only a very small fraction of the counterparts of faint X-ray sources provide evidence for near-IR excesses.
We have cross-correlated our list of sources with the list of OB stars provided by Povich et al. (2009). 16 known O-type stars fall within the field of view covered by the EPIC instru-ments. Within a correlation radius of 2.5 arcsec, we found 7 positive correlations (see Table 1). Except for CEN 3 and OI 352, all of them have a spectral type earlier than O7. The non-detections mostly refer to stars later than O7. There are a few exceptions though. CEN 37 (O3-6 V) is located very close to the pair CEN 1a,b and could contribute to the X-ray emission associated with the latter, without being resolved as an individ-ual source. CEN 43 (O3-5 V) falls close (6.9 arcsec) to one of the brightest X-ray sources (# 64) in our observation, but their association is formally not significant. Whilst we cannot rule out that CEN 43 slightly contributes to the emission of source #64, it must be stressed though that this star is very heavily red-dened (AV = 12.3, Povich et al., 2009) and could thus escape
detection simply as a result of the interstellar absorption. In addition, this cross-correlation identifies the two most
heavily reddened sources in Fig. 3 as being two candidate young stellar objects (YSOs) previously seen with Chandra: our X-ray sources 17 and 75 being respectively associated with objects X4 and X14 in Povich et al. (2009).
Correlation of our X-ray sources with the catalog of OM point sources yielded a rather low number of matches: only 11 of the 76 EPIC sources that fall into the OM field of view were found to have an OM counterpart. Six of these objects are OB stars (see Table 1). The poor match between the X-ray sources and the UV detections is yet another manifestation of the huge absorption towards M 17.
This brings up the question about the nature of the OM sources. Cross-correlation of the OM sources with the 2MASS point source catalog yields an optimal correlation radius in the range 2 – 2.5 arcsec. Adopting a radius of 2.5 arcsec, 510 of the 614 OM point sources have a near-IR counterpart. The corre-sponding J − H versus H − K color-color diagram as well as the near-IR and UV color-magnitude diagram (see Fig. 4) clearly indicate that the majority of these objects are less-reddened, likely foreground late-type stars, unrelated to M 17.
Comparing the list of OM sources with the catalogs of OB stars and candidate young stellar objects of Povich et al. (2009) yields 8 positive matches for OB stars and one YSO within a radius of 2.5 arcsec. Two of the OB stars seen with the OM are not detected in X-rays. These are CEN 25 and 31 of spectral type O7-8 V and O9.5 V respectively.
Finally, we have cross-correlated the list of our X-ray sources with the X-ray sources detected by the Chandra-ACIS obser-vation (Broos et al., 2007). Adopting a correlation radius of 2.5 arcsec, we find 61 positive correlations. Actually, some of our brightest EPIC sources do not have an ACIS counterpart (within the correlation radius) and that some of the prominent ACIS sources are missing in our list of detections. We have then used these results to compare the ACIS and EPIC count rates4. Figure 5 reveals a highly scattered relation, that deviates
4For the latter we adopted the MOS instruments as they have fewer gaps between CCDs than the pn detector, thus allowing a reliable determination of the count rates for a larger number of sources.
Figure 4: Left: UV color-magnitude diagram of the OM sources detected in the UVW1 and UV M2 filters. Middle and right: color-color and color-magnitude diagrams of the near-IR counterparts of the UV sources detected with the OM in the M 17 field of view. Only 2MASS data with reliable photometry are plotted. The slope of the reddening relation and the main-sequence relations are built in the same way as in Fig. 3.
significantly from a simple proportionality. One can consider several explanations for the large scatter:
• there could be a bias in the EPIC count rates due to source confusion. Indeed, the density of X-ray sources as seen with Chandra is quite high, especially in the crowded core of the NGC 6618 cluster. Due to the coarser PSF of XMM-Newton (as compared to Chandra) several Chan-dra sources could be confused and counted as a single source by XMM-Newton. To test this scenario, we have repeated the cross-correlation with a radius of 10 arcsec and we have replotted only those EPIC sources with a sin-gle ACIS counterpart within 10 arcsec (see Fig. 5). This treatment should eliminate the bulk of the sources that are due to confusion, but we see little effect on the distribution of the objects in Fig. 5. Therefore, confusion alone cannot account for the scatter in the count rate relation.
• the brightest sources could suffer from pile-up. Because of Chandra’s very narrow PSF, this problem would mainly impact the ACIS-I count rates. However, for all but the two brightest sources in Fig. 5, pile-up should be of a few per-cent at most. Indeed, for the brightest and second brightest objects in this figure, we estimate pile-up levels of about 12%, and 5% respectively. For sources with less than 0.01 count s−1, the pile-up level should be less than 1.2%.
• there could be systematics due to the instruments. Whilst one cannot rule out some residual problems in the cross-calibration of the EPIC and ACIS-I instruments, it has to be noted that a major effort has been put into this task over the last decade. All major issues have been solved and remaining problems are mostly small. Of course, some of the scatter in the count rates relation could reflect the different sensitivities of the EPIC-MOS and ACIS-I detec-tors. However, this should be a rather small effect. • there could be intrinsic time variability of the faint sources
on long time scales. The Chandra and XMM-Newton
observations were taken twenty months apart. It seems quite plausible that the X-ray brightness of weak sources, which could be associated with low-mass pre-main se-quence stars, changes with time. In view of Fig. 5 and the above discussion, this appears to be most likely ex-planation of the scatter and deviation from a simple pro-portionality. A spectacular illustration of this scenario is provided by source 396 of Broos et al. (2007). This is the second brightest X-ray source in the Chandra observation, but is not detected in our observation5. Conversely, our fourth brightest source (XID # 64) has no equivalent in the ACIS-I data, the nearest possible ACIS counterparts being very faint and located at more than 4.5 arcsec.
3.2. Spectral analyses
The EPIC spectra of twenty point-like sources were extracted and fitted using the xspec software (version 12.6.0, Arnaud, 1996). These include all the O-stars detected with EPIC as well as the brightest objects (with EPIC-MOS count rates of at least 0.01 count s−1) in the field of view. The source regions
were chosen in such a way to include the majority of the source photons, whilst simultaneously avoiding overlap with nearby sources in the most crowded regions of the field. The back-ground spectra were evaluated from nearby circular regions, free of any obvious point source.
For all sources, we tested absorbed power-law models as well as absorbed thermal plasma apec models (Smith et al., 2001). For the latter, we first assumed solar abundances. However, for the best exposed spectra, including the bright CEN 1 system, this resulted in a rather poor fit especially of the Fe K line. We then let the global metallicity vary during the fit and, in most cases, it converged to a value 0.2 – 0.4 times solar (Mernier,
5The closest EPIC source to this object is our source #42 at a separation of 4.9 arcsec.
Figure 5: Comparison of the EPIC-MOS and ACIS-I count rates for the X-ray sources in common between Broos et al. (2007) and the present paper. Open and filled symbols stand for EPIC sources which have a single ACIS counterpart within a correlation radius of respectively 2.5 and 10 arcsec.
2012). However, given the limited quality of most X-ray spec-tra, a more robust approach would be to constrain the abun-dances independently and then fit the X-ray spectra using fixed abundances.
Garc´ıa-Rojas et al. (2007) studied the chemical composition of the M 17 H ii region and determined abundances of nine key elements (including He, C, N, O, Ne, and Fe). Compared to the solar composition (Asplund et al., 2009), most elements are found to have abundances ∼ 0.7 times solar. There are a few notable exceptions to this rule. These are He, which has a solar abundance, C, which is found to be 2.4 times solar and, most of all, Fe, which is found to have an abundance of 0.026 solar. Garc´ıa-Rojas et al. (2007) show that their results are generally in good agreement with those from the literature, including for the iron abundance. The abundances of He and C have no di-rectly measurable impact on the EPIC spectra of our sources: helium has no spectral features inside the EPIC energy domain, whilst carbon has some lines that fall at the low energy edge of the EPIC sensitivity range, but are of little relevance here, because of the huge interstellar absorption towards M 17. How-ever, iron is of major importance for the EPIC spectra. Using such a low Fe abundance in our spectral models actually results in extremely poor fits. After some trials, we thus decided to fix all metal abundances to 0.7 times solar, except for He, C and Fe, which were fixed at 1.0, 2.4 and 0.4 times solar respectively. 3.2.1. X-ray spectra of O-type stars
For the O-type stars listed in Table 1, we have constrained the value of the interstellar neutral hydrogen column density using the relation between NHand E(B − V) derived by Bohlin et al.
(1978). For this purpose, we adopt the values of AV quoted in
Table 1 and taken from Povich et al. (2009)6, accounting for the peculiar reddening law RV = 3.9 (Hoffmeister et al., 2008). For
CEN 1a and CEN 1b, there are two different values of AV of
re-spectively 10.2 and 13.5 mag (Hoffmeister et al., 2008). In our fits of the X-ray spectra of O-stars, we allow for some excess absorption due to the ionized stellar wind (Naz´e et al., 2004) or to some circumstellar absorption. Therefore, we choose the lower of the two AVvalues for constraining the NHof the
spec-trum of source # 55 (corresponding to CEN 1a + 1b). There is no estimate of AV for OI 345 in the catalog of Povich et al.
(2009). However, the source is detected in all three OM filters and by comparison with CEN 2 (which has a similar spectral type), we estimate an extinction of AV ≃5.3 for OI 3457.
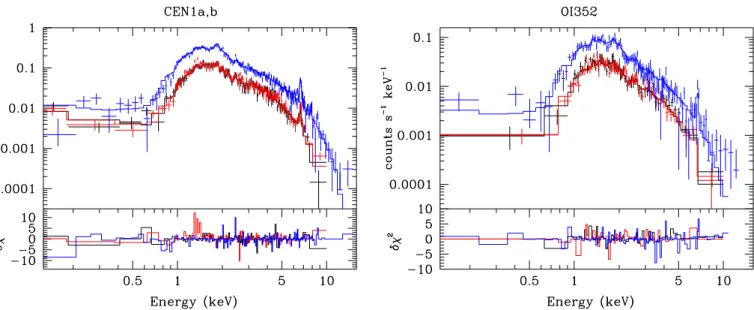
All O-type stars detected with EPIC have X-ray spectra that are best fit with a thermal plasma model. The majority of the O-type stars in our sample have intrinsically rather soft spectra with kT between 0.3 and 0.6 keV. This is in line with the overall properties of O-type stars as derived from CCD X-ray spectra (Naz´e, 2009) and is consistent with the general picture of intrin-sic X-ray emission due to instabilities embedded in the stellar wind. There are two notable exceptions to this rule. These are CEN 1a,b and OI 352. The spectra of these stars are shown in Fig. 6. They both display an Fe K line and require a second, hotter, temperature of 3.8 and 2.5 keV for CEN 1a,b and OI 352 respectively. It is worth comparing our best-fit spectral param-eters to those found by Broos et al. (2007) with the ACIS-I in-strument aboard Chandra.
Concerning CEN 1a,b, we must recall that our spectrum in-cludes both CEN 1a and CEN 1b and is likely also contaminated by CEN 37, although the latter was found to be 60 times fainter than the pair CEN 1a,b with Chandra. These three objects were resolved by Chandra (sources 536, 543 and 574 respectively in Broos et al., 2007). Our EPIC spectra indicate a prominent Fe K line (much stronger than in the ACIS-I spectra8) that con-strains the temperature of the hotter plasma component quite well. This temperature (3.8 keV) is significantly lower than the values of the hotter components found in the ACIS-I spectral fits, which were 15 keV for CEN 1a and 10.4 keV for CEN 1b (Broos et al., 2007). CEN 37 was reported to have an intrin-sically soft spectrum (kT = 0.6 keV, Broos et al., 2007) and should thus not contribute to the hard emission. Temperatures above 10 keV as advocated by Broos et al. (2007) are very dif-ficult to understand within the conventional scenarios (wind instabilities or magnetically channeled winds for the intrinsic emission, colliding winds in binary systems; see G¨udel & Naz´e, 2009, for a review) for the X-ray emission of massive stars and would be reminiscent of so-called γ Cas-like variables. Our new result is much more in line with typical emission from a colliding wind binary system as would be expected from a Trapezium-like system such as CEN 1a,b, displaying
6We note that these A
V values are larger than those quoted by
Hoffmeister et al. (2008) for the stars in common among our sample. 7We note that Hoffmeister et al. (2008) quote A
V= 4.3 and 4.0 respectively
for OI 345 and CEN 2.
Table 2: Results of the fits of the EPIC spectra of the O-type stars of M 17 with models of the kindwabs*wind*vapec and wabs*wind*vapec(2T). The interstellar neutral hydrogen column densities were frozen at the values given in column 2. The absorption by the ionized wind is accounted for using the model of Naz´e et al. (2004). The abundances of the hot plasma were taken to be 1.0, 2.4, 0.4 and 0.7 times solar for He, C, Fe and all other metals, respectively (see text). A two temperature plasma model is only required for CEN 1a,b and OI 352. In these cases, column six quotes the ratio of the emission measures of the hotter and cooler components. Column 7 provides the reduced χ2of the fit as well as the number of degrees of freedom (in brackets). The observed and absorption-corrected X-ray fluxes are evaluated in the 0.5 – 10 keV energy range.
Star NH log Nwind kT1 kT2 EM2/EM1 χ2ν(d.o.f.) fX fXunabs
1022cm−2 cm−2 keV keV 10−13erg cm−2s−1 10−13erg cm−2s−1
CEN 18 1.13 22.1+0.9 −1.9 0.3 +.4 −.2 – – 1.13 (27) 0.11 1.25 OI 345 0.79 ≤21.6 0.6+.1 −.1 – – 0.91 (29) 0.51 3.22 CEN 1a,b 1.52 21.3+0.1 −0.2 0.61 +.04 −.03 3.8 +.2 −.2 0.70 ± 0.06 1.13 (455) 42.30 129.60 CEN 2 0.77 21.6+0.2 −0.3 0.30 +.05 −.06 – – 0.91 (74) 0.81 9.28 CEN 3 0.55 21.5+0.3 −0.9 0.30 +.09 −.06 – – 1.43 (49) 0.28 2.09 OI 352 1.04 21.70+0.2 −0.2 0.6 +.4 −.2 2.6 +.3 −.3 1.15 ± 0.27 1.05 (234) 11.06 22.87 BD−16◦4826 0.58 21.7+0.4 −0.3 0.31 +.09 −.08 – – 1.21 (29) 0.64 4.28
Figure 6: EPIC spectra of CEN 1a,b (left) and OI 352 (right) along with our best fit models (see Table 2). The lower panels illustrate the residuals in the form of contributions to the overall χ2.
non-thermal radio emission (Rodr´ıguez et al., 2009). The ob-served X-ray flux of CEN 1a,b in the XMM-Newton observa-tion (4.23 × 10⁻¹²erg cm−2s−1) exceeds the combined value of
CEN 1a and CEN 1b in the Chandra observation by about 37%. This difference could result from the combination of various ef-fects, including pile-up of the ACIS-I spectra, some differences in the adopted energy ranges (0.5 – 8.0 keV for Chandra versus 0.5 – 10 keV used here), as well as genuine orbital variability, which is a common feature among colliding wind massive bi-naries.
OI 352 is the second brightest source in our data. Its spectrum is dominated by a hard emission component (kT = 2.6 keV). Broos et al. (2007) reported a temperature of 4.4 keV for the hotter plasma component. Again, our temperature is lower, but the difference is less dramatic than for CEN 1. There is however a rather large discrepancy in the observed fluxes between Chandra ( fX = 4.44 × 10⁻¹³erg cm−2s−1)
and XMM-Newton ( fX = 11.06 × 10⁻¹³erg cm−2s−1). Such
a difference could hardly be attributed to instrumental effects and would thus likely indicate genuine flux variability. The high plasma temperature, the high X-ray luminosity (for an O8 star) and the possible variability all point at this system being a colliding wind binary candidate.
Using the interstellar absorption corrected X-ray fluxes and an estimate of the bolometric fluxes of the O-type stars, we could in principle infer the value of log ( funabs
X /fbol) of the
O-type stars in M 17 and compare it to the typical value of −6.45 ± 0.51 inferred by Naz´e (2009). In the present case, the main uncertainties on log ( fXunabs/fbol) stem from the highly
uncer-tain bolometric luminosities. This is illustrated in Fig. 7, where we have adopted two different approaches for estimating fbol.
First we use the observed V magnitudes, the AVvalues adopted
for the evaluation of NH, and the bolometric corrections from
Martins & Plez (2006). This yields an extremely large value for the bolometric flux of the CEN 1a,b system which would then be X-ray under-luminous. Whilst this method is independent of the actual distance of the stars, it is extremely sensitive to any uncertainties in AV. Alternatively, we have adopted the typical
bolometric luminosities from Martins et al. (2005), assuming a distance modulus of 11.61 and accounting for the multiplicity of CEN 1a, 1b and 18 (Hoffmeister et al., 2008) as well as for the suspected multiplicity of OI 352. This method is hence sen-sitive to the uncertainty on the distance modulus as well as to the assumptions on multiplicity. Figure 7 illustrates the huge impact of the uncertainty on the bolometric flux in the case of CEN 1a,b which would be highly X-ray over-luminous within the second scenario. Nevertheless, we can conclude that on av-erage and within the uncertainties described above, the X-ray luminosities of the O-stars in M 17 follow the standard scaling relation of Naz´e (2009) quite well.
3.2.2. Other point sources
In addition to the O-stars, we have also analyzed the spectra of 13 relatively bright point sources in the field of M 17. Nine of them have a near-IR counterpart (see Table 3). All spectra were fitted both with thermal plasma models, adopting the same
Figure 7: Absorption corrected X-ray flux of the O-type stars versus bolomet-ric flux. The filled symbols yield the bolometbolomet-ric fluxes derived from the V magnitudes and the AV values, whilst the open symbols yield the
bolomet-ric fluxes obtained assuming the stars are typical main-sequence O-stars at a distance of 2.1 kpc. See Sect. 3.2.1 for details. The solid line yields the log ( fXunabs/fbol) = −6.45 relation from Naz´e (2009). The dashed lines cor-respond to the dispersion about this relation.
abundances as for the O-stars, and with non-thermal power-law models. The latter would be relevant for background AGN, un-related to M 17.
The results of these fits are displayed in Table 3. The ther-mal fits indicate very high temperatures, exceeding 2.4 keV, for all sources. Furthermore, with one exception, the best-fit col-umn densities exceed 0.5 × 1022cm−2and reach 3.4 × 1022cm−2
for source #33. This corresponds to E(B − V) = 5.86 or AV = 22.8, adopting the RV value of Hoffmeister et al. (2008).
Hence, it seems unlikely that our sample is significantly pol-luted by foreground stars and most of these sources probably either belong to M 17 or are background objects. Assuming that these sources are located at the distance of M 17 and that the thermal plasma models are adequate, the absorption-corrected fluxes correspond to X-ray luminosities in the range 4.6 × 1031 to 5.5 × 1032erg s−1. The upper limit of this range corresponds
to the highly absorbed source #33 and is thus more uncer-tain because of the correction of the interstellar absorption. If we discard this object, the highest luminosity still amounts to 2.2 × 1032erg s−1.
The high temperatures, the fact that most sources are located in M 17 or behind, the range of luminosities as well as the loca-tion of the near-IR counterparts in the color-magnitude diagram (Fig. 3) suggest that these sources could be pre-main sequence (PMS) stars. PMS stars reach their highest X-ray luminosities during flares and we have thus inspected the X-ray light curves of all the sources of our spectroscopic sample. Whilst most of
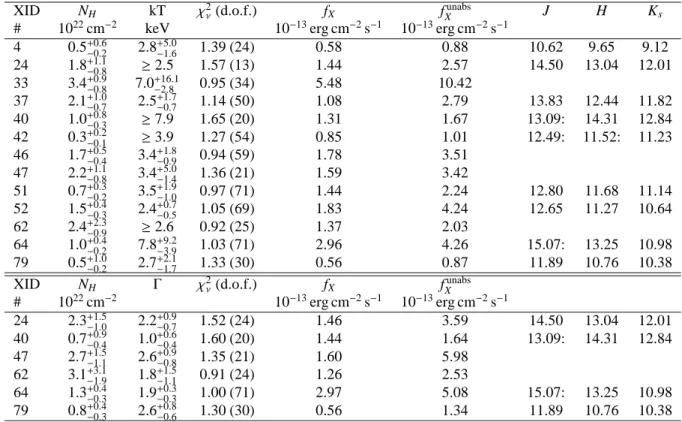
Table 3: Results of the fits of the EPIC spectra of non-O-star point-like sources in the field of M 17 with models of the kindwabs*vapec (upper part of the table) andwabs*power (lower part). In the thermal plasma models, the abundances of the hot plasma were taken to be 1.0, 2.4, 0.4 and 0.7 times solar for He, C, Fe and all other metals, respectively (see text). Column 4 provides the reduced χ2of the fit as well as the number of degrees of freedom (in brackets). The observed and absorption-corrected X-ray fluxes are evaluated in the 0.5 – 10 keV energy range.
XID NH kT χ2ν(d.o.f.) fX fXunabs J H Ks
# 1022cm−2 keV 10−13erg cm−2s−1 10−13erg cm−2s−1
4 0.5+0.6 −0.2 2.8 +5.0 −1.6 1.39 (24) 0.58 0.88 10.62 9.65 9.12 24 1.8+1.1 −0.8 ≥2.5 1.57 (13) 1.44 2.57 14.50 13.04 12.01 33 3.4+0.9 −0.8 7.0 +16.1 −2.8 0.95 (34) 5.48 10.42 37 2.1+1.0 −0.7 2.5 +1.7 −0.7 1.14 (50) 1.08 2.79 13.83 12.44 11.82 40 1.0+0.8 −0.3 ≥7.9 1.65 (20) 1.31 1.67 13.09: 14.31 12.84 42 0.3+0.2−0.1 ≥3.9 1.27 (54) 0.85 1.01 12.49: 11.52: 11.23 46 1.7+0.5−0.4 3.4+1.8−0.9 0.94 (59) 1.78 3.51 47 2.2+1.1−0.8 3.4+5.0−1.4 1.36 (21) 1.59 3.42 51 0.7+0.3−0.2 3.5+1.9−1.0 0.97 (71) 1.44 2.24 12.80 11.68 11.14 52 1.5+0.4−0.3 2.4+0.7−0.5 1.05 (69) 1.83 4.24 12.65 11.27 10.64 62 2.4+2.3−0.9 ≥2.6 0.92 (25) 1.37 2.03 64 1.0+0.4 −0.2 7.8 +9.2 −3.9 1.03 (71) 2.96 4.26 15.07: 13.25 10.98 79 0.5+1.0 −0.2 2.7 +2.1 −1.7 1.33 (30) 0.56 0.87 11.89 10.76 10.38
XID NH Γ χ2ν(d.o.f.) fX fXunabs
# 1022cm−2 10−13erg cm−2s−1 10−13erg cm−2s−1 24 2.3+1.5 −1.0 2.2 +0.9 −0.7 1.52 (24) 1.46 3.59 14.50 13.04 12.01 40 0.7+0.9 −0.4 1.0 +0.6 −0.4 1.60 (20) 1.44 1.64 13.09: 14.31 12.84 47 2.7+1.5 −1.1 2.6 +0.9 −0.8 1.35 (21) 1.60 5.98 62 3.1+3.1 −1.9 1.8 +1.5 −1.1 0.91 (24) 1.26 2.53 64 1.3+0.4 −0.3 1.9 +0.3 −0.3 1.00 (71) 2.97 5.08 15.07: 13.25 10.98 79 0.8+0.4 −0.3 2.6 +0.8 −0.6 1.30 (30) 0.56 1.34 11.89 10.76 10.38
the sources do not show a significant, coherent variability be-tween the different EPIC cameras, source #37 undergoes a flar-ing event towards the end of the observation, although our data only cover the onset of the flare, with the count rate increasing by a factor ∼ 25.
For about half of the sources in our sample, a slightly bet-ter fit quality is obtained with an absorbed power-law model. These fits are listed in the lower part of Table 3. When fitted with thermal plasma models, these sources indicate rather high best-fit temperatures: in some cases, only a lower limit to kT could be obtained.
One source that is of special interest is #52. It is the third brightest non-O-star source with an X-ray luminosity of 2.2 × 1032erg s−1. This object has two Chandra counterparts,
CEN 98 (photometric spectral type B4 V, Chini et al., 1980) and CEN 97 (photometric spectral type B1 V, Chini et al., 1980), both located at 1.68 arcsec from the XMM source. There is no UV counterpart detected with the Optical Monitor, which is consistent with a deeply embedded source, as suggested by the large NH and the AV of 10.6 and 11.0 mag quoted by
Chini et al. (1980) for CEN 97 and 98 respectively. Broos et al. (2007) derived observed X-ray fluxes of 5.0 × 10⁻¹⁴and 6.3 ×
10−14erg cm−2s−1, which combined together are slightly less
than our value (1.83 × 10⁻¹³erg cm−2s−1). This source
there-fore apparently corresponds to a pair of early-mid B-type stars with an exceptionally large X-ray luminosity. Indeed, typical
X-ray luminosities of early B main sequence stars are about a factor ten below the result found here (Naz´e et al., 2011) and many of the mid-late B stars detected in X-rays are likely bi-naries with a low-mass PMS companion being the X-ray emit-ter (Evans et al., 2011). It would be highly inemit-teresting to re-investigate the spectral types of these stars and to look for mul-tiplicity or other peculiarities.
3.3. The diffuse emission
As stated in Sect. 1, soft diffuse X-ray emission from the M 17 superbubble was detected with previous X-ray observa-tories (Dunne et al., 2003; Townsley et al., 2003a; Hyodo et al., 2008). This emission is strongest around the core of the ion-izing cluster, NGC 6618, and further extends towards the east-south-east direction as an elongated structure (Townsley et al., 2003b, see also Fig. 1).
Dunne et al. (2003) noted a huge discrepancy between the observed level of X-ray emission and the two orders of mag-nitude higher level expected for a model of a wind-blown su-perbubble including heat conduction (Weaver et al., 1977, see also A˜norve-Zeferino et al. 2009). They suggested that this dis-crepancy stems from the effect of heat conduction and found a better agreement for models where heat conduction is sup-pressed (probably by magnetic fields), but dynamical mixing of cold interstellar material with the hot gas of the bubble is included.
Figure 8: MOS 1 and MOS 2 spectra of the diffuse X-ray emission in M 17.
Because of their superb angular resolution, the Chandra data rule out the possibility that a substantial fraction (more than about 8%) of the diffuse emission could be due to un-resolved late-type pre-main sequence stars (Townsley et al., 2003b). These data yielded an (absorption corrected) X-ray lu-minosity of LX = 3.4 × 1033erg s−1 in the 0.5 – 2 keV band
assuming a distance of 1.6 kpc (Townsley et al., 2003b). A very similar luminosity (LX = 3.5 × 1033erg s−1 in the 1.0 –
8.0 keV energy band) was obtained by Hyodo et al. (2008) from a Suzaku observation.
Reyes-Iturbide et al. (2009) presented 3-D hydrodynamical simulations of the M 17 superbubble and its X-ray emission. They successfully reproduced the observed champagne flow morphology and luminosity of the X-ray emission. These authors demonstrate the importance of the inhomogeneous interstellar medium and of the interaction of the cluster wind with the dense molecular cloud for correctly reproducing the observed X-ray luminosity.
We have first extracted the spectrum of the diffuse emis-sion around the core of NGC 6618, excluding all detected point sources. This spectrum can be fitted with a two-temperature thermal plasma model with kT of 0.8 and ∼ 4.0 keV (Mernier, 2012). The higher temperature is most probably an indication of residual contamination by a population of unresolved point sources associated with pre-main sequence stars.
As a next step, we have then extracted the diffuse X-ray emission within a rectangular box centered on (18:20:52.1, −16:12:09), with a size of 8 × 2.2 arcmin and inclined by 20◦ with respect to the west-east direction, excluding two point sources. This box is slightly smaller than the 8 × 3.5 arcmin2
region used by Townsley et al. (2003b) and avoids the cen-tral part of NGC 6618 whilst extending somewhat farther away from the cluster. The background was extracted over a circular area of radius 0.9 arcmin centered on (18:20:33.1, −16:13:44). The resulting EPIC-MOS spectra are illustrated
in Fig. 8. They are qualitatively similar to the spectrum pre-sented by Townsley et al. (2003b). The latter authors used a two-temperature model with one component (kT = 0.13 keV) with solar composition and another one (kT = 0.6 keV) with non-solar abundances. The Suzaku observation was fitted with a single temperature (kT = 0.25 keV) plasma model with clearly sub-solar metallicity (Hyodo et al., 2008).
Here, we have adopted a different approach, fixing the plasma abundances of all components to the same mix as used for the point sources in M 17. The best-fit (χ2ν = 0.89 for 169 d.o.f.) parameters are NH = 0.76+.13−.19×1022cm−2, kT1 =
0.11+.95
−.11keV, kT2 = 0.22
+.12
−.03keV, EM2/EM1 = 0.20 and fX =
5.76 × 10⁻¹³erg cm−2s−1. The observed flux is about half the
value found with Chandra. This difference most likely reflects the somewhat different extraction regions used in the present study and in the analysis of the Chandra data. Our study thus reveals that the spectral parameters derived from the spectrum of the diffuse emission are quite sensitive to the treatment of several aspects, such as the plasma abundances, the definition of the extraction regions of the source and the background, and the possible contamination by unresolved point sources.
4. Summary and conclusions
In this paper, we have analyzed X-ray and UV data obtained during a 30 ksec XMM-Newton observation of M 17.
The brightest X-ray point sources are associated with seven O-type stars or systems of such stars. The X-ray images are dominated by the Trapezium-like system CEN 1a,b ((O4 V + O) + (O4 V + O)) and the O8 V star OI 352. In both cases we have shown that the EPIC spectra yield plasma tempera-tures that are significantly lower than found in a previous study by Broos et al. (2007) and are in very good agreement with a colliding winds scenario. An optical or near-IR spectro-scopic monitoring of these stars, although challenging because of the large interstellar absorption and unknown orbital peri-ods, would be extremely useful to establish their multiplicity and provide their orbital properties.
There is a very large uncertainty on the LX/Lbol ratios of
the O-type stars in M 17. This uncertainty mainly stems from the impact of the huge (and sometimes poorly known) redden-ing on the estimates of the bolometric luminosities. Whilst the LX/Lbolratios agree on average with the canonical relation
es-tablished for a large sample of O-stars, the large uncertainties in the present case prevent us from a more detailed comparison that might reveal subtle differences and environmental effects.
The majority of the secondary X-ray sources are likely low-mass pre-main sequence stars, with about 1/6 of the objects showing some evidence of near-IR excesses attributable to cir-cumstellar material. The near-IR counterparts of our X-ray sources span a wide range in reddening, which makes a quanti-tative comparison of their colors and magnitudes with theoret-ical evolutionary tracks very difficult. Out of the 13 brightest X-ray sources, not associated with an O-star, only one displays a flare in our 30 ksec observation. This can be compared to the results of the 40 ksec Chandra observation: Broos et al. (2007)
reported significant variability for 39 out of 886 sources, with a wide range of flare morphologies. Beside this short-term (flar-ing) activity, there must also be a substantial long-term (of or-der months or years) variability of the X-ray sources of M 17. Indeed, the relation between the ACIS-I count rates, recorded in March 2002, and the EPIC-MOS rates, measured twenty months later, exhibits a very important scatter which likely re-flects this variability.
There is little correspondence between the 92 X-ray sources and the 614 UV detections. Most of the UV sources are in fact foreground objects, unrelated to M 17. The UV data also reveal some nebular emission eastwards of the central cluster.
Throughout this work, we have fitted the X-ray spectra of point and diffuse sources with plasma models accounting for the specific metal abundances of the M 17 nebula as determined by Garc´ıa-Rojas et al. (2007), except for the iron abundance. Indeed, the latter is clearly higher in our spectra than reported by Garc´ıa-Rojas et al. (2007). This is an interesting puzzle and, although an in-depth analysis of this effect is beyond the scope of the present paper, we suggest that this discrepancy might be related to ionization effects. The presence of a very hot plasma (as revealed by the diffuse X-ray emission) might impact on the ionization stages of iron and could bias the abundances inferred from optical diagnostics ([Fe ii] and [Fe iii] lines).
Acknowledgements
We thank Dr. Ya¨el Naz´e for sharing her spectral extrac-tion routines with us. We acknowledge support from the Fonds de Recherche Scientifique (FRS/FNRS), through the XMM/INTEGRAL PRODEX contract as well as by the Com-munaut´e Franc¸aise de Belgique - Action de recherche concert´ee - Acad´emie Wallonie - Europe. This research made use of data products from the Two Micron All Sky Survey, which is a joint project of the University of Massachusetts and the Infrared Pro-cessing and Analysis Center/California Institute of Technology, funded by NASA and NSF.
References
A ˜norve-Zeferino, G.A., Tenorio-Tagle, G., & Silich, S. 2009, MNRAS 394, 1284
Arnaud, K.A. 1996,in Astronomical Data Analysis Software and Systems V, eds. Jacoby, G., & Barnes, J., (San Francisco, ASP), 101, 17
Asplund, M., Grevesse, N., Sauval, A. J., & Scott, P. 2009, ARA&A, 47, 481 Bohlin, R.C., Savage, B.D., & Drake, J.F. 1978, ApJ 224, 132
Broos, P.S., Feigelson, E., Townsley, L.K., et al. 2007, ApJS 169, 353 Chini, R., Els¨asser, H., & Neckel, T. 1980, A&A 91, 186
Chini, R., & Kr¨ugel,E. 1985, A&A 146, 175
Chini, R., Nielbock, M., & Beck, R. 2000, A&A 357, L33
Cutri, R.M., Skrutskie, M.F., Van Dyk, S., et al. 2003, The 2MASS All-Sky Cat-alog of Point Sources, University of Massachusetts and Infrared Processing and Analysis Center (IPAC/California Institute of Technology)
Dunne, B., Chu, Y.-H., Chen, C.-H.R., et al. 2003, ApJ 590, 306 Evans, N.R., DeGioia-Eastwood, K., Gagn´e, M., et al. 2011, ApJS 194, 13 Garc´ıa-Rojas, J., Esteban, C., Peimbert, A., Rodr´ıguez, M., Peimbert, M., &
Ruiz, M.T. 2007, RevMexAA 43, 3 G ¨udel, M., & Naz´e, Y. 2009, A&ARv 17, 309
Hanson, M.M., Howarth, I.D., & Conti, P.S. 1997, ApJ 489, 698
Hoffmeister, V.H., Chini, R., Scheyda, M., Schulze, D., Watermann, R., N ¨urnberger, D., & Vogt, N. 2008, ApJ 686, 310
Hyodo, Y., Tsujimoto, M., Hamaguchi, K., et al. 2008, PASJ 60, S85 Jansen, F., Lumb, D., Altieri, B., et al. 2001, A&A, 365, L1 Jeffries, R.D., Thurston, M.R., & Pye, J.P. 1997, MNRAS, 287, 350
Kassis, M., Deutsch, L.K., Campbell, M.F., Hora, J.L., Fazio, G.G., & Hoff-mann, W.F. 2002, ApJ 124, 1636
Martins, F., & Plez, B. 2006, A&A, 457, 637
Martins, F., Schaerer, D., & Hillier, D.J. 2005, A&A 436, 1049 Mason, K.O., Breeveld, A., Much, R., et al. 2001, A&A 365, L36 Mernier, F. 2012, Master Thesis, University of Li`ege
Meyer, M.R., Calvet, N., & Hillenbrand, L.A. 1997, AJ, 114, 288 Naz´e, Y. 2009, A&A 506, 1055
Naz´e, Y., Rauw, G., Vreux, J.-M., & De Becker, M. 2004, A&A 417, 667 Naz´e, Y., Broos, P.S., Oskinova, L.M., et al. 2011, ApJS 194, 7
Nielbock, M., Chini, R., Hoffmeister, V.H., Scheyda, C.M., Steinacker, J., N ¨urnberger, D., & Siebenmorgen, R. 2007, ApJ 656, L81
Nielbock, M., Chini, R., Hoffmeister, V.H., N ¨urnberger, D.E.A., Scheyda, C.M., & Steinacker, J. 2008, MNRAS 388, 1031
N ¨urnberger, D.E.A., Chini, R., Eisenhauer, F., et al. 2007, A&A 465, 931 Ogura, K., & Ishida, K. 1976, PASJ 28, 35
Oke, J.B. 1974, ApJS, 27, 21
Povich, M.S., Churchwell, E., Bieging, J.H., et al. 2009, ApJ 696, 1278 Rauw, G. 2011, A&A 536, A31
Rauw, G., De Becker, M., Gosset, E., Pittard, J.M., & Stevens, I.R. 2003, A&A 325, 167
Reyes-Iturbide, J., Vel´azquez, P.F., Rosado, M., Rodr´ıguez-Gonz´alez, A., Gonz´alez, R.F., & Esquivel, A. 2009, MNRAS 394, 1009
Rodr´ıguez, L.F., Gonz´alez, R.F., & Montes, G. 2009, RevMexAA 45, 273 Sana, H., Rauw, G., Sung, H., Gosset, E., & Vreux, J.-M. 2007, MNRAS 377,
945
Skrutskie, M.F., Cutri, R.M., Stiening, R., et al. 2006, AJ 131, 1163
Smith, R.K., Brickhouse, N.S., Liedahl, D.A., & Raymond, J.C. 2001, ApJ, 556, L91
Straiˇzys, V., & Laugalys, V. 2008, Baltic Astronomy 17, 253 Str¨uder, L., Briel, U., Dennerl, K., et al. 2001, A&A, 365, L18
Tokunaga, A.T. 2000, in Allen’s Astrophysical Quantities, editor A.N. Cox, AIP Press, Springer, New York
Townsley, L.K., Feigelson, E.D., Montmerle, T., Broos, P.S., Chu, Y.-H., & Garmire, G.P. 2003a, ApJ 593, 874
Townsley, L., Broos, P., Chu, Y.-H., Feigelson, E., Garmire, G., Getman, K., & Montmerle, T. 2003b, RevMexAASC 15, 190
Turner, M.J.L., Abbey, A., Arnaud, M., et al. 2001, A&A, 365, L27
Weaver, R., MacCray, R., Castor, J., Shapiro, P., & Moore, R. 1977, ApJ 218, 377


![[PDF] Cours Utilisation de NetBeans pour les applications J2ME | Formation informatique](data:image/gif;base64,R0lGODlhAQABAIAAAP///wAAACH5BAEAAAAALAAAAAABAAEAAAICRAEAOw==)