To cite this document:
Ramiro, Victor and Lochin, Emmanuel and Sénac, Patrick and
Rakotoarivelo, Thierry Temporal random walk as a lightweight communication
infrastructure for opportunistic networks. (2014) In: The 8th IEEE WoWMoM
Workshop on Autonomic and Opportunistic Communications (IEEE AOC'14), 16 June
2014 - 16 June 2014 (Sydney, Australia).
O
pen
A
rchive
T
oulouse
A
rchive
O
uverte (
OATAO
)
OATAO is an open access repository that collects the work of Toulouse researchers and
makes it freely available over the web where possible.
This is an author-deposited version published in:
http://oatao.univ-toulouse.fr/
Eprints ID: 11766
Any correspondence concerning this service should be sent to the repository
administrator:
[email protected]
Temporal random walk as a lightweight
communication infrastructure for opportunistic
networks
Victor Ramiro
†, Emmanuel Lochin
†, Patrick S´enac
†, Thierry Rakotoarivelo
‡†
ISAE/University of Toulouse, Toulouse, France
‡
National ICT Australia (NICTA), Alexandria, Australia
Abstract—This paper explores the idea of sharing a common storage unit (token) as a lightweight communication infrastruc-ture for opportunistic networks. Instead of using contacts as opportunities to transfer messages, we use them to pass the token over time. We implement a Temporal Random Walk (TRW) process to support such evolution. Sending a message is equivalent to copying it in the token and passing the token to a connected node. Eventually the recipient node will get the token and all its addressed messages. We study our approach using both synthetic and real traces. We show that it can be equivalent to common routing strategies in terms of delivery ratio and delay.
Keywords—Opportunistic Networks, Temporal Random Walk, DTN.
I. INTRODUCTION
Opportunistic networks assume that all nodes in the network may interact using their contacts as a communication opportu-nity [1], [2]. The store-carry-forward paradigm allows nodes to exploit such contacts to effectively deliver messages over time. In real life social networks, we are often unable to transmit data even if two parties are in contact. The different device technologies or even the use of different routing algorithms may prevent opportunistic communications. So we raise the question: can we design a mobile and opportunistic
infrastruc-ture that could help deliver messages?We explore the idea and
impact of such a minimal and non invasive infrastructure. Experiments have studied and characterized opportunistic networks in real life scenarios [3], [4]. For instance, let us consider an academic conference where attendees want to share data with other attendees. WiFi access is often scarce, saturated or simply non existent in conferences. Is it still possible to share data in that scenario? The store-carry-forward message diffusion proposes a solution for such cases: when two parties are in contact (defined by a connection range) they can share data. Nevertheless, this assumes that both parties either have a specific device or understand the same protocol to actually profit from the contact opportunity. Even with today’s smartphone revolution, such a solution can be cumbersome due to lack of connection, complexity to interconnect mobile devices, or different routing protocols.
The easiest solution to transfer data could be using a USB key (often provided to each participant) to copy and pass messages among attendees. We extend this analogy, i.e if we want to send a message to a given destination, we copy the
message into a USB key (token) and physically pass it to one of our current contacts. If one of them is the recipient, the process is finished. Otherwise we can keep passing the token among contacts. Eventually, given the dynamic of the opportunistic contacts, the token will reach its final recipient, who will then receive the data. Notice that in this case, we use the opportunistic network to define the way we pass the token among the nodes, not as a communication opportunity in the sense of store-carry-forward protocols.
The process to pass the token is similar to a random walk. Random walk and its extension to temporal graphs [5] are known as lightweight methods to sample data in graphs [6]. Our previous work successfully used temporal random walks to monitor the intercontact time distribution in DTNs [7]. We push this idea further by introducing a temporal random walk as a lightweight communication infrastructure for opportunistic networks. To the best of our knowledge, this is a novel approach to provide a mobile communication infrastructure.
Our main contribution is based on the temporal random walk and it defines how one or more tokens evolve in the network to provide a communication medium among nodes. We propose two token interaction strategies and we quantify the delay introduced by the resulting process. Using both synthetic and real traces, our simulations show that we have either better or as good delivery ratio as a known DTN routing algorithm. Yet, when our approach outperforms the known routing algorithm in terms of delivery ratio, we observe a delay increase. Nevertheless, when comparing equivalent delivery ratios among approaches, we obtain equivalent delays.
This paper is structured as follows. In Section II, we briefly introduce temporal random walks and show how to use them as a communication infrastructure in Section III. Section IV presents the evaluation of our approach and Section V dis-cusses its limits and benefits. Section VI presents some related works, and Section VII concludes with some future works.
II. TEMPORAL RANDOM WALKS
This section briefly describes a random walk on graphs and its extension to temporal graphs.
A. Random walks
A random walk process over a static graph starts from one randomly selected node of the network. The walk then selects
A D B C E A D B C E A D B C E 𝝉 1 𝝉2 𝝉3
Figure 1: Evolution of the temporal random walk process
the next node among the node’s neighbors following a uniform
probability. Notice that the probability for a given node n∗ at
thek-step of the walk is independent of the previous step and
expressed by deg(n1 ∗). Some extensions propose to run multiple
walkers in parallel [6].
B. Temporal random walks (TRW)
A random walk on temporal graphs was introduced in [5].
It differs from random walk as follows: at time t1, a starting
node is randomly selected; after a given time γ one of the nodes’ current neighbors is selected with uniform probability; the process repeats at rate γ from the last selected node.
For instance, in Figure 1 we see that at time τ1A is selected
as starting node. At this time,A is connected with {B, C, D}.
C is randomly selected with 1/3 probability. Then at time τ2
the connections have changed. We can see thatC is connected
with {B, D}. In this case B is selected randomly with 1/2
probability. Finally at time τ3 E is selected as the only
connected node. Here we notice two things: (i) the degree of
a node changes with time,deg(A) = {(τ1, 2), (τ2, 0), (τ3, 1)},
hence the selection probabilities change, and (ii) in the tem-poral random walk we can profit from temtem-poral paths that are created with the evolution of the communication: the path between A and E only exists thanks to other nodes’ contacts.
III. TRW AS A COMMUNICATION INFRASTRUCTURE
In this section we formalize how to use a TRW as a lightweight infrastructure to communicate among nodes in op-portunistic networks. Notice that the algorithm is a generalized version where we can have more than one token in parallel.
A. Model basics
We model a DTN as a finite set of graph snapshots
G = {G1, G2, . . . , GT}, where Gi= (V, E(τi)) represents the
connection graph at time τi ∈ Γ = {τ1, τ2, . . . , τT}. The nodes
of the graph are defined in V = {n1, n2, . . . , nN} and the
edgesE(τi) are defined as the set of connected nodes at time
τi. The time window δ= τi+1−τi, ∀i defines the granularity
with which we observe at a discrete level the evolution of the network. For the TRW We define the set of tokens
T = {T1, T2, . . . , Tk} and the function trw : T × Γ → V
which associates a token with a node at a given time.
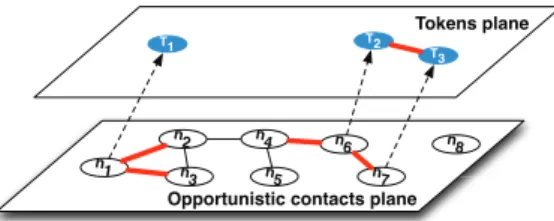
n1 n2 n7 n6 n3 T1 T3 T2 n8 n4 n5 Tokens plane
Opportunistic contacts plane
Figure 2: Opportunistic contacts v/s TRW interactions planes
B. TRW model in a nutshell
We present an example to illustrate how to exploit the TRW to communicate among nodes. Figure 2 depicts the
association function at time τ∗ between 7 nodes and 3 tokens,
namely trw(·, τ∗) = {(T
1, n1), (T2, n6), (T3, n7)}. The
func-tion entails two layers of interacfunc-tions, the opportunistic contact plane and the token plane. In the former we see all existing
opportunistic links between nodes, e.g. n1 is connected with
n2 andn3. In the latter we see how the tokens are connected,
e.g. the token T2 with the token T3. The TRW progresses
as follows: since n1 holds the token T1, it can retrieve any
addressed messages from it and add new ones for other nodes.
Then n1 randomly passes the token to one of its neighbors
(n2 orn3) at the next time step τ∗+ δ. We can see in red all
edges that may be selected for the TRW process. Nodes n6
andn7will pass to one of their neighbors the tokenT2andT3,
respectively. To increase each token’s spatial range, we require that a token can only be passed to a node that does not hold
a token at time τ∗. Thus, T
2 will be passed to n4 and T3
will stay with n7. Finally, we study two cases of connections
among tokens: either tokens merge their contents (TRW-M) or not (TRW). The rationale of merging tokens is to increase the span of messages in the spatio-temporal dimension.
C. TRW implementation
The implementation of TRW in a real DTN is a distributed algorithm. At each step of the process, a token holder will
(i)exchange synchronization messages with its neighbors; (ii)
define the set of neighbors that can receive a token; (iii) pass the token. For simplicity, we present a centralized version of the algorithm. There are no structural differences between both versions. The centralized one keeps a global table at each step to avoid the probes for potential nodes to pass the token to.
Algorithm 1 presents the implementation details. The TRW procedure is called at each step of the process, and it attempts to pass the token to the node’s neighbors. TRW builds a list of selected nodes that will hold the token (line 2). For each node in the network, TRW checks if that node holds a token (line 4). If so, we check if that node is connected to at least one other node and also that it can release its token according to the TRW γ rate (line 6). When more than one token is moving around, we recall a node can only hold one token at a time. The filter procedure checks which of the connected nodes are or will hold the token to remove them from the possible candidates (line 8). Finally, a node is chosen uniformly from one of the filtered neighbors (line 10) and the token is passed (line 12).
Algorithm 1 Temporal Random Walk algorithm. Notice this function is called at each δ time step of the process
1: procedure TRW(nodes) 2: added← list() 3: for n∈ nodes do 4: if hasT oken(n) then 5: t← getT oken(n)
6: if degree(n) > 0 & canRelease(t) then 7: neighbors← getN eighbors(n) 8: l← f ilter(neighbors, added) 9: if size(l) > 0 then
10: k← unif ormSelect(l) 11: put(k, added)
12: passT oken(n, k, t)
Algorithm 2 Filter algorithm with tokens merging option (TRW-M)
1: procedureFILTER(neighbors, added) 2: l← list()
3: for n′∈ neighbors do
4: if ¬hasT oken(n′) then
5: if ¬contains(n′, added) then
6: put(n′, l)
7: else if hasT oken(n′) then
8: mergeT okens(n, n′)
9: return(l)
When two token holder nodes meet, they will not exchange their tokens. However as explained in Section III-B, this opportunistic encounter can be used to merge both token information thus increasing the probability to deliver messages. Algorithm 2 presents a filtering method using this token-merging process.
IV. MODEL EVALUATION
In this section we describe the main hypothesis for the evaluation and its results. We perform a series of simulations with synthetic and real traces using the ONE Simulator [8]. We review and discuss our assumptions later in Section V. A. Experimental setup
We try TRW and TRW-M in different scenarios with
increasing number of tokens in the network, i.e. |T | =
{1, 2, 4, 8, 16, 32}. The message creation process randomly
selects a node and adds a new message of 500 kb each 100
seconds. Since we want to study the long term behavior of the TRW process, we impose that the tokens can store an infinite number of messages and that those messages have infinite time to live.
We compare our results with the well known Binary Spray and Wait [9] routing protocol (BSW). While BSW is funda-mentally different from our approach (restricted message copy at each contact versus token exchange at each contact), we use it as a baseline for comparison in the case of a homogeneous network of nodes sharing the same protocol. Specifically, we compare the average delivery ratio and the average delivery
delay with BSW (with increasing number of messages copies {1, 2, 4, 8, 16, 32}). Each BSW node is equipped with a simple
broadcast interface of250 kbps and 10 meters range. A BSW
node has a buffer of 5 M b (10 messages). Notice that BSW
with one message is equivalent to direct contact delivery and does not perform as standard BSW.
We assume that the writing and reading time of a message in the token is negligible. Also, merging two tokens is instan-taneous (infinite bandwidth). In the following we will consider that the step of the TRW is equal to the update interval of the simulator which is set to 1 second.
B. Synthetic traces
We use the RandomWayPoint model (RWP) to generate
synthetic traces. We have 100 nodes moving with a speed
between0.5 and 1.5 m/s. We simulate three densities of nodes:
103,104and105nodes/km2, to show the impact of increasing
opportunistic contacts. Each simulation represents 24 hours. We repeat each scenario 10 times to account for variability. We present the mean value in a 95% confidence interval.
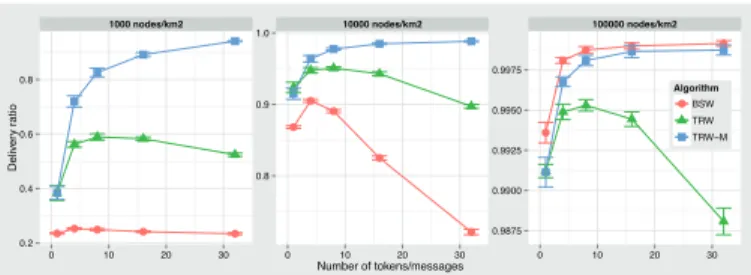
Figure 3 shows that for the highest density scenario, all methods behave similarly. The increasing number of copies in BSW increases the delivery ratio. As expected, adding more tokens increase the delivery ratio as well. Nevertheless, with TRW we see in all cases a decay when more than 8 tokens are aggregated. The more tokens that are in the network, the less the token can be passed (due to the restriction of not passing a token to a node who already holds one). This is not the case for TRW-M which profits from tokens interactions to increase the number of messages stored in them. We also see how BSW is affected when decreasing the density. The lower the density, the fewer contacts, therefore the lower delivery ratio. In the middle density scenario increasing the number of copies has a
negative effect decreasing the delivery ratio from90% to 70%.
This decrease is due to the controlled flooding process of BSW and the consequent dropping of messages. The dropping occurs when a node exceeds the maximum number of messages on its buffer. In the three scenarios, TRW-M delivery ratio is maximized with the larger number of tokens. Nevertheless we see that the difference between 4,8 or 16 tokens is less than 10%.
Figure 4 shows the impact on the average delay. For the three cases, adding more tokens in TRW adds more delay for the same reason nodes cannot pass the token. In the TRW-M case adding tokens considerably decreases the delay. The delay of BSW is always lower when increasing the number of copies. Even when the delivery ratio is low, the delay is low because only the newest messages are kept in the buffer (even though the TTL is infinite).
C. Real traces
We perform our evaluation using Haggle [10], [3], [4] and RollerNet [11] traces. All are Bluetooth sighting traces by groups of users carrying small devices (iMotes) for a given period. Table I summarizes the different traces and their
char-acteristics1. Both Infocom experiments were conducted during
●● ● ● ● ● ● ● ● ● ● ● ● ● ● 1000 nodes/km2 10000 nodes/km2 100000 nodes/km2
0.2 0.4 0.6 0.8 0.8 0.9 1.0 0.9875 0.9900 0.9925 0.9950 0.9975 0 10 20 30 0 10 20 30 0 10 20 30 Number of tokens/messages D e liv e ry ra ti o Algorithm ●BSW TRW TRW−M
Figure 3: Average delivery ratio for RWP when increasing number of tokens/messages for TRW, TRW-M, BSW
● ● ● ● ● ● ● ● ● ● ● ● ● ● ● 1000 nodes/km2 10000 nodes/km2 100000 nodes/km2
10000 20000 30000 2000 4000 6000 8000 250 500 750 1000 0 10 20 30 0 10 20 30 0 10 20 30 Number of tokens/messages A ve ra g e d e la y (se cs) Algorithm ●BSW TRW TRW−M
Figure 4: Average delay for RWP when increasing number of tokens/messages for TRW, TRW-M, BSW
Traces Nodes δ (secs) Connections Duration
Hours Days
Cambridge 36 600 10641 274.3 11.4
Infocom 2005 41 120 22459 76.4 3.2
Infocom 2006 98 120 170601 95.3 4
RollerNet 62 15 6015 2.8 <1
Table I: Traces configuration
their respective conference and workshops trying to capture an opportunistic network in an academic event. The Cambridge experiment investigated the feasibility of a city-wide content distribution architecture composed of short range wireless access points. RollerNet was collected among a thousand participants of a rollerblading tour in Paris. RollerNet studies a class of DTNs that follow a pipelined shape presenting the accordion phenomenon.
As we saw in Section IV-B, BSW is highly affected by nodes’ buffer size. In this section, we also test BSW with a 100-message buffer (BSW-100). We repeat each experience 5 times and we present a mean value in a 95% confidence interval.
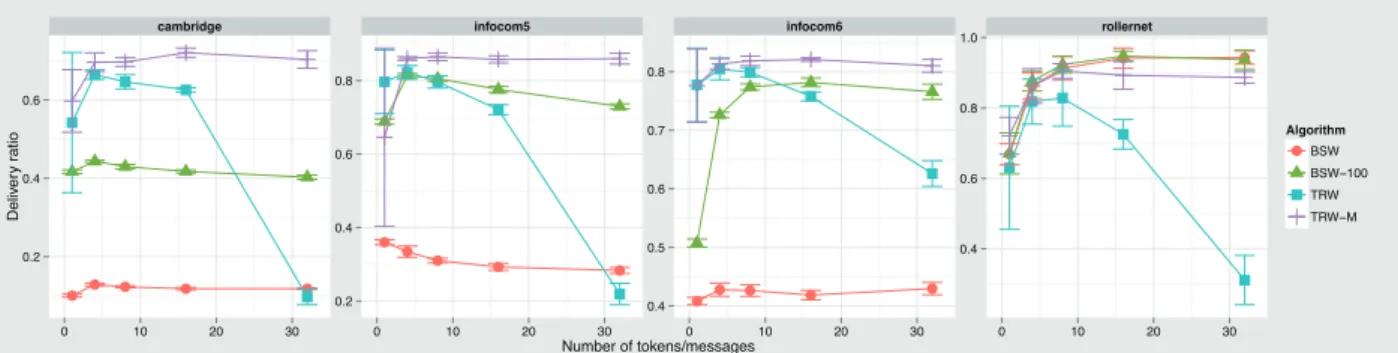
Figure 5 shows a large variance for the average delivery ratio with just one token for both TRW and TRW-M. This variance decreases when adding more tokens. Also, we see the impact of buffer size in BSW. In all Haggle traces we
see a boost. Cambridge increases from15% to 40%, Infocom
2005 from 35% to almost 80% and Infocom 2006 from 40%
to 75%. RollerNet is a special case with a higher density of
contacts, both versions of BSW performs equally well. We also confirm the decay in TRW above a given number of tokens. In this case we see in between 2 and 4 is the optimal. It is important to notice that at Infocom and RollerNet with
Technology Bandwidth Bluetooth 1.0 700 Kbps Bluetooth 2.0 2 Mbps Bluetooth 3.0/4.0 25 Mbps WiFi (device-to-device) 11 Mbps WiFi direct 250 Mbps
USB 2.0 10-280 Mbps (full/hi speed)
USB 3.0 3200 Mbps
Thunderbolt 6400 Mbps
Table II: Typical transfer rates for communication technologies
TRW and 4 tokens, we have more than 80% delivery ratio.
Cambridge delivery ratio degrades to 63% due the longer
duration of the experience. Also as expected, we notice that TRW-M produces the best results in all Haggle traces and in
the case of RollerNet, results are close to BSW (less than10%
off). Finally, we see the stability of TRW: just 4 tokens suffice to get high delivery ratio.
As expected, the delay of both TRW and TRW-M is larger than BSW (Figure 6). This increase is due to the lack of boundaries of the random walk process with respect to message delivery, i.e. the token moves wherever it can, no questions asked. Also we confirm that the boost on BSW with a bigger buffer increases the delay. In this case the nodes are able to store messages for a longer time before dropping. We see the same increasing delay impact in TRW when adding more tokens, confirming the results from Section IV-B. However, the increase in delay is associated with an increase in deliv-ery ratio. When comparing equivalent delivdeliv-ery ratio between TRW-M and BSW, we observe equivalent delays. For instance in RollerNet with 2, 4 or 8 tokens/messages, we confirm that BSW and TRW-M have similar delivery ratio and delay. We see the maximum delay difference with 32 tokens/messages with an increase of less than 5 minutes.
Finally we present in Figure 7 the ratio between delivered and created messages over simulation time. The best results are for the highest ratio, meaning it creates and delivers messages faster. We present a non-aggregated view to show the difference between all algorithms and the number of tokens/messages. In all Haggle traces, these ratios tend to be lower for BSW. This is consistent with the previous low performance obtained by BSW on those traces.
Furthermore in the Haggle traces we can see the effect of day/night in the peaks of TRW and TRW-M. Since the message creation process does not stop at night, and there are less contacts at that period, we observe a decrease in the ratio. Those messages stay stored in the nodes. When back on day regime, we see a fast increase of the ratio due to the greater token movement and hence delivery of messages. RollerNet is a complete different case. We see how spread out are all the methods over time. We confirm that TRW behaves worst when more tokens are added (lower ratio). Nevertheless, the delivered/created ratio pace suggest the size of the token does not explode in time (the integral of the curve accounts for the number of messages stored in the token over time).
V. DISCUSSION
This Section discusses the assumptions, limits and benefits of our approach. The main concerns can be grouped in the time
●● ● ● ● ● ● ● ● ● ● ● ● ● ● ● ● ● ● ●
cambridge infocom5 infocom6 rollernet
0.2 0.4 0.6 0.2 0.4 0.6 0.8 0.4 0.5 0.6 0.7 0.8 0.4 0.6 0.8 1.0 0 10 20 30 0 10 20 30 0 10 20 30 0 10 20 30 Number of tokens/messages D e liv e ry ra ti o Algorithm ●BSW BSW−100 TRW TRW−M
Figure 5: Average delivery ratio for traces when increasing number of tokens/messages for TRW, TRW-M, BSW, BSW-100
●● ● ● ● ● ● ● ● ● ● ● ● ● ● ● ● ● ● ●
cambridge infocom5 infocom6 rollernet
0e+00 1e+05 2e+05 3e+05 20000 40000 60000 80000 10000 20000 30000 40000 50000 1000 2000 0 10 20 30 0 10 20 30 0 10 20 30 0 10 20 30 Number of tokens/messages A ve ra g e d e la y (se cs) Algorithm ●BSW BSW−100 TRW TRW−M
Figure 6: Average delay for traces when increasing number of tokens/messages for TRW, TRW-M, BSW, BSW-100
Figure 7: Delivered/Created messages ratio for traces over time with different number of tokens/messages for TRW, TRW-M, BSW, BSW-100
considered to read/write in the token (we assume negligible time) and the cost of merging tokens (we assume infinite bandwidth). Both can be explained in terms of technology: the USB key analogy is just a toy example that allows us to devise such a token where the transfer rate is several orders of magnitude greater than current wireless technologies. As we can see on Table II, our assumption is not far from reality: Bluetooth 4.0 is 128 times slower than USB 3.0 and 256 times slower than Thunderbolt. Merging messages could be done with the same high speed communication interface among tokens (in the tokens’ interaction plane).
One could also argue that we should count the time of mounting/unmounting the token on the computer, but this is
equivalent to someone selecting a file to transfer in a standard manner. Again, we can think in a technology where this process is not cumbersome, e.g. contactless smart cards. Also in terms of storage capacity we know a simple USB key has more imaginable memory than any iMote device.
In our evaluation section, we decided to compare un-bounded TRW and TRW-M methods with a un-bounded BSW method. We do acknowledge that this choice is not fair in terms of absolute performance comparison for BSW. However, our goal was merely to illustrate the viability of TRW/TRW-M as a novel communication solution in DTNs, rather than provide a comprehensive argument on why use one approach instead of the other. BSW is a popular protocols to optimally distribute
information in DTNs and as such it seemed relevant to use it as a baseline to demonstrate that TRW/TRW-M could achieve similar objectives. In our future work, we will refine the design of TRW/TRW-M and perform a comprehensive benchmark against other DTN approaches.
From a cost perspective, there is a huge difference in providing 100 people with specific devices (iMotes or other) than just passing around a couple of tokens, to have the same results in terms of delivery ratio. This difference supports the lightweight characteristic of our approach. Finally, by definition, the increase of delay can be tolerated in a DTN.
Our main concern is an organic use of such TRW in a real opportunistic network. Let us assume one hundred devices sharing messages with a DTN routing protocol (such as BSW). No physical tokens are needed to implement such TRW. We can develop a logical version of the token which is just a grouping of messages in a nodes’ buffer. Therefore, passing the token is equivalent to copying a complete set of messages form one node to another. This grouping means we need to ensure that the whole token will be passed at each copy. If not, then alternative strategies may be to split the token or store remaining message for later encounters. As seen in Section IV-C, the token size stays bounded in time allowing such copies strategies. We will study these open issues in our future works.
VI. RELATED WORK
Most of the related work mixing mobile nodes and infras-tructure (hybrid ad-hoc network) study the capacity increase of the connectivity [12], [13]. However, these work do not present how to route messages in the network nor how to exploit the dynamics of the network. In the same context Shen et al. [14] present a heuristic to determine where to randomly place base stations to increase connectivity. Banerjee et al. [15] explore several scenarios introducing base stations, wireless mesh and pure mobile networks. Nevertheless, this work does not consider a dynamic infrastructure as the one proposed in this paper. Also in vehicular networks, Soares et al. [16] present a relay infrastructure for vehicular mobile networks. They show increases in delivery ratios thanks to the relay infrastructure. However in this work relay nodes are static in crossroads. Random walks are used to sample data in graphs in [6], [5], [7], but so far not as a transport method.
VII. CONCLUSION
We explored the use of temporal random walks on oppor-tunistic networks to serve as a communication infrastructure. We proposed to use contacts as a medium to pass a specific device gathering messages (the token), rather than a mean of message routing. The simple analogy is to copy messages in a USB key and pass it among contacts to deliver (eventually) data. We studied how this method can successfully deliver messages. As expected, the simplicity of this approach leads to increased delays. We verified our approach with both synthetic and real traces. We further noted how the connectivity of the network has a significant impact on the delivery: the more disconnected the network, the more resources a typical routing
algorithm will need. Our approach will keep a high delivery ratio independent of the density of contacts. As future work we will further study the properties of the temporal random walk and its implication as a communication medium. We will also prototype and evaluate a distributed version where the token is copied among real nodes.
ACKNOWLEDGMENTS
The authors would like to thank Paul Amer for his ideas to improve this work. This work is partially supported by CONICYT (Becas Chile PhD program). NICTA is funded by the Australian Government (Dept. of Communications) and the Australian Research Council (ICT Centre of Excellence Program).
REFERENCES
[1] L. Pelusi, A. Passarella, and M. Conti, “Opportunistic networking: data
forwarding in disconnected mobile ad hoc networks,” Communications Magazine, IEEE, vol. 44, no. 11, pp. 134–141, November 2006.
[2] M. Conti and S. Giordano, “Mobile ad hoc networking: milestones,
challenges, and new research directions,” Communications Magazine, IEEE, vol. 52, no. 1, pp. 85–96, January 2014.
[3] A. Chaintreau, P. Hui, J. Crowcroft, C. Diot, R. Gass, and J. Scott,
“Impact of human mobility on the design of opportunistic forwarding algorithms,” in INFOCOM, april 2006.
[4] J. Leguay, A. Lindgren, J. Scott, T. Friedman, and J. Crowcroft,
“Opportunistic content distribution in an urban setting,” in CHANTS. ACM, 2006.
[5] M. Starnini, A. Baronchelli, A. Barrat, and R. Pastor-Satorras, “Random
walks on temporal networks,” Phys. Rev. E, vol. 85, p. 056115, May 2012.
[6] B. Ribeiro and D. Towsley, “Estimating and sampling graphs with
multidimensional random walks,” in IMC. Melbourne, Australia: ACM, 2010.
[7] V. Ramiro, E. Lochin, P. Senac, and T. Rakotoarivelo, “On the limits
of dtn monitoring,” in WoWMoM 2013, Madrid, Espa˜na, June 2013.
[8] A. Ker¨anen, J. Ott, and T. K¨arkk¨ainen, “The ONE Simulator for DTN
Protocol Evaluation,” in SIMUTools ’09. New York, USA: ICST, 2009.
[9] T. Spyropoulos, K. Psounis, and C. S. Raghavendra, “Spray and wait: an
efficient routing scheme for intermittently connected mobile networks,”
in SIGCOMM 2005. New York, USA: ACM, 2005.
[10] J. Scott, R. Gass, J. Crowcroft, P. Hui, C. Diot, and A. Chaintreau,
“Crawdad data set cambridge/haggle (v. 2006-09-15),” 2006.
[11] P. U. Tournoux, J. Leguay, F. Benbadis, V. Conan, M. D. de Amorim,
and J. Whitbeck, “The accordion phenomenon: Analysis, characteriza-tion, and impact on dtn routing,” in Proc. IEEE INFOCOM, 2009.
[12] U. C. Kozat and L. Tassiulas, “Throughput capacity of random ad hoc
networks with infrastructure support,” in MobiCom ’03. New York,
USA: ACM, 2003, pp. 55–65.
[13] B. Liu, P. Thiran, and D. Towsley, “Capacity of a wireless ad hoc
network with infrastructure,” in MobiHoc ’07. New York, NY, USA:
ACM, 2007, pp. 239–246.
[14] C. Shen and D. Pesch, “A heuristic relay positioning algorithm for
heterogeneous wireless networks,” in Vehicular Technology Conference, 2009. VTC Spring 2009. IEEE 69th, April 2009, pp. 1–5.
[15] N. Banerjee, M. D. Corner, D. Towsley, and B. N. Levine, “Relays, base
stations, and meshes: Enhancing mobile networks with infrastructure,”
in MobiCom ’08. New York, USA: ACM, 2008.
[16] V. Soares, F. Farahmand, and J. Rodrigues, “Improving vehicular
delay-tolerant network performance with relay nodes,” in Next Generation Internet Networks, 2009. NGI ’09, July 2009, pp. 1–5.