Science Arts & Métiers (SAM)
is an open access repository that collects the work of Arts et Métiers Institute of Technology researchers and makes it freely available over the web where possible.
This is an author-deposited version published in: https://sam.ensam.eu Handle ID: .http://hdl.handle.net/10985/9214
To cite this version :
Philippe MANGIN, Laurent LANGLOIS, Régis BIGOT - Role of Surface Texture on Workpiece Angular Deformation in Cross Wedge Rolling - In: 10th International Conference on Technology of Plasticity, ICTP 2011, Germany, 2011 - Special Edition: 10th International Conference on
Role of Surface Texture on Workpiece Angular Deformation in Cross Wedge Rolling
P. Mangin*, L. Langlois, R. BigotLaboratoire Conception Fabrication Commande (LCFC), EA 4495,
Arts et Métiers ParisTech, 4 Rue Augustin Fresnel, 57078 METZ Cedex 3 - France * Corresponding author: E-mail address: [email protected]
Abstract
The cross wedge rolling process is commonly used for the manufacturing of shaft or for preforms, being used for preliminary operation of forming cycle. The presence of angular deformation produced during the rolling process is analyzed in this paper. This work shows some experimental results obtained on parts made of steel in semi-industrial condition. Visioplasticity technique is used to measure the angular displacement occurring in some sections with reference to the adjacent ones. Thus the test samples are prepared to include surface grooves filled up with quite similar steel grade. After rolling process, angular deformations are highlighted by observations and external deformation profile. Influence of surface texture of the forming area is experimentally demonstrated. Moreover, the numerical simulation with the software FORGE is used to verify the adequacy between the observed phenomena and forecasts which can be obtained today. Conclusions about the relative influence of friction factors on the internal stresses creation are finally presented to better identify potential occurrence of these phenomena. Strain diagrams are used to bring out the magnitude of angular variations depending on local plastic strain on parts. Possible consequences for process optimization are raised.
Keywords: Process optimization and product quality optimization, Cross Wedge Rolling, Visioplasticity
Introduction
The process of Cross Wedge Rolling (CWR) is an in-cremental forming technology which is increasingly stud-ied and industrially implemented due to its ability to re-duce waste of material (forging yield improved).
In most cases, this technology is used to form metallic parts at a high temperature. The preheated billet is intro-duced between two dies which are either rollers or plates onto which forming wedges are present. The relative mo-tion of the dies is setting the billet into rotamo-tion while the condition of adhesion at the interface part / tool is main-tained. The hard wedges of the tool are progressively penetrating in the part material which one is therefore flowing in transverse direction.
Internal Stress State in the part. The possible presence
of internal defects like cavities or cracks in the workpiece manufactured by CWR has many explanations without real consensus as mentioned by Piedrahita et al. (2005).The conjunction of several loading sources is lead-ing to have a multiaxial stress state in the central region of the workpiece. Weronski et al. (1992) pointed out the major role of tensile stresses which can cause necking of the parts. Fu et al. (1993), with an extended literature analysis, reported among other phenomenon, the occur-rence of alternating stresses, shear stresses, such as torsion between portions of different diameter.
Torsion stresses. Experimental results from Guzavichus
et al., cited by Fu et al. (1993) so as by Dong et al. (2000)a are stating that relative torsion exists as a consequence of differences in rotational velocities between flanges and steps on the workpiece. Torsion has been experimentally investigated by Danno et al. (1984) on plasticine and steel for stepped shafts. Fig. 1 shows the shear deformation occurring in cross section perpendicular to the axis of a
diameter reduction and illustrates the localisation of de-formation at part periphery.
Figure 1. Shear deformation profile in cross section
per-pendicular to the axis of rolled plasticine parts as per Danno et al. (1984).Two-roll machine, 50% diameter reduction, forming angle α = 15°, stretching angle β = 9.1°.
Role of interfacial Friction. In CWR, the role of
inter-facial friction is clearly identified to be necessary to gear the billet in rotation. Authors like Dong at al. (2000)b showed experimentally and also with computational con-firmation that friction coefficient should be above critical value in order to avoid slipping of the complete part. The need of adhesive forces in the direction perpendicular to the part axis is the reason why inclined flank of the form-ing wedges are generally serrated. Serrations ensure the torque transmission so as to keep the part rotating and simultaneously enable the material to flow in the direction parallel to the part axis.
Observations reported on industrial parts. Industrial
partner of one of the author of this paper, reported to have experienced issues during industrial development of shaft production. Major deformations of semi-finished shafts produced by CWR occurr during post machining due to release of internal stresses. Residual torsion stresses prin-cipally located at part border are suspected to be the origin
Aim of this paper. Taking reference of the above
state-ments, this paper aims to highlight the influence of die surface texture on the torsional deformation observed on cross rolled parts. Thus, experimental tests are performed to observe how surface serrations can impact the final torsional deformation of the parts. In parallel, numerical simulations are carried out to refine the sensitivity analysis to friction settings.
Experimental Case
Part and tool description. A part with double diameter
reduction is developed as per Fig. 2 to investigate the importance of angular deformation along the part axis. The preform is made of steel grade C17. Cylindrical billets with initial diameter at 27mm and length at 87mm are used to manufacture workpieces with central diameter reduction to 15mm (reduction ratio near to 44%).
Figure 2. Preform drawing used for experimental tests. φ1
= 50,2° φ2 = 16,7°
The dies have been designed to manufacture the pre-forms by using test bench with flat dies as per cross sec-tional view Fig.3.
Figure 3. Cross sectional view of the test bench at initial
position before start of rolling operation.
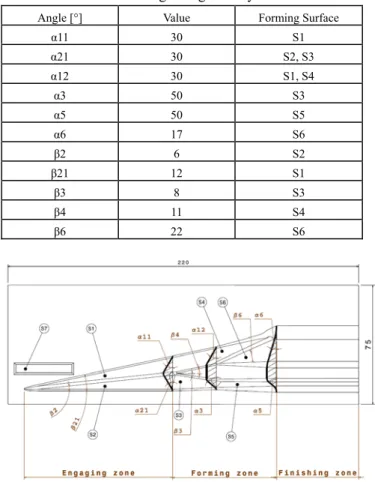
Details about die geometry are listed in Table 1 with reference to the Fig. 4.
Table 1. Details of forming dies geometry
Angle [°] Value Forming Surface
α11 30 S1 α21 30 S2, S3 α12 30 S1, S4 α3 50 S3 α5 50 S5 α6 17 S6 β2 6 S2 β21 12 S1 β3 8 S3 β4 11 S4 β6 22 S6
Figure 4. Geometry of one half of the experimental flat
dies (symmetry)
Experimental procedure. In order to observe the
de-formation of the initial billet an axial groove is first ma-chined and then weld cladded by GMAW process with a filler material with a chemical composition close to the one of the billet. The obtained weld bead is then strickled off cylindrical surface. The billets are formed at 1000 ° C with heating sequence in an electric furnace. The transfer of the billet and the positioning between flat dies are done manually. The rolling operation is performed on a CWR test bench mounted on a hydraulic press with a maximum capacity of 6000 kN. The transverse forming effort re-quired for the rolling is lower than the press capacity so that the speed shaping velocity remains constant through-out the operation. This velocity is set to 30mm/s. The rolled preforms are cooled down in the air and then sand blasted to remove the layer of scale. Finally, an etching Nital2% (2% HNO3 + ethanol) is used to reveal the de-formed weld bead. To increase the contrast on pictures, the surface of the bead is highlighted with permanent marker. The photographs are taken using as reference the position of the bead at the end of the baluster. The measurement of the relative angular orientation of the sections of the balus-ter is not the subject of this article.
Numerical Simulation with FORGE 2009
©Data setup for numerical analysis. To simulate
thermo-mechanical transformation occurring during the CWR process, a three-dimensional model is set up on Forge© software. A cylindrical billet is rolled between two flat dies as described in Table 2.
The virtual surfaces of forming dies are extracted from CAD format corresponding to the geometrical surfaces used for testing. These surfaces are meshed with triangular elements taking special care to affect the most realistic adherence conditions as this parameter is supposed to play a major role. It is common to use different friction factor on the forming area and on the sizing surface as, for ex-ample, presented by Dong et al. (2000)b. In this case, Norton-Hoff Viscoplastic friction law is chosen:
v
v
K
g p g f f f v)=− ⋅ ⋅Δ
−1⋅Δ
( α τ , (1) Where αf is the friction factor, pf the sensitivity to slippingvelocity, Kf the consistency of the billet material and Vg the
slipping velocity.
Table 2. Details of virtual dies and billet
Parameter Details
Billet Diameter 27 mm, length 43,5mm
Material as per rheological Database of Forge Soft-ware according to Hansel Spittel Law defined for C14 Billet Initial Temperature 1000°C
Tetrahedric elements, constant mesh size of 2mm Dies Forming surfaces imported as STL format
Triangular Elements, mesh size from 1,5 to 3,5 mm Friction zones defined as per view on figure 4, table 3 Die temperature set to 150°C
Exchange by conduction and convection in air Time
Discretization
Runge-Kutta 2
Remeshing Every 20 calculation step
Numerical design of experiment. In fact, frictions
coefficients have to represent more or less the presence of serrations existing on the forming areas. Therefore specific zones on the die surface are defined as per Fig. 5 and
Table 3. For each zone an interface set is defined to assign
different friction factors when the sensitivity to slipping velocity is considered to be constant and equal to 0,15.
Table 3. Details of configurations and friction factor
Value of friction factor per zone Configuration
Zone 1 Zone 2, 3 and 4 Zone 5
A 0,6 0,7 0,3 B 0,65 0,7 0,3 C 0,7 0,7 0,3 D 0,8 0,7 0,3
Figure 5. Overview of the specific zones with different
friction factor (as per Table 3).
Experimental Results
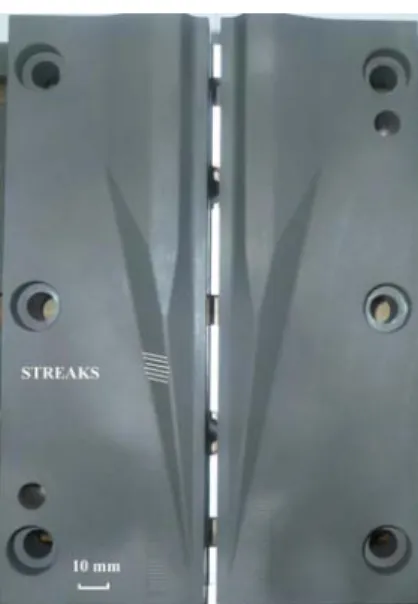
Role of serrations. The dies were primarily
manufac-tured only with serrations on the engaging zone as visible on Fig. 6. The sliding of each part during the rolling proc-ess is observed systematically upon entry into the forming area. As soon as streaks are added onto forming surface (on area S3, S4, S5 and S6 as per Fig. 4) the permanent and complete rolling of the workpiece is observed. This observation confirms the need to have serrated surfaces to increase adhesion so as to keep rotation of the part.
Figure 6. Flat dies used for the experimental tests Observations on Steel preforms. Surface defects like
shrinkage or folds are identified on rolled parts. Repeat-ability of shrinkage and of defect location is not demon-strated. Geometrical dimensions like diameters and length are quite similar from one part to another although some slipping sometime shortly appears. Rolled parts are
corre-profiles which are not repeated on each of the ten samples. Irregular deformation can be observed like for example on
Fig. 7b on the left side.
(a)
(b)
Figure 7. Overview of deformation profiles of the original
straight generatrix (highlighted by permanent marker).
Numerical Results
Geometrical validation. Parts obtained by numerical
simulation present overall dimensions which are in good accordance with drawing and real preform. The maximal length difference is less than 1mm.
Analysis of deformations. The radius reduction ratio is
calculated for each local radius Ri as follows: 0
0
)
/
(
R
R
R
R
=
−
iΔ
, (2)And the angular deformation θt is defined as per Fig. 8.
Two rows of 21 numerical sensors are defined opposite to each other on the meshing of the billet surface. The data collected for each of the both rows enable to computerize geometrical parameters like the local centre of rotation and consequently to display radius reduction ratio on Fig. 9 and angular deformation on Fig. 10 all along the distance on semi-axis of the preforms for each of the four configu-rations with varying friction factor on zone1.
Figure 8. Definition of angular deformation and radius.
Figure 9. Overview of radius reduction ratio versus
dis-tance on semi-axis of preform
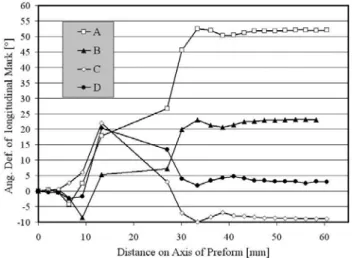
Figure 10. Overview of angular deformation vs distance
on semi-axis of preform.
Fibre structure. The numerical model used on Forge
software allows to display a marking grid attached to the part which deformation give a visualisation of internal fibre structure shown on Fig. 11.
Figure 11. Marking grid for each configuration (A, B, C,
Discussion
Observations on Steel preforms. The morphology of
the deformation profiles varies from one part to another as clear in Fig. 7. Moreover asymmetry of the profiles deformation is observed on both sides of each piece. These dissimilar marks point out the sliding instabilities occurring while rolling is in progress. The tests show that these instabilities are caused by more shallow surface streaks. If the streak depth is too low, the adhesion is insufficient. These observations highlight the role of regular and marked texture on forming areas along the complete stroke to keep the parts permanently rolling. Additionally, the need for a perfect symmetry between the two halves of dies is demonstrated. In the case where the textures are too different, the imposition of a local deformation does not operate identically with the same escalation on both sides of the preform.
Numerical Parts. External dimensions of numerical
parts are closed to real parts. This geometrical validation is reinforced by the results obtained for the radius reduction ration. As per results in Fig. 9, values of 45% corresponding well with experimental results, are identical for configuration B, C and D. No clear explanation can be raised for the difference with configuration A (40%).
Fibre Structure. Fig. 10 illustrates the angular
deformation between central region and part end, also visible on Fig. 11. Torsional angle can reach up to 50° for the configuration A. The most realistic configuration with reference to observations made on real parts is the configuration C, namely friction factor of 0.7 is the most suitable. This configuration has the marking grid with similar profiles to those observed on real parts. Further-more, friction factor of 0.7 seems to be a critical value under which angular deformation is increased too much. Another simulation configuration with a homogeneous friction factor of 0.7 for every zone has been tested. Although results of this reference configuration are not presented in details, the fiber structure and corresponding angular deformation are quiet similar to configuration B. Torsional angle between both ends of marking grid is about 20°.
Friction anisotropy. As it is discussed previously in the
introduction, serrations on forming surface imply a spe-cific texture. The streaks orientation (Fig. 6) is definitely promoting material flow in the part axis direction while preventing it in the direction perpendicular to part axis. This anisotropy of adherence is not considered in our model as the equation (1) does not take into account any orientation of the material flow at contact surface tool/workpiece. A criterion on the magnitude of contact velocity could be a solution to refine the numerical model. This approach is developed neither by the author nor in the published literature to our knowledge.
Torsional deformation. As described in the
introduc-tion and confirmed by our experimental tests, shear stresses and torsional deformations are observed on parts. Taking into account on one hand that tangential velocity
tool is determining to have slipping or adhesion of the part surface, it is necessary to control the surface quality of CWR tool in order to restrict the magnitude of torsion. Moreover it is necessary to optimize forming surfaces to avoid irregular deformation history along the stroke of workpieces. The method of using weld bead on billet is allowing to check the symmetry of deformation for a given tool and is a mean to tune finely industrial tools.
Process velocity. In this paper, experimental tests so as
corresponding numerical analysis are performed at a proc-ess velocity of 30mm/s. This value is relatively low with comparison to industrial applications which can reach nominal velocities of 500 to 600 mm/s. At this magnitude, the effects of velocity differences and possible instabilities are more critical for the control of part rotation during rolling.
Conclusion
The difference of tangential velocity which is needed to ensure the condition of rolling without slipping on all contact tool / workpiece, is consequently causing the tor-sion moment and stresses. This leads to the sliding contact tool / workpiece and / or the torsional deformation of the workpiece. The surface texture is determining locally the mechanism generated at the interface to different areas of the tool and workpiece. This can be clearly demonstrated by simulation and also by experimental tests. Mastering the tribological conditions at the interface tool / workpiece to different locations of the tool is a real difficulty of the process and may be responsible for die development cam-paigns before putting into production .The tolerance of the process to tribological conditions, demonstrated numeri-cally and experimentally in this article can be a source of lack of robustness of the method when it is put into pro-duction but also when considering the tool wear during its use in production. The same part shape can be obtained at the final stage although deformation paths and probably microstructural state and various stress-related parameters can vary due to changes in tribological conditions.
Acknowledgement
The authors would like to thank the German Fraunhofer IWU from Chemnitz for technical cooperation so as French Forge Commission of CETIM and Lorraine Re-gion for financial support. This work takes place in con-vention between CETIM and ARTS ET METIERS PA-RISTECH.
References
Danno, A., Tanaka, T., 1984. Hot forming of stepped steel shafts by wedge rolling with three rolls. In: Journal of Mechanical Working Technology, p. 21-35
Dong, Y., Tagavi, K.A., Lovell, M.R., 2000a Analysis of interfacial slip in cross-wedge rolling: A numerical and phenomenological investigation. J Mater Process
Tech-Dong, Y., Tagavi, K.A., Lovell, M.R., Deng, Z., 2000b Analysis of stress in cross wedge rolling with applica-tion to failure. Internaapplica-tional Journal of Mechanical Science, 42 (7) p.1233-1253
Fu, X.P., Dean, T.A., 1993. Past developments, current applications and trends in the cross wedge rolling pro-cess. International Journal of Machine Tools and Ma-nufacture, p. 367-400
Guzavichus, L. V., Dubeni, A. S., Krasnevskij, M., et al. Cylindrical pattern to define plastic features of material in rolling process. Soviet Patent A. S. 538272 (1976). Pedrahita, F., Garcia-Aranda, L., Chastel Y., 2005. Three
dimensional numerical simulation of cross-wedge roll-ing of bars. Advanced technology of plasticity Pro-ceedings of 8th ICTP –Verona, Italy
Rappaz, M., Bellet, M., Deville, M., 1998. Modélisation numérique en science et génie des matériaux. Traité des Matériaux Vol. 10. Presses Polytechniques et Uni-versitaires romandes, p. 317-323 (in French)
Weronski, W., Pater, Z., 1992. Selection of geometric parameters of transverse wedge rolling tools. Journal of Materials Processing Technology, p. 273-280
![[PDF] Cours apprentissage du langage JAVA méthodes et application - Cours Java](data:image/gif;base64,R0lGODlhAQABAIAAAP///wAAACH5BAEAAAAALAAAAAABAAEAAAICRAEAOw==)