POLARIZATION MEASUREMENTS OF HOT DUST STARS
AND THE LOCAL INTERSTELLAR MEDIUM
J. P. Marshall1,2, D. V. Cotton1,2, K. Bott1,2, S. Ertel3,4, G. M. Kennedy5, M. C. Wyatt5, C. del Burgo6, O. Absil7, J. Bailey1,2, and L. Kedziora-Chudczer1,2
1
School of Physics, UNSW Australia, High Street, Kensington, NSW 2052, Australia 2
Australian Centre for Astrobiology, UNSW Australia, High Street, Kensington, NSW 2052, Australia 3
Steward Observatory, Department of Astronomy, University of Arizona, 933 N. Cherry Avenue, Tucson, AZ 85721, USA 4
European Southern Observatory, Alonso de Cordova 3107, Vitacura, Casilla 19001 Santiago, Chile 5
Institute of Astronomy, University of Cambridge, Madingley Road, Cambridge, CB3 0HA, UK 6
Instituto Nacional de Astrofísica, Óptica y Electrónica, Luis Enrique Erro 1, Sta. Ma. Tonantzintla, Puebla, Mexico 7
Institut d’Astrophysique et de Géophysique, University of Liège, 19c allée du Six Août, B-4000 Liège, Belgium Received 2016 March 14; revised 2016 April 11; accepted 2016 April 14; published 2016 July 11
ABSTRACT
Debris discs are typically revealed through the presence of excess emission at infrared wavelengths. Most discs exhibit excess at mid- and far-infrared wavelengths, analogous to the solar system’s Asteroid and Edgeworth-Kuiper belts. Recently, stars with strong (∼1%) excess at near-infrared wavelengths were identified through interferometric measurements. Using the HIgh Precision Polarimetric Instrument, we examined a sub-sample of these hot dust stars(and appropriate controls) at parts-per-million sensitivity in SDSS g′ (green) and r′ (red) filters for evidence of scattered light. No detection of strongly polarized emission from the hot dust stars is seen. We, therefore, rule out scattered light from a normal debris disk as the origin of this emission. A wavelength-dependent contribution from multiple dust components for hot dust stars is inferred from the dispersion (the difference in polarization angle in red and green) of southern stars. Contributions of 17 ppm (green) and 30 ppm (red) are calculated, with strict 3-σ upper limits of 76 and 68 ppm, respectively. This suggests weak hot dust excesses consistent with thermal emission, although we cannot rule out contrived scenarios, e.g., dust in a spherical shell or face-on discs. We also report on the nature of the local interstellar medium(ISM), obtained as a byproduct of the control measurements. Highlights include thefirst measurements of the polarimetric color of the local ISM and the discovery of a southern sky region with a polarization per distance thrice the previous maximum. The data suggest thatλmax, the wavelength of maximum polarization, is bluer than typical.
Key words: circumstellar matter – dust, extinction – planetary systems – polarization 1. INTRODUCTION
The presence of remnant material from planet formation processes is most commonly revealed around mature, main sequence stars by detection of excess emission, above the stellar photospheric emission, at infrared wavelengths (Wyatt 2008; Matthews et al. 2014). The origin of the observed excess is
micron- to millimeter-sized dust grains produced in collisions between larger, unseen bodies (Backman & Paresce 1993; Krivov 2010). Hence these objects are called debris discs.
Typically, observed dust emission peaks at either mid- or far-infrared wavelengths with temperatures, derived from blackbody fits to the excesses, of ∼200 K or 80 K (Morales et al. 2011);
such discs are analogous to the Asteroid or Edgeworth-Kuiper belts, respectively. Hundreds of stars have been identified as debris disk host stars, many of which require multiple debris components echoing the structure of our solar system (Chen et al.2009; Su et al.2013; Kennedy & Wyatt2014). For cool
debris discs, i.e., Edgeworth-Kuiper Belt analogs, that are more easily detected in contrast to their host stars, an incidence of ∼20%–30% for AFGK-type stars has been measured (Eiroa et al.2013; Thureau et al. 2014), albeit with limitations due to
instrument sensitivity and survey strategy.
Interferometric measurements of Vega, the archetype of debris disk systems(Aumann et al.1984), measured a visibility
deficit in the near-infrared H and K wavebands (Absil et al.
2006; Defrère et al.2011). This deficit was interpreted as being
the result of emission originating within the field of view
(∼200 mas), but at spatial scales of several stellar radii, i.e., more extended than the compact stellar emission. The favored explanation for this emission was the presence of hot dust, with temperatures in excess of 1000 K, around the host star. Subsequent studies of other systems spanning a broad range of spectral types found similar excesses, some curiously around stars without any other evidence of excess emission(di Folco et al.2007; Absil et al.2008,2009; Akeson et al.2009; Defrère et al. 2012). Surveys combining measurements in H and K
bands found an incidence of hot dust comparable to that of cooler debris discs around main sequence stars, but uncorre-lated with the presence of cooler debris(Absil et al.2013; Ertel et al.2014).
The interpretation of the excess as being caused by thermal emission from dust is problematic. Any such grains would be close to the sublimation temperature, at small separations of ∼0.2 au. The presence of grains with properties commonly ascribed to those in cooler belts is also problematic due to the short lifetime against collisional destruction, or removal from the system by radiation pressure (Burns et al. 1979; Krivov 2010). Dust grains with temperatures ascribed to hot
dust would also emit strongly in the mid-infrared, which is not seen(Mennesson et al.2014), nor supported by modeling (van
Lieshout et al.2014). Delivery of sufficient dusty material to
the star’s vicinity from exterior debris belts, e.g., by high orbital eccentricity comets, is likewise difficult to achieve from a dynamical perspective(Bonsor et al.2012,2013). However,
some scenarios have been proposed that account for theflaws © 2016. The American Astronomical Society. All rights reserved.
noted above through e.g., the adoption of more realistic sublimation physics for dust grains (Lebreton et al. 2013), or
the trapping of small, nano-scale dust grains in the stellar magneticfield (Su et al.2013; Rieke et al.2015). Regardless of
its origin, at least in the cases of HD 20794 and HD 38858, the dust responsible must be located close to the host star (Kennedy et al. 2015a). In the interest of completeness we
note that the hot dust phenomenon as a byproduct of the host star’s properties has been considered, e.g., winds (Absil et al.
2008) or oblateness (Akeson et al. 2009); such mechanisms
have generally been ruled out as the cause of this phenomenon. However, it is clear that alternative mechanisms to account for the presence of these excesses should be explored. Here we investigate the possibility that the near-infrared excesses are due to scattered light, not thermal emission, from dust, while at the same time setting further observational constraints on the grains if the excesses are the products of thermal emission.
A further motivation to examine a scattered light origin of the observed excess is the direct imaging of habitable zone terrestrial exoplanets(Agol2007; Beckwith2008). In the Solar
system, debris dust migrating from the Asteroid Belt and deposited by comets is pervasive (e.g., Dermott et al. 1984; Nesvorny et al. 2010). Sunlight scattered by these dust grains
produces the Zodiacal light, the faint (Ldust/Lå∼ 10−7) inner component of the Solar system’s debris disk (Backman & Paresce 1993, p. 1253). Around other stars, the presence of a strong scattered light background from dust at separations of a few au from the host star constitutes a bright background from which the light from an exoplanet must be disentangled (Roberge et al. 2012; Stark et al.2015). Ground-based efforts
to characterize this emission for Sun-like stars with no infrared excess determined that most (95%) of these exo-zodis are less than 60 times brighter than that of the Solar system in the mid-infrared (Mennesson et al. 2014). The Large Binocular
Telescope Interferometer will be sensitive in the mid-infrared to exo-zodis only a few times brighter than the Solar system around nearby Sun-like stars, probing direct analogs of the Solar system (Kennedy et al.2015b; Weinberger et al. 2015).
Deriving constraints on the optical scattered light brightness from these limits is non-trivial. This is critical, however, since
direct imaging searches for exo-Earths are supposed to be carried out at such wavelengths.
The detected near-infrared excesses are potentially proble-matic for the direct detection of exo-Earths, since these might be explained by a strong scattered-light emission (Ertel et al. 2014). To test this hypothesis we have measured the
degree of polarization of six hot dust stars without any notable excess at mid- or far-infrared wavelengths using the HIgh Precision Polarimetric Instrument, a parts-per-million (ppm, ×10−6) sensitivity aperture polarimeter (HIPPI; Bailey et al. 2015). A 1% scattered light excess in the near-infrared from
micron-sized dust grains should be detectable in polarization at visible wavelengths, assuming a conversion of between 5% and 50% for the magnitude of polarization from scattered light brightness (Schneider et al. 2014, J. P. Marshall 2016, in preparation). As a lower limit, a 1% conversion between near-infrared and optical scattered light brightness would produce a signal of 100 ppm. This is well within the measurement capabilities of HIPPI; its 1-σ sensitivity of 10 ppm for a one hour integration on a sixth magnitude star would obtain a detection of the hot dust at the 10-σ level.
In Section2 we present our polarimetric observations. We present the results of our study in Section 3, followed by a discussion of these results in relation to the current under-standing of hot dust in Section 4. Finally, in Section 5, we summarize ourfindings and present our conclusions.
2. OBSERVATIONS
We observed six hot dust stars and seven control stars in the SDSS g′ and r′ filter bands with the HIPPI (Bailey et al.2015)
on the 3.9 m Anglo-Australian Telescope. The hot dust stars examined here have no evidence of excess emission at mid- or far-infrared wavelengths, with limits on the fractional excess of dust(Ldust/Lå) of 10−5–10−6. The scattered light emission from any cold dust around these stars must therefore be negligible due to the limits from the fractional luminosity. The presence of any polarization from a star can thus be solely attributed to a combination of the interstellar medium(ISM) and the presence of circumstellar hot dust. We cannot rule out the presence of hot dust for any of the control stars, but the incidence of this Table 1
Stellar Properties, Fractional Near-infrared Excess(in per cent), and Summary of HIPPI Observations
Name Excess/ R.A. Decl. V Spectral d g′ r′
Control (hh mm ss) (dd mm ss) (mag) Type (pc) Date Time(s) Date Time(s)
HD 2262 0.67± 0.18 00 26 12.2 −43 40 47 3.94 A5 IV 23.8 18/10/15 1280 31/10/15 1280 HD 739 Control 00 11 44.0 −35 07 59 5.20 F5 V 21.3 18/10/15 1280 2x31/10/15 1600 HD 28355 0.88± 0.09 04 28 50.2 13 02 51 5.01 A7 V 48.9 18/10/15 1280 31/10, 2/11/15 1920 HD 28556 Control 04 30 37.4 13 43 28 5.40 F0 V 45.0 2/11/15 1280 2/11/15 1280 HD 187642 3.07± 0.24 19 50 47.0 08 52 06 0.76 A8 V 5.1 18/10/15 640 1/11/15 640 HD 187691 Control 19 51 01.6 10 24 57 5.10 F8 V 19.2 29/10/15 960 2/11/15 960 HD 7788 1.43± 0.17 01 15 46.2 −68 52 33 4.25 F6 V 21.0 19/10/15 800 29, 31/10/15 1600 HD 4308 Control 00 44 39.3 −65 38 58 6.60 G8 V 22.0 29/10/15 1280 31/10, 2/11/15 2240 HD 7693 Control 01 15 01.0 −68 49 08 7.24 K2 V 21.7 2/11/15 1280 2/11/15 1280 HD 14412 0.96± 0.21 02 18 58.5 −25 56 44 6.34 G8 V 12.7 20/10/15 960 31/10, 2/11/15 2240 HD 12311 Control 01 58 46.2 −61 34 12 2.84 F0 IV 22.0 2/9/14 640 31/10/15 640 HD 210302 0.83± 0.25 22 10 08.8 −32 32 54 4.92 F6 V 18.3 29/10/15 960 2/11/15 960 HD 176687 Control 19 02 36.7 −29 52 48 2.61 A2 V 27.0 1/9/14 640 2/11/15 640
phenomenon is ∼10% and from binomial probability we therefore expect, at most, one of the seven control stars (37% probability) is actually a hot dust star.
A summary of the observations, including the new observations obtained for this program in two observing runs during 2015 (14/10–20/10 and 29/10–3/11), is given in Table 1. The integration time per target for each Stokes parameter, U and Q, is half the total time listed in the table. The two observations made in 2014 September were reported previously in Cotton et al. (2016), but the details are included
here for completeness.
HIPPI is a high precision polarimeter, with a reported sensitivity in fractional polarization of ∼4.3 ppm on stars of low polarization and a precision of better than 0.01% on highly polarized stars(Bailey et al.2015). It achieves this by the use
of Ferroelectric Liquid Crystal modulators operating at a frequency of 500 Hz to eliminate the effects of variability in the atmosphere. Second stage chopping, to reduce systematic effects, is accomplished by rotating the entire back half of the instrument after the filter wheel, with a typical frequency of once per 20 s.
Observations in the g′ filter used the blue sensitive Hamamatsu H10720-210 Ultra bialkali photocathode photo-multiplier tube(PMT), as per previously reported observations with HIPPI (Bailey et al.2015; Cotton et al. 2016).
Observa-tions made with the r′ filter used the red sensitive Hamamatsu H10720-20 infrared extended multialkali photocathode to improve the efficiency of measurements made in r′. Using the band-pass model described in Bailey et al.(2015) we have
determined the effective wavelength and efficiency for various spectral types without reddening for this filter-PMT combina-tion, and this is presented in Table 2. We also reproduce the same data for the g′ filter and Ultra-bialkali PMT combination for completeness.
A sky measurement, lasting 40 s, was acquired at each of the four telescope position angles an object was observed at, and subtracted from the measurement. The sole exception was HD 12311 in the g′ filter for which, being a particularly bright object observed in good conditions, a dark measurement was sufficient for calibration purposes. These subtractions were carried out as the first part of the data reduction routine, that determines polarization via a Mueller Matrix method. Full details are provided by Bailey et al. (2015).
Angular calibration was carried out with reference to a set of high polarization standards with known polarization angles: HD 23512, HD 187929, HD 154445, and HD 80558. The standards have angles known to a precision of ∼1°—which dominates the uncertainty of our measurements. During the observations, zero point calibration (telescope polarization;
hereafter abbreviated TP) was carried out by reference to the average of a set of observed stars with measured low polarizations; this is shown in Table 3. Note that the g′ HIP 2021 observation of the 29 October run and the g′ Sirius observations of 2 November run were not used as part of the calibration for g′ observations carried out during the 14–20 October run. The reason being that the telescope polarization can drift over time, and so, where sufficient measurements are available, contemporaneous calibration observations are pre-ferred. Owing to challenging conditions, only two additional calibration observations were possible for g′ in the later run, and so all the measurements from both runs were used. The difference in the calibration is within the reported error, and we consider it of no consequence.
We set out to observe a set of six stars for the ISM control sample, also with no known excess emission, with spectral types unlikely to be intrinsically polarized, that were of similar brightness to the target stars and reasonably closely placed on the sky(within a few degrees). All of the control stars would therefore have comparable precision in their polarimetry measurements to the hot dust stars. No effort was made to match the spectral type of the target-control pairs, which leads to slight mismatches between the effective wavelength of measurement for polarization between hot dust and control stars. These differences are all small (<10 nm), and can therefore be neglected. The relative distances of the target-control pairs were not able to be precisely matched. To compensate for this, we assumed that the polarization induced by the ISM was linearly related to distance and scaled the polarizations measured for control stars by the ratio of the target and control distances for our analysis.
In one case, where the control was particularly polarime-trically red and the corresponding target star recorded a particularly high degree of polarization for its distance from the Sun, we observed a second nearby star to confirm the polarization was interstellar in origin—later we treat the distance-scaled average of these two stars as a single control. In two further cases, owing to particularly challenging observing conditions, we had to substitute brighter stars for controls. These two stars are not as close to the corresponding target as the rest of the set. However, in this instance they are both the nearest stars that had been observed previously with HIPPI and shown to be polarized only by the ISM, and they Table 2
Effective Wavelength and Modulation Efficiency for Different Spectral Types According to Our Band-pass Model
Spectral g′ r′
Type λeff(nm) Mod. Eff. λeff(nm) Mod. Eff.
B0 459.1 0.877 616.8 0.814 A0 462.2 0.886 618.3 0.811 F0 466.2 0.896 620.8 0.807 G0 470.7 0.906 623.0 0.802 K0 474.4 0.916 624.5 0.800 M0 477.5 0.920 629.3 0.791 M5 477.3 0.917 630.4 0.789 Table 3
Telescope Polarization(TP) Measurements for the October and November 2015 Runs in g′ and r′ Filters
Star Date p(ppm) θ (°) HIP 2021 Oct 14 58.1± 4.1 90.5± 4.0 Oct 19 52.5± 3.9 91.4± 4.3 Oct 29 56.0± 4.1 88.2± 4.2 Sirius Oct 16 52.8± 0.7 88.2± 0.8 Oct 19 49.8± 1.3 90.7± 1.8 Nov 2 47.3± 1.1 86.5± 0.6 Adopted TP g′ 55.9± 1.1 89.3± 0.6 HIP 2021 Oct 31 41.0± 5.2 93.0± 3.6 Sirius Oct 29 31.8± 6.2 96.3± 6.4 Nov 2 31.8± 1.5 93.6± 1.3 Adopted TP r′ 34.8± 2.5 94.2± 2.2
both had a similar polarization per distance to the targets (Cotton et al. 2016).
3. METHODOLOGY AND RESULTS 3.1. Methodology
For the analysis of the data, we split the stars according to their nature(i.e., target or control), and further subdivide them according to the target star’s spectral type (i.e., A stars and F/G stars). The grouping of stars into A and F/G sub-groups is done to facilitate a comparison of any measurable polarization properties as a function of spectral type, where dust grain size may become a factor. To compare these groupings we calculate the ratio of their polarization in the two filter bands and the consistency of the orientation angles in each filter band. We have examined the stars in aggregate rather than individually because the signal-to-noise of polarization measurements is generally low and the clumpiness of the ISM makes vector subtraction of polarization contributions unreliable as a mechanism to assess the relative contribution of components toward individual stars. In Table 4 we summarize the individual measurements for the stars observed in this work.
Our method for determining the error in normalized Stokes parameters, q(Q/I) and u (U/I), with HIPPI is given in detail
in Bailey et al.(2015). The error in p, σp, is simply the mean of σq and σu. These errors decrease as n for the mean of n individual measurements. Where we have made multiple observations of an object, the means and errors of q and u have been calculated by the weighting of the errors in the individual observations. In particular, this applies to the raw data presented in Table4.
While the error in the magnitude of polarization is straightforward to calculate, the error in polarization angle, σθ, requires more care. If the signal to noise ratio, p/σp,is large then the probability distribution function forθ is Gaussian, and 1σ errors (in degrees) are given by Serkowski (1962):
( )
sq=28.65sp p, 1
However, when p/σp< 4 the distribution of θ becomes kurtose with appreciable wings. In such cases, Equation(1) is no longer
strictly accurate—though it is often still used when precision is not critical (the difference is generally much less than 5°). Throughout this work we have taken extra care and made use of the work of Naghizadeh-Khouei & Clarke(1993) who give
preciselyσθ as a function of p/σpin their Figure 2(a). In contrast to the normalized Stokes parameters q and u, the magnitude of polarization, p, is positive definite; this needs to be considered when taking the mean of many values of ¯p, Table 4
Raw and Distance Modulated Polarimetric Measurements of Hot Dust and Control Stars
Filter HD T/C λeff q u p d p/d θ (nm) (ppm) (ppm) (ppm) (pc) (ppm pc−1) (°) g′ 2262 Target 464.2 4.7± 5.7 37.4± 5.7 37.7± 5.7 23.8 1.58 41.4± 4.3 739 Control 468.5 −31.0 ± 12.6 24.3± 12.4 39.3± 12.5 21.3 1.84 71.0± 9.6 r′ 2262 Target 619.6 −7.3 ± 8.4 17.5± 8.8 18.9± 8.6 23.8 0.79 56.4± 15.4 739 Control 621.9 −5.3 ± 11.1 24.3± 11.3 24.9± 11.2 21.3 1.17 51.1± 15.3 g′ 28355 Target 465.0 0.0± 10.7 −2.1 ± 12.1 2.1± 11.4 48.9 0.04 134.6± 48.2 28556 Control 466.2 49.3± 27.0 12.4± 27.2 50.8± 27.1 45.0 1.13 7.1± 18.8 r′ 28355 Target 620.1 −0.2 ± 10.3 13.5± 10.4 13.5± 10.4 48.9 0.28 45.5± 26.7 28556 Control 620.8 −3.9 ± 13.9 −18.3 ± 13.9 18.7± 13.9 45.0 0.42 129.0± 26.1 g′ 187642 Target 465.4 13.3± 2.7 3.4± 2.7 13.7± 2.7 5.1 2.69 7.2± 5.8 187691 Control 469.8 −9.9 ± 10.7 −16.1 ± 10.6 18.9± 10.6 19.2 0.98 119.3± 19.9 r′ 187642 Target 620.3 2.7± 7.8 −2.9 ± 7.8 4.0± 7.8 5.1 0.78 156.5± 41.6 187691 Control 622.6 −10.4 ± 17.4 20.1± 17.6 22.6± 17.5 19.2 1.18 58.7± 27.0 g′ 7788 Target 468.9 −101.5 ± 9.4 −39.1 ± 9.6 108.8± 9.5 21.0 5.18 100.5± 2.5 4308 Control 473.7 −12.0 ± 16.7 −21.4 ± 16.3 24.6± 16.5 22.0 1.12 120.4± 23.9 7693 Control 475.0 −158.2 ± 23.9 −38.3 ± 23.6 162.8± 23.7 21.7 7.50 96.8± 4.5 r′ 7788 Target 622.1 −113.0 ± 11.6 −31.7 ± 11.8 117.4± 11.7 21.0 5.59 97.8± 2.9 4308 Control 624.2 −44.2 ± 16.4 2.9± 16.7 44.3± 16.5 22.0 2.01 88.1± 11.8 7693 Control 625.5 −147.0 ± 25.2 −64.8 ± 26.5 160.7± 25.9 21.7 7.41 101.9± 4.7 g′ 14412 Target 473.7 −14.2 ± 13.4 −14.4 ± 12.6 20.2± 13.0 12.7 1.59 112.7± 22.9 12311 Control 466.2 31.7± 5.8 −28.1 ± 6.2 42.4± 6.0 22.0 1.93 159.2± 4.1 r′ 14412 Target 624.2 −37.4 ± 17.1 27.2± 17.1 46.2± 17.1 12.7 3.64 72.0± 11.7 12311 Control 620.8 18.7± 16.6 −27.6 ± 17.8 33.4± 17.2 22.0 1.52 152.0± 18.1 g′ 210302 Target 468.9 −15.5 ± 12.6 −13.7 ± 13.1 20.7± 12.9 18.3 1.13 110.8± 22.2 176687 Control 463.2 0.9± 4.6 −28.2 ± 4.7 28.2± 4.6 27.0 1.04 135.9± 4.6 r′ 210302 Target 622.1 8.7± 12.9 6.4± 14.3 10.8± 13.6 18.3 0.59 18.1± 36.7 176687 Control 618.9 −3.9 ± 8.2 −10.0 ± 8.3 10.7± 8.2 27.0 0.40 124.4± 26.8
Note. HD 187642 was also measured by PlanetPol (Bailey et al.2010): q = −7.3 ± 1.3, u = −1.2 ± 1.2. For stars with two r′ measurements averaged above we give
the measurements of q and u for the individual observations as follows: HD 739: q= −11.5 ± 16.7, u = 0.0 ± 16.9; q = −0.4 ± 14.9, u = 44.0 ± 15.2. HD 28355: q= −26.7 ± 18.2, u = 27.9 ± 17.9; q = 12.4 ± 12.6, u = 6.1 ± 12.7. HD 7788: q = −104.3 ± 16.9, u = −26.6 ± 16.8; q = 120.8 ± 16.0, u = −36.6 ± 16.5. HD 4308: q = −47.5 ± 23.7, u = −14.4 ± 25.0; q = −41.2 ± 22.6, u = 16.8 ± 22.4. HD 14412: q = −55.2 ± 27.0, u = 44.7 ± 30.9; q = −25.3 ± 22.2, u= 19.5 ± 20.5.
especially if ¯p/ ¯sp is low, as in Table 5. The standard method
for debiasing such data, to best estimate the true value of p, is that of Serkowski(1962):
ˆ ~( ¯ -s¯ ) ( )
p p2 p2 1 2, 2
where ˆp is the debiased polarization, and ¯sp is calculated as
root mean square error. Wardle & Kronenberg (1974) derive
this same equation in a different way, and recommend its use for ¯p/ ¯sp > 0.5. We apply this debiasing when we consider
trends in p in an ensemble of data.
The observables we have drawn for our sample are the magnitude and angle of polarization. In Table 5we aggregate the individual measurements and compare the hot dust stars to the controls both in total and by spectral type(distinguishing A and F/G type stars). To reduce the effects of distance variation and better compare the controls to the targets, we scale the polarization measurements of each of the controls linearly by the target:control distance ratio (implicitly assuming that the ISM polarization magnitude varies linearly in distance).
To analyze the influence of hot dust on the observed polarization we:
1. compare the magnitude of polarization for the hot dust and control stars in each of the g′ (green) and r′ (red) bands,
2. calculate the ratio of polarization magnitudes pgreen:pred,
3. calculate the dispersion(f)—the difference in orientation angle between green and red (θgreen and θred—and compare the hot dust and control star groups.
3.2. Results
3.2.1. Non-detection of Strongly Polarized Light
Our primaryfinding is the non-detection of strong polarized light from the hot dust stars. The magnitude of polarization for the hot dust stars is found to be consistent with that of the distance-scaled control stars. To gain an idea of how large the polarizing effect of hot dust is likely to be if present, we can make a simple calculation based on the statistics of vector addition. If we take the average distance-scaled polarization of the controls to be representative of the interstellar polarization,
¯
pi, and the hot dust targets to be p= pi+ på, where påis the intrinsic polarization of the system, then for a large enough sample the median intrinsic polarization is given by:
ˆ = ¯ - ¯ ( )
p p2 p . 3
i2
Using the sample of southern hot dust stars and controls(since the dispersion measurements lead us to believe the ISM in the south is less patchy—see below), this equation produces 17 ± 20 ppm in green, and 30± 13 ppm in red.8From this we obtain 3-σ upper limits of 76 ppm in green and 68 ppm in red. These are statistical limits, but if the hot dust contribution had been at the 100 ppm level for any star it would have dominated the ISM component. We therefore infer that the contribution from the hot dust and ISM are of approximately the same magnitude. If the hot dust contribution had been the dominant component its presence would have been much easier to detect than the derived upper limits suggest.
If the near-infrared excess is assumed to be scattered light, and this scattering is wavelength independent, then the expected polarization is simply the fractional excess, FIR/Få, multiplied by the polarization fraction of light scattered by the dust, fpol:
( ) ( )
=
p FIR F fpol. 4
The fractional excesses of the hot dust stars lie at the∼1% level (Absil et al.2013; Ertel et al.2014). For consistency with the
upper limits obtained from HIPPI measurements (78 ppm in green, 68 ppm in red), fpolmust lie at the1% level, i.e., the dust grains must be very strongly non-polarizing. For debris disks resolved in scattered light (Schneider et al. 2014), the
polarization fraction of the scattered light lies between 5% and 50% (J. P. Marshall et al. 2016, in preparation), leading to expected polarization signals of 500 ppm from these hot dust stars; such signals would have been clearly detected in the data obtained here. If the dust grains were more red in their scattering color, then the excess at optical wavelengths would be reduced from that measured at near-infrared wavelengths. Table 5
Comparison of Hot Dust and Control Samples
Filter Sample pˆ f Distance
(ppm) (°) (pc) g′ A 17.3± 4.3 Control 32.9± 10.9 r′ A 11.0± 5.2 Control 16.7± 6.7 — A Ratio 1.58± 0.78 44.9± 23.7 25.9 Control Ratio 1.97± 0.96 46.2± 16.6 g′ F/G 49.4± 6.9 Control 43.1± 5.0 r′ F/G 57.5± 8.3 Control 40.6± 6.2 — F/G Ratio 0.86± 0.17 43.6± 16.5 17.3 Control Ratio 1.06± 0.20 6.5± 11.3 g′ All 33.6± 4.1 Control 38.6± 6.0 r′ All 34.8± 4.9 Control 29.2± 4.6 — All Ratio 0.97± 0.18 44.2± 14.4 21.6 Control Ratio 1.32± 0.29 26.3± 10.0 g′ Southern 46.5± 5.3 Control 43.3± 5.1 r′ Southern 47.9± 6.6 Control 37.4± 5.6 — Southern Ratio 0.97± 0.17 36.4± 13.0 24.9 Control Ratio 1.16± 0.22 9.8± 9.6
Note. Control star measurements have been scaled by their distance relative to the corresponding control. Mean polarization measurements have been debiased according to Equation(2).
8
These numbers are consistent with the hypothesis that a hot dust component in HD 28355 is anti-aligned with an ISM component to produce its very low polarization.
3.2.2. Polarimetric Color of the Local ISM
The wavelength dependence of polarization of the ISM usually peaks at optical wavelengths (Serkowski et al. 1975).
The empirical wavelength dependence of interstellar polariza-tion is given by the Serkowski Law(Serkowski et al.1975) as
modified by Wilking et al. (1982):
( )l (l )= (( - l ) (l l )) ( )
p p max exp 0.1 1.86 max ln2 max , 5
where λ is the wavelength examined and λmax is the wavelength of maximum polarization.
Using the green and redfilter measurements of the southern control stars we determined a mean ISM polarimetric color and fit the Serkowski Law to it. We have restricted this analysis to southern stars because the increased interstellar polarization at southern latitudes reduces the influence of statistical uncertain-ties. Additionally, as discussed later, the southern controls, as a group, display minimal dispersion. The mean distance of these stars is 27.4 pc. The mean effective wavelength of the controls in the g′ and r′ filters are 468.0 nm and 621.6 nm, respectively. The Serkowski Law allows us to determine the ratio of interstellar polarization at these two wavelengths for any givenλmax, simply by calculating Equation(5) for each and taking the ratio, i.e.,
( ( ) ( ) ( ( ) ( ) ( ) l l = p p p p p p : 468.0 nm 621.6 nm . 6 green red max max
The maximum possible pgreen:predratio may be obtained simply by plotting pgreen:predagainstλmax, as in Figure1. In this case the maximum ratio is 1.17, and occurs for aλmaxof 250 nm. The ratio we measured from the controls was close to this: 1.16± 0.22. As can be seen in Figure1 this corresponds toλmaxbeing equal to either ∼185 nm or ∼315 nm, or considering the uncertainty, a range of possible values forλmaxbetween∼35 and ∼600 nm.
3.2.3. Hot Dust
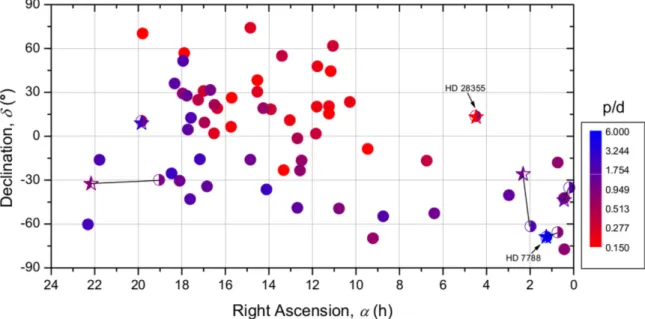
In Figure2we show the magnitude of polarization in green for all stars scaled by the relative stellar distances(i.e., p/d), as compared to stars from the HIPPI (Cotton et al. 2016) and
PlanetPol(Bailey et al.2010) surveys. The PlanetPol stars were
observed at a longer wavelength than those observed by HIPPI (roughly 750 nm cf 460 nm for an F0 star), and thus the PlanetPol measurements must be scaled accordingly to compare the two surveys. Since the value forλmax of 315 nm determined in the previous section results in a near maximal conversion ratio, and has a large uncertainty, we have taken account of the uncertainty rather than make a calculation based on 315 nm. Instead, we calculated an expectation value of 1.20 for the pgreen:pPlanetPol ratio based on normalized probabilities for a range ofλmaxvalues, where the probabilities result from an assumed normal distribution for the pgreen:pred ratio with mean 1.16 and standard deviation 0.22. The calculated ratio corresponds to λmax equal to 470 nm—a fairly conservative interpretation of the results.
Broadly speaking, the target stars have polarizations consistent with that expected from the ISM given their distances based on previous estimates. After scaling the magnitude of polarization of the control stars for the difference in distance between the control and its target counterpart, their values do not differ greatly(see Table4). The distance-scaled
polarization (p/d) of the targets and controls as a function of their sky position is presented in Figure2. Here we see that the distance-scaled polarization varies smoothly across the sky, and that the polarization magnitude values obtained here for both targets and controls are consistent with what would be expected given the stars’ sky positions and distances, as shown in Cotton et al.(2016). In Figure2it can be seen that sometimes there are closer stars already observed by HIPPI than those selected as controls in this work. Those stars are considered unsuitable for comparison with the hot dust stars due to the large disparity in distances between them. One exception to this is the case of HD 28355/HD 28556 in the green filter band, where (with large uncertainties) the control, HD 28556, exhibits polariza-tion at the 50 ppm level, whereas the target, HD 28355, has no significant polarization. Given the distances to these targets (d ∼ 50 pc), we would expect an ISM contribution of ∼50 ppm. It is possible that the absence of measurable polarization from HD 28355 is thus the result of multiple vector contributions canceling each other out. Another exception is the large p/d value seen for HD 7788 and HD 7693.
For the A stars wefind that the degree of green polarization is weaker in the hot dust stars at the 1.1-σ level than for the controls (17.3 ± 4.3 ppm cf 32.9 ± 10.9 ppm, respectively). This may be an indication that the hot dust stars in this group are intrinsically polarized oppositely to the ISM, or that the ISM is particularly patchy. The polarization is consistent between the two groups in the redfilter band (11.0 ± 5.2 ppm cf 16.7± 6.7 ppm). Consequently, the ratio of green to red is steeper for the control stars, 1.97± 0.96, than for the A stars, 1.59 ± 0.78, though, due to the larger errors on the control group, not significantly so. Due to their proximity, and therefore weak polarization, the orientation angles have large uncertainties, but both groups show tentative evidence for dispersion: f = 44°.9 ± 23°.7 for controls (1.9-σ), and 46°.2 ± 16°.6 for targets (2.8-σ). Dispersion is indicative of multiple polarigenic mechanisms with different efficiencies at different wavelengths; its presence in the control group suggests multiple interstellar dust clouds with varying physical properties along the line of sight. Two of the three target-control pairs in this group are in the northern hemisphere where interstellar polarization is weaker and this scenario more likely. Figure 1. Plot of the pgreen:pred ratio (black) vs. λmax determined from
Serkowski’s Law (Serkowski et al. 1975; Wilking et al.1982). The shaded
region corresponds to the 1-σ error in the mean pgreen:predratio obtained from the control stars. To show the conversion implied for PlanetPol data, relevant for Figure2, the pgreen:pPlanetPolratio vs.λmaxis also shown(gray).
For the F/G stars we find that the red polarization of the hot dust stars is stronger than the controls, at the 1.4-σ level (57.5 ± 8.3 ppm cf 40.6 ± 6.2 ppm), but that the two groups are consistent in green (49.4 ± 6.9 ppm cf 43.2 ± 3.9 ppm). The ratio of green to red for the targets, 0.86 ± 0.17, is consistent with that of the controls, 1.06 ± 0.20. All of these stars are situated in the southern hemisphere where the ISM contribution is stronger. Thus the contribution of hot dust to the measurement, if present, is further diluted. However, while the control group shows no dispersion (f = 6°.5 ± 11°.2), the F/G hot dust group does have a significant dispersion (f = 43°.6 ± 16°.5). This implies that there is an intrinsic component to the hot dust star polarization that has a different wavelength dependence to the ISM.
In aggregate, combining the A star and F/G star sub-samples, both the hot dust and control groups show dispersion (f = 45°.2 ± 14°.4 for targets and 37°.0 ± 10°.0 for controls), but when the two northern control-target pairs are removed from the analysis, the remaining controls are consistent with only a very small level of dispersion (f = 9°.8 ± 9°.5, 1.0-σ) while the hot dust group still shows a more significant level of dispersion (f = 36°.4 ± 13°.0, 2.8-σ). The pgreen:pred ratios suggest a stronger polarization in green for the ISM than for the hot dust stars(or, contra-wise, a rising contribution in red from hot dust stars compared to the controls), but this is not statistically significant. Thus the main result here is that there is no large significant polarization associated with the hot dust phenomenon. To illustrate the dispersion, the distance-scaled q and u vectors for each target-control pair are presented in Figure3.
4. DISCUSSION
Although the primary objective of this work has been to examine the hot dust phenomenon, we have also obtained new information on the local ISM. In order to put the hot dust
measurements in their proper context, we first discuss the implications of our observations for the local ISM.
4.1. Local ISM
The pgreen:predratio obtained here for the controls represents thefirst information on the polarimetric color of the local ISM. Until very recently the level of polarization within the Local Hot Bubble (the cavity in the ISM within which the solar system resides, ∼100 pc in size) was below the threshold of accurate measurement. However, the development of parts-per-million polarimeters has now resulted in two polarimetric surveys of bright stars within 100 pc. A northern hemisphere survey with the PlanetPol instrument (Bailey et al. 2010) is
presented along with a southern hemisphere survey by HIPPI (Cotton et al. 2016). The PlanetPol instrument operated in a
range from 590 to 1000 nm, having an effective wavelength for an F0 star of 753.8 nm(Hough et al.2006). The HIPPI survey
used the g′ filter—an effective wavelength of 466.2 nm for an F0 star. The HIPPI survey produced systematically higher polarizations than the one using PlanetPol, but because there was no overlap between the surveys, it was not possible to determine what portion could be ascribed to polarimetric color and what could be due to differing levels of interstellar polarization in different regions of the sky.
The empirical wavelength dependence of interstellar polar-ization is given by the Serkowski Law (Equation (5))
(Serkowski et al. 1975; Wilking et al.1982). A typical value
forλmaxis 550 nm(Serkowski et al.1975), but a wide range of extremes have been reported, e.g., 360–890 nm (Wilking et al. 1982). The reddest values of λmax are associated with dusty nebulae and larger grain sizes (Clarke 2010, and references therein). However, all previous work corresponds to regions beyond the Local Hot Bubble. The Local Hot Bubble is a region largely devoid of dust and gas. The results presented here, albeit with large uncertainties, suggest a particularly blue Figure 2. Plot of polarization/distance (p/d) vs. sky position for the hot dust and control stars in the g′ filter. Target stars are half-filled star shapes, while controls are half-filled circles. Target-control pairs are connected by solid lines. Literature measurements, shown as filled circles, are taken from Cotton et al. (2016) and Bailey
et al.(2010). Only those stars believed to have negligible intrinsic polarization have been included. All data has been debiased according to Equation (2). The
PlanetPol values have been scaled to g′ according to the mean color of the ISM determined from our g′ and r′ measurements using Serkowski’s Law; see text for details. Although the color scale runs from p/d of 0.15 to 6.0, some stars plotted fall outside this range, and are shown as the extreme color. Note that although some literature stars appear closer to the hot dust stars than the selected controls when projected on the sky, they are further away when taking account of distance.
λmaxfor this region; this implies small grain sizes. A dedicated multi-band polarimetric study of stars within the Local Hot Bubble is needed to confirm this result, but it seems clear that polarization in the g′ filter is greater than that in the PlanetPol waveband. However, even allowing for the correction, as can be seen from Figure2, polarization with distance is greater in the south than the north. In fact, had our determination ofλmax been more ordinary(redder λmax), the conversion factor applied to the PlanetPol data would have been less, and the difference
between the hemispheres starker. A finding of greater interstellar polarization in the south is supported by the survey of Tinbergen (1982), whose was the most sensitive (60 ppm
precision) prior to that of Bailey et al. (2010) and Cotton et al.
(2016). He tentatively (using 2-sigma results) identified a
“patch” of interstellar polarization roughly 30° in angular extent at southern galactic latitudes between 0 and 20 pc, which, on an equatorial co-ordinate system, corresponds predominantly to southern latitudes.
Figure 3. Polarization plot showing q and u vectors to illustrate the dispersion of polarization between hot dust and control pairs in g′ and r′ filters. The controls have been scaled by their distance relative to the corresponding target. Axis scales are in parts-per-million. Squares denote g′ measurements, while circles denote r′ measurements. Target stars are shown in color, while controls are in gray scale. Uncertainties are 1-σ. Solid lines denote the vector for target stars, while dashed lines denote the vector for control stars. The dispersion is half the angle between green and redfilters as displayed on this plot.
The results of the HIPPI survey suggested that, within the Local Hot Bubble, ∼2 ppm pc−1 was close to the maximum polarization with distance for any region on the sky in g′. That extreme corresponded predominantly to regions of the southern sky within 30 pc. For the most part, the ISM displayed the level of polarization expected. The controls, which were mostly nearby in the south, averaged to 1.81 ppm pc−1in g′. However, the very high polarization we measure here for nearby star HD 7693 at 7.42 ppm pc−1challenges this conclusion. HD 7693 is particularly polarimetrically red. A second control, HD 4308, and the hot dust star these two controls are paired with, HD 7788(which also has a high polarization), also display a similar pgreen:predratio. This gives us confidence the ISM is responsible for the higher polarization observed in this region of the sky. Additionally, the polarization angles for all three are very similar—in both green and red—indicating that a single interstellar dust cloud is primarily responsible for the elevated polarization recorded in this instance. Recent measurements of the hot Jupiter host star, HD 189733 (Bott et al. 2016), also
return a background polarization magnitude in excess of that expected from the trends identified in Cotton et al. (2016).
These results underline how patchy the local ISM can be. In the previous section, mention was made of the dispersion (f) and how it was consistent with zero for the F/G control group but not the A control group(see Table5). Treanor (1963)
was thefirst to point out that if a light ray passes through two misaligned dust clouds with different chromatic polarimetric properties then this will rotate the position angle of one wavelength with respect to another. Gehrels & Silvester(1965)
have observed this dispersion phenomena in more distant clouds. From the A control group, the two stars with the greatest deviation are both northern stars. A reasonable hypothesis to explain this is therefore that the dust in the south is better aligned, predominantly forming a single cloud, whereas the north may contain a variety of unaligned clouds. We can rule out the chance possibility of oppositely aligned, strongly polarizing clouds in the north since the PlanetPol survey results show a smooth increase in polarization with distance there(Bailey et al.2010). Thus, given that in the north
especially, interstellar polarization within the Local Hot Bubble is very low, misaligned but similarly diffuse clouds are likely to be producing the observed effect.
4.2. Hot Dust
In Section 3.2.1, we determined that the measured polariza-tion of the hot dust stars is consistent with the expected ISM contribution, given the stellar distances. From this we placed limits on the total brightness of any exo-Asteroid belt around these stars, assuming the fractional excesses were produced by scattered light. The predicted values for a scattered light origin of the excesses were much greater than the observed polarization magnitudes.
As an alternative to scattered light we might assume the excess is produced by thermal emission, or some combination of scattered light and thermal emission. In this case, the relationship between polarization and dust luminosity is given by
( ) ( )
=
p LIR L fpolA 7
where the polarization is p, dust fractional luminosity is LIR/Lå, polarization fraction is fpol, and albedo is A. In this instance we need to know LIR/Lå, which we calculate to be 3%, under the
assumption of blackbody emission with Tdust∼ 1500 K from temperature constraints given by the slope of H and K measurements in Absil et al. (2013) and Ertel et al. (2014).
For micron-sized dust grains the albedoes typically span a range 0.1–0.3 for silicacious and icy materials, respectively (Masiero et al.2011). Assuming a 1% fractional excess in the
H band caused by thermal emission from 1500 K dust at 0.1 au around a Sun-like star, the optical scattered fractional bright-ness ( Fscat/Få) would be in the range of ∼20–60 ppm (Kennedy & Wyatt 2011), consistent with both the
non-detection of significant polarization by HIPPI and the derived expectation value of hot dust polarization (for polarization fractions of 5%–50%). The observed properties of hot dust are therefore consistent with a thermal emission origin for the excess.
However, most of the stars in our sample are more luminous than the Sun, as adopted in the above example. This requires the adoption of lower albedoes and/or lower polarization fractions to match the measured polarization magnitudes. Low albedo(0.1), low polarization fraction (5%) dust grains are consistent with the measurements, but these properties (in combination) are atypical for micron-sized debris dust grains. Sub-micron (0.1 μm) dust grains are predicted to have such qualities, and have been attributed as the cause of the hot dust phenomenon through thermal, rather than scattered light, emission (Rieke et al. 2015). Identifying a combination of
dust optical properties and material consistent with these observations is beyond the scope of this work, but the parameter space defined here is consistent, in varying parts, with commonly adopted materials. We can rule out scattered light from typical(micron-sized) dust grains as the origin of the near-infrared excess, being too bright and strongly polarizing, with the caveat that the geometry of the dust might conspire to mask the total polarization signal.
The F/G hot dust stars have a dispersion inconsistent with zero at a significant level, while the controls are consistent with zero. If the southern A star control-target pair is added to the three F/G stars this result is little changed. The pgreen:predratio is greater in the hot dust groups than their controls; though not statistically significant, this is likely due to fairly large proportional errors. In combination with the dispersion, the difference in ratios hints at an intrinsic polarization by hot dust with a different spectral slope to that of the local ISM. This must be a small effect, much smaller in fact than for more typical debris disk host stars (J. P. Marshall 2016, in preparation), and suggests that the contribution of the hot dust to the total polarization is smaller than that of the ISM, even for stars as close as these. This is consistent with the hot dust phenomenon being attributed to the presence of small nano-scale grains, which would by nature be weakly polarizing.
As alluded to in the introduction, there are potential mechanisms for inducing low level polarization in stars that do not require circumstellar dust. Be star mechanisms can be ruled out as a cause for stellar polarization in this sample due to the range of spectral types. Similarly, none of the stars are noted for strong stellar activity or photometric hotspots, two further causes of polarization. Oblateness has been proposed as a cause of stellar polarization (Öhman1946) that would also
have an increasing effect toward longer wavelengths, although this has not been detected. Three of the stars in this sample have been measured, or are postulated, to be oblate to varying
degrees—HD 2262 (0.15), HD 7788 (0.20), and HD 187642 (0.09) (van Belle 2012). The best candidate for detecting
oblateness-induced polarization is Regulus, with a magnitude of ∼37 ppm (Bailey et al. 2010), which rotates at 86% of its
critical velocity and has a B8 IV spectral type (D. V. Cotton 2016, private communication). The hot dust stars in this sample are all slower rotators and cooler than Regulus, such that the magnitude of the induced polarization should be much smaller (Sonneborn1982) and it cannot, therefore, be called upon as a
mechanism to explain the observations. A final possibility for interference with the polarization signal of the hot dust phenomenon is the presence of a close sub-stellar companion to the target star, i.e., a hot Jupiter. The predicted amplitude of hot Jupiter-induced polarization is at the 10 s ppm level(Seager et al. 2000). The most recent measurements of HD 189733
support a signal of this amplitude (Wiktorowicz & Nofi2015; Bott et al. 2016).
However, there are scenarios that would result in a non-detection of polarization. Concerning geometry, if the debris was distributed smoothly in a disk oriented face-on, the polarization from the dust would cancel evenly leaving little to no detectable signal; we discount this possibility as being highly unlikely for all six targets in the sample. Likewise, a spherical shell of dust grains around the star, perhaps delivered by exo-Oort cloud comets, would also produce little measur-able polarization; this is a scenario we cannot test with these observations. Alternatively, time variability of the hot dust may also result in a non-detection if the level of dust was low at the epoch of observation. Ertel et al. (2016) validated previous
detections of hot dust stars with VLTI/PIONIER and identified only one case, that of HD 7788 (one of the targets examined here), where the hot excess was detected and found to be variable. The persistence of the hot dust phenomenon over multi-year timescales makes it unlikely that the lack of detections here can be ascribed to variability.
5. CONCLUSIONS
We have measured the optical polarization of starlight at the parts-per-million level for six hot dust excess stars in two wavebands. These stars do not exhibit excess emission at other, longer wavelengths, allowing us to rule out contributions from cooler circumstellar matter to the total polarization. We also observed a number of non-excess control stars closely situated to the target stars in order to characterize the ISM contribution to the total polarization.
The magnitudes of polarization of the hot dust stars are consistent with those of the ISM controls. Using simple arguments, our observations suggest dust grains with low albedos and low polarization as the origin for the observed excesses, incompatible with the scattered light properties of known circumstellar debris disks. From this we can rule out the scattered light from dust in exo-Asteroid belts being respon-sible for the hot dust excesses. Our results favor the interpretation of hot dust as being due to the thermal emission of nano-scale dust grains trapped in the vicinity of the host star. While a face-on geometry for the discs would produce little measurable polarization, such a geometry would be unusual for all six hot dust stars examined here. We cannot rule out a spherical distribution of dust either, but that is not a scenario we wish to examine here.
Significant dispersion in the hot dust stars in contrast to the southern control stars indicates an intrinsic polarization by hot
dust with a different spectral slope to the local ISM. The data implies a greater contribution at redder wavelengths. The contribution of the hot dust to the measured polarization can only be around 30 ppm or less, consistent with small, sub-micron dust grains.
These observations constitute the first multi-wavelength measurements of the ISM within the Local Hot Bubble, and suggest a particularly blue polarimetric color for the ISM in this region. In the south, the absence of significant dispersion is consistent with a homogeneous single cloud for the ISM. In general we find levels of interstellar polarization consistent with that found by the HIPPI bright star survey(2 ppm pc−1). A region of the ISM in the direction of HD 7693 is identified where the polarization reaches >7 ppm pc−1 illustrating the clumpy nature of the ISM, even within the Local Hot Bubble. We have demonstrated the potential of modern aperture polarimeters with their greatly improved precision to probe the inner regions of nearby star systems. No other technique is able to provide the insights into hot dust systems developed here. To make best use of this technique, though, requires an improved knowledge of the properties of the local ISM, in particular the distribution of dust and its polarimetric color. We urge multi-band polarimetric mapping of the local ISM as a priority to facilitate further insights.
The authors thank the anonymous referee for their comments which helped improve the manuscript. J.P.M. is supported by a UNSW Vice-Chancellor’s postdoctoral fellowship. G.M.K. is supported by the Royal Society as a Royal Society University Research Fellow. This work has been supported by Mexican CONACyT research grant CB-2012-183007(CdB). This work was supported by the European Union through ERC grant number 279973 (G.M.K. and M.C.W.). This work has made use of observations taken on the Anglo-Australian Telescope. This research made use of the the SIMBAD database and VizieR catalog access tools, operated at CDS, Strasbourg, France. This research has made use of NASA’s Astrophysics Data System Bibliographic Services. We acknowledge the assistance of Behrooz Karamiqucham in helping take the observations during 29/10–3/11/2015.
REFERENCES
Absil, O., Defrère, D., Coudé du Foresto, V., et al. 2013,A&A,555, 104
Absil, O., di Folco, E., Mérand, A., et al. 2006,A&A,452, 237
Absil, O., di Folco, E., Mérand, A., et al. 2008,A&A,487, 1041
Absil, O., Mennesson, B., Le Boquin, J.-B., et al. 2009,ApJ,704, 150
Agol, E. 2007,MNRAS,374, 1271
Akeson, R. L., Ciardi, D. R., Millan-Gabet, R., et al. 2009,ApJ,691, 1896
Aumann, H. H., Beichman, C. A., Gillett, F. C., et al. 1984,ApJL,278, L23
Backman, D. E., & Paresce, F. 1993, in Protostars and Planets III, ed. E. H. Levy & J. I. Lunine(Tucson, AZ: Univ. of Arizona Press),1253
Bailey, J., Kedziora-Chudczer, L., Cotton, D. V., et al. 2015, MNRAS,
449, 3064
Bailey, J., Lucas, P. W., & Hough, J. H. 2010,MNRAS,405, 2570
Beckwith, S. V. W. 2008,ApJ,684, 1404
Bonsor, A., Augereau, J.-C., & Thebault, P. 2012,A&A,548, A104
Bonsor, A., Raymond, S. N., & Augerau, J.-C. 2013,MNRAS,433, 2938
Bott, K., Bailey, J., Kedziora-Chudczer, L., et al. 2016,MNRAS,459L, 109
Burns, J. A., Lamy, P. L., & Soter, S. 1979,Icar,40, 1
Chen, C. H., Sheehan, P., Watson, D. M., et al. 2009,ApJ,701, 1367
Clarke, D. 2010, Stellar Polarimetry(Weinheim: Wiley-VCH)
Cotton, D. V., Bailey, J., Kedziora-Chudczer, L., et al. 2016, MNRAS,
455, 1607
Defrère, D., Absil, O., Augereau, J.-C., et al. 2011,A&A,534, 5
Dermott, S. F., Nicholson, P. D., Burns, J. A., & Houck, J. R. 1984,Natur,
312, 505
di Folco, E., Absil, O., Augereau, J.-C., et al. 2007,A&A,475, 243
Eiroa, C., Marshall, J. P., Mora, A., et al. 2013,A&A,555, A11
Ertel, S., Absil, O., Defrère, D., et al. 2014,A&A,570, 128
Ertel, S., Defère, D., Absil, O., et al. 2016, A&A, submitted Gehrels, T., & Silvester, A. B. 1965,AJ,70, 579
Hough, J. H., Lucas, P. W., Bailey, J., et al. 2006,PASP,118, 1302
Kennedy, G. M., Matrá, L., Marmier, M., et al. 2015a,MNRAS,449, 3121
Kennedy, G. M., & Wyatt, M. C. 2011,MNRAS,412, 2137
Kennedy, G. M., & Wyatt, M. C. 2014,MNRAS,444, 3164
Kennedy, G. M., Wyatt, M. C., Bailey, V., et al. 2015b,ApJS,216, 23
Krivov, A. V. 2010,RAA,10, 383
Lebreton, J., van Lieshout, R., Augereau, J.-C., et al. 2013,A&A,555, A146
Masiero, J. R., Mainzer, A. K., Hand, E., et al. 2011,ApJ,741, 68
Matthews, B. C., Krivov, A. V., Wyatt, M. C., et al. 2014, in Protostars and Planets VI, ed. H. Beuther et al.(Tucson, AZ: Univ. Arizona Press),914521
Mennesson, B., Millan-Gabet, R., Serabyn, E., et al. 2014,ApJ,797, 119
Morales, F. Y., Rieke, G. H., Werner, M. W., et al. 2011,ApJL,730, L29
Naghizadeh-Khouei, J., & Clarke, D. 1993, A&A,274, 974
Nesvorny, D., Jenniksens, P., Levison, H. F., et al. 2010,ApJ,713, 816
Öhman, Y. 1946,ApJ,104, 460
Rieke, G. H., Gaspar, A., & Ballering, N. P. 2015,ApJ,816, 50
Roberge, A., Chen, C. H., Milan-Gabet, R., et al. 2012,PASP,124, 799
Schneider, G., Grady, C. A., Hines, D. C., et al. 2014,AJ,148, 59
Seager, S., Whitney, B. A., & Sasselov, D. D. 2000,ApJ,540, 504
Serkowski, K. 1962, in Advances in Astronomy and Astrophysics, ed. Z. Kopal (New York and London: Academic), 1
Serkowski, K., Matthewson, D. S., & Ford, V. L. 1975,ApJ,196, 261
Sonneborn, G. 1982, in Proc. IAU Symp. 98, Be stars, ed. M. Jaschek, & H.-G. Groth(Dordrecht: Reidel),493
Stark, C. C., Kuchner, M. J., & Lincowski, A. 2015,ApJ,801, 128
Su, K. Y. L., Rieke, G. H., Malhotra, R., et al. 2013,ApJ,763, 118
Thureau, N. D., Greaves, J. S., Matthews, B. C., et al. 2014, MNRAS,
445, 2558
Tinbergen, J. 1982, A&A,105, 53
Treanor, P. J. 1963,AJ,68, 185
van Belle, G. T. 2012,A&ARv,20, 51
van Lieshout, R., Dominik, C., Kama, M., & Min, M. 2014,A&A,571, A51
Wardle, J. F. C., & Kronenberg, P. P. 1974,ApJ,194, 249
Weinberger, A. J., Bryden, G., Kennedy, G. M., et al. 2015,ApJS,216, 24
Wiktorowicz, S., & Nofi, L. A. 2015,ApJL,800, L1
Wilking, B. A., Lebofsky, M. J., & Rieke, G. H. 1982,AJ,87, 695