Science Arts & Métiers (SAM)
is an open access repository that collects the work of Arts et Métiers Institute of
Technology researchers and makes it freely available over the web where possible.
This is an author-deposited version published in:
https://sam.ensam.eu
Handle ID: .
http://hdl.handle.net/10985/12715
To cite this version :
Jean-Baptiste MARCHAND, Jacques Andre ASTOLFI, Patrick BOT - Discontinuity of lift on a
hydrofoil in reversed flow for tidal turbine Application - European Journal of Mechanics B/Fluids
n°63, p.90-99 - 2017
Any correspondence concerning this service should be sent to the repository
Administrator :
archiveouverte@ensam.eu
Science Arts & Métiers (SAM)
is an open access repository that collects the work of Arts et Métiers ParisTech
researchers and makes it freely available over the web where possible.
This is an author-deposited version published in:
http://sam.ensam.eu
Handle ID: .
http://hdl.handle.net/null
To cite this version :
Jean-Baptiste MARCHAND - Discontinuity of lift on a hydrofoil in reversed flow for tidal turbine
Application - European Journal of Mechanics B/Fluids n°63, p.90-99 - 2017
Any correspondence concerning this service should be sent to the repository
Administrator :
archiveouverte@ensam.eu
Discontinuity of lift on a hydrofoil in reversed flow for tidal turbine
application
Jean-Baptiste Marchand
a, Jacques André Astolfi
b,∗, Patrick Bot
baALSTOM Hydro France, Immeuble INSULA, 11 rue Arthur III, CS 86325, 44263 NANTES Cedex 2, France
bResearch Institute of the Naval Academy, BCRM Brest, ECOLE NAVALE ET GROUPE DES ECOLES DU POULMIC - IRENAV, CC 600, 29240 BREST Cedex 9,
France
h i g h l i g h t s
• Measurement of forces on a NACA0015 hydrofoil in reverse flow : sharp leading edge, rounded trailing edge.
• Strong discontinuity of lift with hys-teresis is observed around 0° angle of attack.
• Leading edge separation on suction side triggers transition.
• Turbulent suction side boundary layer separates farther on rounded trailing edge than on laminar pressure side.
g r a p h i c a l
a b s t r a c t
a b s t r a c t
This work presents an experimental investigation of a hydrofoil in reversed flow configuration in the context of marine current turbine development. Experiments consist in hydrodynamic force measurements and PIV flow observations on a NACA 0015 hydrofoil, at 5×10⁵Reynolds number. The hydrofoil in reversed flow produces a higher lift than in the classical forward flow for very low angles of attack and proved to be relatively efficient for an angle of attack lower than 10°, despite a much higher drag than the same foil in direct flow. Moreover, the lift coefficient shows a discontinuity with an hysteresis effect when the angle of attack is varied up and down around zero-degree. It is shown that the sharp leading edge generates an early Leading Edge Separation Bubble on one side (suction side) even for vanishing angles of attack. This separation bubble triggers the transition to turbulence of the boundary layer on the suction side while the pressure side boundary layer remains laminar. As a consequence, separation on the rounded trailing edge occurs farther downstream on the (turbulent) suction side compared to the (laminar) pressure side. The Leading Edge Separation Bubble and the inherent up–down asymmetry in the boundary layer regime are responsible for the lift singularity.
E-mail addresses:jean-baptiste.marchand@ecole-navale.fr(J.-B. Marchand),
jacques-andre.astolfi@ecole-navale.fr(J.A. Astolfi),patrick.bot@ecole-navale.fr
(P. Bot).
1. Introduction
In a context of development of renewable energies, there is a growing interest in marine energies. Among them tidal currents are presented as a potential candidate because of the high density of seawater and the predictability of tides at a given location. However, toughness of the marine environment makes harvesting
the kinetic energy of tidal currents a technical challenge, to propose an efficient and reliable tidal turbine application for an industrial purpose. This requires development of appropriate solutions for turbines to guarantee sufficient energy production while reducing maintenance needs. Among several constraints, tidal turbines have to be adapted to quasi bidirectional flows produced by ebb and flood alternation, which is characteristic of many potential extraction sites. In the case of horizontal axis turbines, adaptation of the rotor can be made with several systems. An individual reversing system for each blade can be used. Orientation of the whole turbine can also be done through a yaw adjustment system, controlling the position of the turbine hub. Nevertheless it involves complex technical systems, with the risk of lower robustness and reliability of the turbine, and higher maintenance costs. A simpler solution can be to use blades in forward and reversed flow without any mechanical adjustment. Power regulation can be achieved by controlling the rotational speed. In this case, specific rotationally symmetric bi-directional blades or a uni-directional section in forward and reverse flow can be used [1,2]. Nonetheless both solutions result in geometrical peculiarities. In the case of the reversed hydrofoil, a thick rounded trailing edge and a sharp leading edge may lead to an unusual hydrodynamic behavior.
The objective of this paper is thus to give a new insight into the reversed hydrofoil behavior in the context of marine current turbines.
Before any turbine performance assessment it is interesting to properly analyze the characteristics of the two-dimensional foil section. For the reversed foil, detailed studies are rare in the literature, even more so regarding hydrofoils. However partial properties of two-dimensional reversed foil sections can be found. Indeed, several studies have been conducted on several airfoils for a complete range of angle of attack from 0°to 360°, including the reversed configuration (180°). Pope [3] studied a NACA 0015 foil for the complete range of angle of attack. Measurements were carried out at the Georgia Institute of Technology on a smooth foil. At a Reynolds number value of Rec
=
1.
23×
106, bothbalance measurements and pressure integration gave a maximum lift coefficient in reversed flow of 0.8 occurring at 10° angle of attack. Moreover, Pope [3] reported a lift and pitching moment not null at 0°reversed, but this result was attributed to tare and interference effects. Critzos et al. [4] showed lower performance of the reversed NACA 0012 airfoil regarding lift to drag ratio in comparison to the regular configuration. They noticed too a lift discontinuity around the zero angle of attack reversed, for Rec
=
5
×
105. The discontinuity disappears when Reynolds numberincreases to 1
.
8×
106. It is stated to be generated by an asymmetry in location of the separation point along the chord, between upper and lower surfaces of the foil.Several other studies have been carried out for the complete range of angle. However there is no apparent focus on the reverse flow configuration resulting in large angle steps in that zone. For example, [5] present performances of several NACA foils for a large range of Reynolds number values. Their data is based on both numerical and experimental investigations. Hoerner [6] also gives an overview of reversed foil behavior in comparison to forward flow. He observed that in most cases a lift coefficient of 0.7–0.8 can be expected which is approximatively 50%–70% of the lift reached in forward flow. The lift coefficient limit seems to be linked to long bubble type leading edge separation, as stated by Hoerner [6]. Obviously, drag is drastically increased compared to a forward configuration. Robinson [7] also presents some properties of an airfoil at an angle of attack ranging from 0°up to 180°carried out in the framework of studies about bullet impact effects on the aerodynamic properties of helicopter blades. Laitone [8] also gives an overview of reversed NACA 0012 characteristics but measured
at lower Reynolds Number. He concluded that, at low Reynolds Number, a sharp leading edge can be an advantage. More recently, Timmer [9] has explored performances of DU type sections on the whole range of angles of attack and at relatively high Reynolds number (Rec
=
7×
105) for application to wind turbines.Finally, Smith et al. [10] presented a numerical study of two foils: a NACA 0012 and a SC1095 in reverse-flow configuration. This study was conducted in the context of rotor craft development, as at high advance ratio a portion of the blade experiences a reverse flow. Numerical studies conducted using URANS, k
−
ω
SST and LES models have been compared to experiments from [4,11,3]. Numerical results in reversed flow configuration have been shown to be particularly grid sensitive, with for example a difference on the lift that can reach 25% between an O-grid and a C-Grid architecture. They also noticed the importance of the leading edge geometry in such a flowing configuration. Generally, those works have shown relative performance as well as specific behavior of reversed profiles. However, most of the available data is proposing a quite large angle-step (2°) around 180°angle of attack, meaning that the behavior of the reversed foil may be only partially captured.A large amount of work has been done on Laminar Separation Bubbles (LSB) on classical airfoils with rounded nose (see e.g. [12,
13] and references therein). The effects of the LSB on the suction side boundary layer transition and then on the airfoil performance have been well documented. In the case of foils with a sharp leading edge, such as the NACA 0015 in reversed flow, the leading edge separation bubble due to immediate separation right at the leading edge is quite different from an LSB, despite some similarities. Such separation bubbles on sharp leading edges have been identified in wind engineering and particularly in the aerodynamics of yacht sails [14,15] where they strongly affect the pressure distribution, hence the lift coefficient. Crompton and Barrett [16] gave a detailed analysis of the structure of the separation bubble on a flat plate with a sharp leading edge thanks to Laser Doppler Velocimetry.
In this paper, an experimental analysis is carried out on a two dimensional NACA 0015 section, with a focus on lift and drag measurement in reverse flowing configuration. The interpretation of results based on an asymmetry of the boundary layers regime on both surfaces is supported by 2D URANS simulations with both fully turbulent and transition models.
2. Experimental set-up
Measurements were carried out on both the reverse and regular foil configurations (Fig. 1) in the hydrodynamic tunnel of the French Naval Academy Research Institute (IRENav).
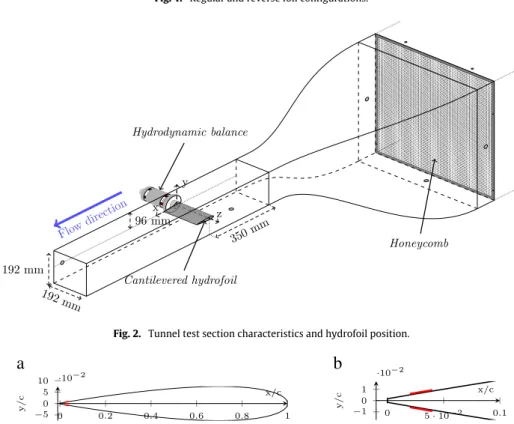
The tunnel test section is 192 mm
∗
192 mm and 1 m long downstream of a 1/9 contraction convergent (Fig. 2). The onset velocity ranges from 2.5 m/s up to 12 m/s. Pressure can be set between 0.1 and 3 bars and the measured turbulence intensity in the test section is 2% at 5 m/s.The hydrofoil is a two-dimensional NACA 0015 section with 100 mm chord, 191.5 mm span and 15 mm maximum thickness. It is made of mirror polished stainless steel material. In some cases, measurements are also carried out using roughness strips to trigger a turbulent boundary layer. The roughness is made of 1200 grain sandpaper, corresponding to 15
µ
m grain height. The sticking process allows for a 0.15 mm final roughness thickness. Rough bands are 3 mm wide and positioned at 2% of the foil chord from the leading edge, on both surfaces (Fig. 3), to keep the sharp geometry of the leading edge in reversed flow.The profile is mounted at mid-height of the test section, cantilevered on a 3-component hydrodynamic balance with a range up to 1700 N for lift force, 180 N for drag and 43 N m for pitching moment.
(a) Regular. (b) Reverse.
Fig. 1. Regular and reverse foil configurations.
Fig. 2. Tunnel test section characteristics and hydrofoil position.
Fig. 3. Location of the added roughness on the reversed NACA 0015. The actual shape of the sharp leading edge in reverse flow corresponds to a 0.5 mm thick flat frontal
surface and corners with 0.01 mm radius of curvature (Fig. 9).
(a) Side view. (b) Details of the foil fastening system.
Fig. 4. Overview of the mechanical set-up of the hydrodynamic balance and zoom on the fastening system.
As shown inFigs. 2and 4, the whole system is installed on the back of the tunnel test section. The balance is fixed into a supporting frame, mounted on bearings, and driven in rotation by a stepper motor. The stepper motor allows for 600 000 impulsions per rotation, meaning a resolution of 6
×
10−4°. Control is done inposition, but rotational speed and acceleration can also be adjusted by means of a generator driven from a Labview software, including a graphical user interface. Link between the frame and the stepper motor is made using an hydraulic ring to ensure a secured and rigid joint. This way, the foil rotation is done by moving the whole balance. Finally, the foil is fastened into the balance, secured by a tight fitted key/nut system.
The geometric 0°angle of attack of the hydrofoil is positioned with the foil chord set parallel to the flow using a wedge. As the test section is horizontal, it can also be visually controlled using the water surface at mid height when filling the tunnel. Finally,
as the foil section is symmetric, geometrical 0° AoA is located when lift is null in the direct flow configuration. This way, an accurate measurement of zero-lift angle is used for the final 0°AoA positioning. The absolute error on the hydrofoil angular position has been evaluated to less than 0
.
1°, while the repeatability was evaluated to 0.
01°. No angular slack was observed neither visually nor manually.Balance data recording required several tools for electric supply of sensors as well as for raw signal processing (Fig. 5). A IOtech strainbook 616 is used for strain gauges electrical supply and primary data recording. Tensions obtained for each load cell is sent to a computer where associated forces and coefficients can be viewed using a graphical user interface. Alternatively, processing can also be reworked from raw data, using a Matlab routine. As shown inFig. 5, data processing can be decomposed into 3 main parts. First the raw signal is converted from V to mV/V, using the
Fig. 5. Force measurement using the hydrodynamic balance, data processing.
supply tension. Secondly, as load cells are coupled, a calibration matrix is used to obtain forces in the Hydrodynamic Balance coordinate frame. The calibration matrix is obtained by static measurement on a dedicated test bed using calibrated weights. Thirdly, as the hydrodynamic balance follows the rotation of the hydrofoil, a rotation matrix is applied to project forces in the coordinate frame of the tunnel test section using the angle of attack. Measurements were carried out at 5 m/s, resulting in a Reynolds number value of Rec
=
5×
105.To complete global force measurements and computations, PIV observations were carried out using a pulsed Nd-YAG type Laser (Newwave Gemini Solo 2 15 Hz). A laser sheet generated with a cylindrical lens, is positioned at mid span and normal to the spanwise direction, above the foil. A CCD camera is also used with a resolution of 1280 by 1024 pixels and a sampling frequency of 4 Hz in double frame. The software triggers double frame between the laser sheet and the camera. One hundred image pairs are used for mean value calculation at each angle of attack. Details on the PIV measurement system are given in [17].
For each angle the balance was zeroed with no flow velocity, to account for the weight and buoyancy of the foil. Measurements were usually carried out with an angle-step of 1°, but refinement
(a) Lift.
(b) Drag.
Fig. 6. Lift and drag coefficients for the NACA 0015 hydrofoil in forward flow at Rec=5×10⁵.
(0
.
1°) was added near 0° angle of attack for the reversed configuration. Forces were measured during 10 s at a frequency of 1 kHz. A delay of 30 s was observed between two angles of attack, for the flow to stabilize. PIV measurements are simultaneous to force measurements.3. Results
The aim of this section is to describe the characteristics of a NACA 0015 hydrofoil in reversed flow. First, sub-Section3.1shows the results obtained in forward flow for reference. Moreover, tests with a smooth surface hydrofoil are compared with tests with roughness added near the foil leading edge to trip the boundary layer transition (Fig. 3(b)).
3.1. Forward flow
The measured forward flow lift and drag are given inFig. 6. In the smooth configuration, the maximum lift coefficient reaches 1.2
with a plateau from 13°to 18°angle of attack, similar to values observed by Sheldahl and Klimas [5]. Beyond that angle, massive flow separation occurs on the suction side. It leads to a lift drop as well as an important increase of drag.
A hysteresis loop is visible on both lift and drag when increasing or decreasing the angle of attack near the stall angle in the smooth configuration. This phenomenon generally occurs at relatively low Reynolds numbers and several studies have been conducted on the subject [18–21]. According to Mueller [19] this is linked to turbulence transition and separation, introducing a delay in flow reattachment when angles of attack are decreasing, compared to when increasing. Baragona [22] showed that the Laminar Separation Bubble bursting in the leading edge zone is responsible for occurrence of the hysteresis loop. In the present case, the hysteresis loop could also be favored by the low turbulence level in the tunnel, as suggested by Hoffmann [23].
Between 6°and 8°, it is observed that the lift coefficient deviates from the theoretical linear curve 2
πα
. This bump in the curve was also observed in simulations with a transition model [17,12], where it could be associated to the position of transition points on the hydrofoil. The inflexion occurs when the pressure side transition point reaches the trailing edge and the transition is close to the leading edge on the suction side. This behavior was also observed by Sheldahl and Klimas [5] and on a NACA0018 by Timmer [24].
It is interesting to notice that adding roughness near the leading edge suppresses the lift inflexion around 7°AoA and reduces the hysteresis loop around stall, as shown onFig. 6. This confirms the origin of both phenomena, i.e. the laminar/turbulent transition. Finally, on experimental data, the addition of roughness induces a slight lift decrease and a higher drag level in the linear zone, compared to the smooth configuration.
3.2. Reversed flow
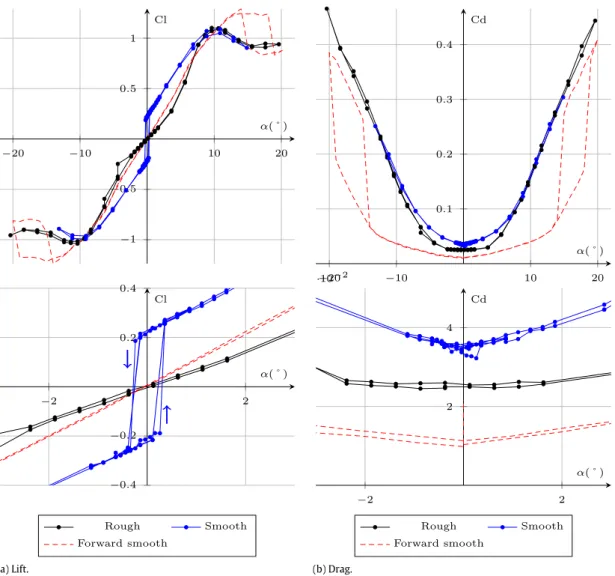
Measured lift and drag in reversed flow are shown inFig. 7for both smooth and rough conditions, with a refined investigation with 0
.
05° steps around 0°. Regarding the lift, the smooth configuration is characterized by an important discontinuity around 0°angle of attack. The lift coefficient suddenly jumps fromCL
= −
0.
2 up to CL=
0.
2 when the angle or attack is increasedthrough zero and no value of CLis measured between these values.
Moreover, an hysteresis loop occurs between
−
0.
25°and 0.
25° when increasing or decreasing the angle of attack. About 25% of the maximum lift is achieved in a variation of only 0.
25°of angle of attack. It should be noted that special care was taken in the foil fastening and angle of attack control, and it was carefully checked that this discontinuity and hysteresis are not due to a slack in the angle of attack setting. When roughness is added near the leading edge (seeFig. 3), the lift discontinuity and hysteresis around 0° disappear and the lift increases linearly with angle of attack until 3 to 4°, with values lower than for the hydrofoil in forward flow. For higher angles of attack, CLincreases more rapidly and tendsto the same maximum value as for the smooth hydrofoil, also observed around 10°angle of attack. The lift curve obtained with roughness addition is very similar to that published by Yates [25] from experiments of Smith on a reversed NACA 0012 [10].
The overall lift level is thus not as low as it might have been expected for a foil used in the wrong direction, but it is counter balanced by a higher drag level. For both the smooth and roughened configurations, the drag in reversed flow is generally higher than in the forward case. Between
−
7° and 7° angle of attack in reversed flow, the drag measurements on the roughened hydrofoil are surprisingly lower than in the smooth case. It may be that the tripped turbulent boundary layer reduces the pressuredrag due to the low pressure zone behind the rounded trailing edge which results in a lower overall drag compared to the smooth case. The PIV velocity field measurements can help understanding the experimental results on lift and drag in the reversed flow, and particularly around the sharp leading edge.Fig. 8shows the time-averaged velocity field measured in the vicinity of the sharp leading edge at 0
.
5°and 3°. Separation of the flow is clearly visible from the leading edge sharp corner at 3°angle of attack, and the flow reattaches downstream. This leading edge separation bubble is about 10 mm long and 1 mm thick. At 0.
5°, a small separation bubble is still visible right after the leading edge corner, with a length of the order of 1 mm and a thickness of order 0.1 mm.4. Discussion
4.1. Lift discontinuity
The sharp leading edge and rounded trailing edge NACA 0015 in reversed flow shows a lift discontinuity with hysteresis around 0°angle of attack. This discontinuity is removed by the addition of roughness near the leading edge. We suspect this phenomenon to be an effect of the asymmetry in the regime of the boundary layers on both sides, due to an early transition to turbulence on only one side. The transition on the suction side may be triggered by a separation bubble at the sharp leading edge. Indeed, Leading Edge Vortices are known to strongly affect the lift in many cases in wind engineering and particularly yacht sails [14,15]. In the present case of the reversed flow, a leading edge separation is likely to occur even for very small angles of attack, due to the sharpness of the leading edge.
To assess this interpretation and to analyze the effects of bound-ary layer transition, 2D RANS simulations were performed on the reversed NACA 0015 configuration based on the experimental set-up, both with a fully turbulent model and with a transition model.
4.2. Effect of the transition model in 2D URANS simulation
Results obtained from the numerical investigations help understanding the specific behavior observed in the experimental results.
4.2.1. Numerical set up
Numerical investigations were performed using the RANS/URANS code Ansys CFX⃝R. Calculations were made using two models.
A k
−
ω
SST turbulence model is chosen, as described by Menter [26] and Menter et al. [27] (named SST henceforth). It combines a k−
ϵ
model in the far field and a k−
ω
model near walls. K−
ϵ
model has difficulty representing the behavior of the detached boundary layer, whereas the k−
ω
model as presented by Wilcox [28] is known to better model the detached boundary layer.As experiments are carried out at a moderate Reynolds number (5
×
105), where laminar/turbulent transition can occur, it is completed by a CFD compatible transition model [29]. Theγ −
Reθtwo-equation based transition model, as described by Menter et al. [30] and Langtry and Menter [31], is chosen (SST-TM thereafter). The first equation defines an intermittency function
γ
used to turn on turbulent kinetic energy production downstream of the transition point. The second one is a transport equation including the momentum thickness Reynolds Number (Reθ), the transition onset Reynolds number. Its value in the boundary layer is a function of the boundary layer momentum thickness whereas outside the boundary layer it is forced to values provided by experimental correlations. This second equation is introduced to avoid additional non-local operations.(a) Lift. (b) Drag.
Fig. 7. Lift and drag coefficients for the NACA 0015 hydrofoil in reversed flow at Rec=5×10⁵. Graphs at the bottom show enlargements around 0°angle of attack.
Computations are run using a 2-D fully structured mesh, with dimensions based on the geometry of the tunnel test section. This allows to account for the blockage effect occurring during experiments, particularly at high angles of attack. Indeed, adequate mesh refinements are positioned at the foil surface as well as on test section walls, to correctly model velocity profiles.
The numerical model was defined according to standard recommendations and to a detailed verification process (mesh and time step convergence particularly) achieved in former works in a similar configuration [17,12,32]. The resulting mesh is illustrated inFig. 9. The final mesh is made of 130 000 nodes. It consists in a fully structured hexahedral mesh, based on an O–H architecture and including an O-grid of 80 layers up to 20–25 mm around the foil. The foil is described by a B-spline using 460 points, with refinements in high curvature zones such as leading and trailing edges.
According to meshing standards, average y+at the foil and test
section walls has been set to 1. First cell thickness can therefore be determined using Schlichting [33] formulations. The deployed mesh is characterized by a first cell thickness set to 10−6m, which results, after calculations, in y+
avg
<
1, y+
min
>
5×
10−2 and
y+
max
<
3.
5 at the profile surface.Mesh propagation at the boundary layer is done using a geometric expansion law applied to the O-grid. Expansion ratio at the walls is set between 1.1 and 1.2, to provide a sufficient number of cells in the high velocity gradient zone at the foil’s surface, where the boundary layer is the thinnest.
As the simulation results were found to be sensitive to the refined geometry of the sharp leading edge, special care was taken to mesh the sharp leading edge of the reversed hydrofoil, according to the actual geometry of the tested hydrofoil. Microscope observations revealed that the leading edge can be accurately modeled by a 0.5 mm thick flat frontal surface and corners with 0.01 mm radius of curvature, corresponding to the accurate geometry modeled (seeFig. 9).
A refined mesh has been set as well around the rounded trailing edge and near wake in order to correctly resolve the hydrodynamic forces.
Boundary conditions are defined to reproduce the IRENav hydrodynamic tunnel test section. This way, the Top and Bottom as well as the foil surface are defined as no slip walls. The inlet is set with a flow velocity of 5 m/s and the Outlet with a relative average pressure forced to 0 bar. The calculation domain is shown inFig. 9. Time step value is also chosen after a sensitivity study regarding both average and fluctuating effects. The final value is set to 10−4s. Calculations are considered valid when maximum residual values are under 10−5for steady cases and 10−4for unsteady cases. For unsteady calculations, the total simulation time is set to 2 s which is approximatively five times higher than the time for the fluid to travel through the whole domain.
This numerical configuration derives from a sensitivity study, regarding mesh size and time-step value and adapted from methods presented by Delafin et al. [34] and Ducoin [32] and developed in the laboratory. A detailed verification procedure
Fig. 8. Flowfield measurements carried out on the reversed NACA 0015 using PIV, smooth configuration, Rec=5×10⁵.
(a) Complete mesh.
(b) Mesh around the leading edge. Front face is 0.5 mm thick.
(c) Zoom on the leading edge corner.
Fig. 9. Mesh around the NACA 0015 designed for reversed flow calculations.
is out of the scope of this paper but extensive verification and validation have been made in a similar configuration, see [12,17].
4.2.2. Simulation results
The discussion of numerical results focuses on the different estimations of the lift coefficient from the fully turbulent model (SST) and from the transition model (SST-TM). The drag is not accurately predicted by the present computations because 3D effects are significant on the drag in the experiment, and resolving the drag would require to accurately model the boundary layer separation around the rounded trailing edge which would
necessitate a more refined mesh and/or more advanced models like LES and DES as stated by Smith et al. [10].
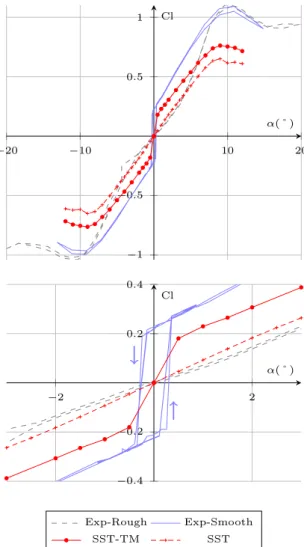
Fig. 10 shows the average lift coefficient computed with the fully turbulent (SST) and transition (SST-TM) models, compared to experimental results with roughened and smooth surfaces.
The overall lift level is generally under predicted by both numerical models. It is noticeable that, while the fully turbulent calculation fails to predict the lift jump observed in experiments on the smooth foil, with addition of the transition model the discontinuity appears. This corroborates the difference observed between smooth and rough experiments, confirming the close relationship between the occurrence of transition and the lift discontinuity.
Fig. 10. Numerical and experimental results for average lift coefficient, with the
NACA 0015 hydrofoil at Rec = 5×10⁵in reversed flow. The lift coefficient for
the smooth surface case in forward flow and at the same Reynolds number value is added for information.
Both models show the occurrence of an early leading edge separation bubble, as can be seen inFig. 11, which show flow fields similar to the experimental PIV velocity field.
The extent of the leading edge bubble at low angle of attack (Fig. 11(a) and (b)) is sensitive to the boundary layer model. Activation of the transition model allows the development of a longer leading edge bubble, which contributes to the increase of lift. At higher angles, the difference is much more limited between SST and SST-TM calculations (Fig. 11(c) and (d)). Looking more precisely at the case 0
.
5°angle of attack, one notices that considering the transition leads to a stagnation point located lower on the frontal surface and a longer leading edge bubble, resulting in a much higher velocity above the foil and more flow deviation upstream (upwash effect), what corresponds to a higher lift.The variation of lift coefficient with angle of attack shows the same slope for both the SST and SST-TM computations between 0
.
5°and 10°, but with an offset of 0.15 when using the transition model. It is interesting to note that in numerical results, the transition model induces a lift offset over the fully turbulent case which exists and is the same for all non-zero angles of attack.Fig. 12shows the location of the transition on the foil surfaces as a function of angle of attack, detected in the SST-TM simulations by the appearance of turbulent kinetic energy. At 0°angle of attack, the transition point is located near the trailing edge on both sides of the foil (xtr
/
c≃
0.
9). For any non-zero angle of attack, thetransition on the suction side (lower surface for
α <
0, uppersurface for
α >
0) switches to the leading edge (xtr/
c≃
0)while the transition on the pressure side is barely moved. As is well-known around bluff bodies, the regime of the boundary layer affects the location of the separation point near the rounded trailing edge.Fig. 12shows the location of the separation point on both sides and from both numerical models. With the fully turbulent model, separation occurs at xdet
/
c=
0.
945 on both sidesat 0°incidence and very gently moves upstream on the suction side and downstream on the pressure side when the angle of attack is increased. With the transition model, at 0°incidence, separation takes place at xdet
/
c=
0.
845 on both sides because laminarseparation occurs earlier than for a turbulent boundary layer. For
α =
0.
5°however, the separation abruptly jumps downstream toxdet
/
c=
0.
95 on the suction side and barely moves on the pressure side. For higher angles of attack, both separation locations show the same trends than with the fully turbulent model, but keep the significant offset established atα =
0.
5°(seeFig. 13).4.2.3. Origin of lift discontinuity and hysteresis
According to the experimental results, and supported by the simulations presented above, we can infer the following mechanism, as depicted on Fig. 14. For any non-zero but small angle of attack, the sharp leading edge imposes separation to occur right after the leading edge on the suction side of the foil, as the stagnation point is no longer on the very leading edge. The resulting leading edge bubble triggers an early transition to turbulence on this side, which then enables the boundary layer to stay attached farther downstream on the rounded trailing edge than the laminar boundary layer on the pressure side. The resulting asymmetry is responsible for the creation of circulation around the foil associated to a lift force, even for very small angles of attack.
Furthermore, for the value of Reynolds number tested here, we think that the zero-lift symmetric flow pattern at zero-degree angle of attack is unstable. We suspect that any infinitesimal perturbation in front of the foil moving the stagnation point out of the symmetry plane generates a leading edge separation on one side which triggers transition and delays separation near the trailing edge. The resulting lift and associated velocity circulation around the foil amplifies the upstream flow deviation, enhancing the asymmetry until saturation in a stable state with a finite amount of lift. This would explain the existence of two stable (or metastable) states in a narrow incidence range around zero and the observed hysteresis when increasing or decreasing the angle of attack. This destabilization is not observed in the simulation at
α =
0° because of the absence of perturbation. Such a behavior may resemble an asymmetric scenario reported for the drag crisis transition of a circular cylinder, called the one-bubblestate [35]. Moreover, the lift jump observed here could be related as well to the lift crisis phenomenon reported by Bot et al. [36] on asymmetric bodies. For further work, it would be interesting to investigate how this spontaneous symmetry breaking appears when increasing the Reynolds number from a laminar flow, and to measure how the bistability range in angle of attack changes with Re, in order to characterize the related bifurcation.
Finally, the present work is based on time-averaged measure-ments and the few PIV flow visualizations have low space and time resolution, but the flow shows significant unsteadiness. To better analyze the physical mechanisms involved in the separation bub-ble and boundary layers, it would be interesting to perform a more refined investigation with high space and time resolution.
5. Conclusion
Regarding marine applications, there are domains where a reversed flow can occur on a lifting surface. Depending on the design strategy, tidal turbine blades can be subject to reversed
(a) SST—α =0.5°. (b) SST-TM—α =0.5°.
(c) SST—α =3°. (d) SST-TM—α =3°.
Fig. 11. Flow streamlines showing the leading edge separation bubble on the reversed NACA 0015, 2-D URANS calculations. Note the different geometric scale from top to
bottom (the leading edge vertical segment is 0.5 mm).
Fig. 12. Location of the transition point along the foil chord on both faces of the
NACA 0015 reversed flow, Rec=5×10⁵, SST-TM numerical study.
flows due to ebb and flood alternation. It can occur as well on marine propellers when going into reverse or during crash back manoeuvres, or on control surfaces of AUV when manoeuvring as well. Aerodynamic foil characteristics including 180°AoA, which corresponds to the reversed flow, are available in the literature. However, data are usually carried out with a coarse angle-step and the reversed flow is not accurately described. For this reason, experimental investigation of a NACA0015 hydrofoil in reversed flow is carried out with force measurements at a Reynolds number of 5
×
105and particular attention has been paid to the behavior around the zero degree angle of attack in reversed flow.For a smooth hydrofoil around
α =
0°, a discontinuity of lift is observed with an hysteresis when increasing and decreasing theFig. 13. Location of the boundary layer separation point along the foil chord,
numerical results NACA 0015 reversed, Rec=5×10⁵.
Fig. 14. Asymmetric boundary layers configuration on the NACA 0015 foil surface
in the reversed flow forα ≃ 0°. Note that forα ∈ [−0.5°;0.5°], the up/down asymmetry may be either as shown or upside down.
angle of attack. The lift coefficient suddenly jumps from
−
0.2 to 0.2 when the angle of attack goes through zero, with an hysteresis loop forα ∈ [−
0.
5°;
0.
5°]
. No situation with zero lift is observed. This singular behavior is canceled if roughness is placed near the reversed foil leading edge to trigger turbulence on both sides of the hydrofoil. With the help of 2D RANS simulations with a transition model, this phenomenon is interpreted as the result of the asymmetry in the boundary layers regime due to an early transition triggered on one side by a leading edge separation, while the boundary layer on the pressure side remains laminar. The leading edge separation bubble and the asymmetry of the boundary layers generate the lift discontinuity. Simulations in fully turbulent flow, without transition model give the same results as the experiments with added roughness, i.e. no lift discontinuity.For further work, it would be interesting to perform time-resolved measurements and simulations with more advanced models to get more insight into the physical mechanisms governing the leading edge separation bubble, the transition to turbulence and the boundary layers characteristics.
More generally, the reversed hydrofoil proves to be relatively efficient compared to the direct flow configuration for small angles of attack, with a lift to drag ratio up to 12 at
α =
5°. For a tidal turbine blade or a marine propeller, the reversed flowing situation may significantly affect performances and change structural requirements. The existence of a lift discontinuity should be accounted for in the design.Acknowledgments
The authors would like to thank the French Naval Academy Research Institute and ALSTOM Hydro France for their support to this study.
References
[1] OG+1, L. ALSTOM Power, L. WUMTIA, Economic viability of a simple tidal stream energy device, final report, Tech. Rep., University of Southampton, WOLFSON Unit, 2007.
[2] R. Nicholls-Lee, S. Turnock, W. Boyd, Tidal turbine blade selection for optimal performance in an array, in: ASME (Ed.), 30th International Conference on Ocean, Offshore ans Arctic Engineering. No. OMAE2011-49943. Rotterdam, The Netherlands, 2011.
[3]A. Pope, The forces and pressures over an naca 0015 airfoil through 180 degrees angle of attack. Tech. Rep., Georgia Institute of Technology, Atlanta, 1947.
[4]C.C. Critzos, H.H. Heyson, R.W.J. Boswinkle, Aerodynamic characteristics of naca 0012 airfoil section at angles of attack from 0 to 180. Tech. Rep., National Advisory Committee for Aeronautics, 1955.
[5]R. Sheldahl, P. Klimas, Aerodynamics characteristics of seven symmetrical airfoil sections through 180-degree angle of attack for use in aerodynamic analysis of vertical axis wind turbine. Tech. Rep., Sandia National Laboratories, 1981.
[6] L.A. Hoerner, Fluid-Dynamic Lift Information on Lift and its Derivatives, in Air and in Water. Mrs. Liselotte A. Hoerner, 1985.
[7]K.W. Robinson, Aerodynamics characteristics of rotor airfoils as affected by simulated ballistic damage (Master’s thesis), University of Maryland, 1995.
[8]E.V. Laitone, Wind tunnel tests of wings at reynolds number below 70 000, Exp. Fluids 23 (5) (1997) 405–409.
[9]W. Timmer, Aerodynamic characteristics of wind turbine blade airfoils at high angles-of-attack, in: TORQUE 2010: The Science of Making Torque from Wind, 2010.
[10]M.J. Smith, N.D. Liggett, B.C.G. Koukol, Aerodynamics of airfoils at high and reverse angles of attack, J. Aircr. 48 (6) (2011) 2012–2023.
[11]J. Leishman, Aerodynamic characteristics of a helicopter rotor airfoil as affected by simulated balistic damage. Tech. Rep., Army Research Laboratory, 1993.
[12]P.-L. Delafin, F. Deniset, J.-A. Astolfi, Effect of the laminar separation bubble induced transition on the hydrodynamic performance of a hydrofoil, Eur. J. Mech. 46 (2014) 190–200.
[13]A. Ducoin, J.-C. Loiseau, J.-C. Robinet, Numericalinvestigation of the interaction between laminar to turbulent transition and the wake of an airfoil, Eur. J. Mech. B Fluids 57 (2016) 231–248.
[14]P. Bot, I.M. Viola, R. Flay, J.-S. Brett, Wind-tunnel pressure measurements on model-scale rigid downwind sails, Ocean Eng. 90 (2014) 84–92.
[15] P. Richards, I. Viola, Leading edge vortex dynamics, in: 17th Australasian Wind Engineering Society Workshop, 2015, pp. 1–4.
[16]M.J. Crompton, R.V. Barrett, Investigation of the separation bubble formed behind the sharp leading edge of a flat plate at incidence, Inst. Mech. Eng. (IMechE) 214 (part G) (2000) 157–176.
[17]J.-B. Marchand, Large scale homogeneous turbulence and interactions with a flat-plate cascade (Ph.D. thesis), Ecole Nationale Superieure d’Arts et Metiers, 2014.
[18] Z. Yang, H. Igarashi, M. Martin, H. Hu, An experimental investigation on aerodynamic hysteresis of a low-reynolds number airfoil. American Institute of Aeronautics and Astronautics AIAA-2008-0315, 2008.
[19]T.J. Mueller, The influence of laminar separation and transition on low reynolds number airfoil hysteresis, J. Aircr. 22 (1985) 763–770.
[20]K. Biber, G.W. Zumwalt, Hysteresis effect on wind tunnel measurements of a two-element airfoil, AIAA J. 31 (1993) 326–330.
[21]S. Mittal, P. Saxena, Prediction of hysteresis associated with static stall of an airfoil, AIAA J. 38 (2002) 933–935.
[22]M. Baragona, Unsteady characteristics of laminar separation bubbles, an ex-perimental and numerical investigation (Ph.D. thesis), Technische Universiteit Delft, 2004.
[23]J.A. Hoffmann, Effects of freestream turbulence on the performance character-istics of an airfoil, AIAA J. 29 (1991) 1353–1354.
[24]W.A. Timmer, Two-dimensional low-reynolds number wind tunnel results for airfoil naca 0018, Wind Eng. 32 (6) (2008) 525–537.
[25]J.E. Yates, Viscous thin airfoil theory. Tech. Rep., Aeronautical Research Associates of Princeton, Inc., 1980.
[26]F. Menter, Improved two equation k-turbulence models for aerodynamic flows. Technical memorandum 103975:34, NASA, 1993.
[27]F. Menter, M. Kuntz, R. Langtry, Ten years of industrial experience with the sst turbulence model, Turbul Mass Heat Transfer 4 (2003).
[28] D. Wilcox, A half century historical review of the k-omega model. AIAA Aerospace Sciences Meeting 0615, 1991.
[29] D. Di Pasquale, A. Rona, S. Garrett, A selective review of cfd transition models, in: 39th AIAA Fluid Dynamic Conference, 2009.
[30]F.R. Menter, R. Langtry, S. Völker, Transition modelling for general purpose cfd codes, Flow Turbul. Combust. 77 (2006) 277–303.
[31]R. Langtry, F.R. Menter, Correlation-based transition modelling for unstruc-tured parallelized computational fluid dynamics codes, AIAA J. (2012).
[32]A. Ducoin, Etude expérimentale et numérique du chargement hydrody-namique des corps portants en régime transitoire avec prise en compte du couplage fluide structure, in: Dynamique des fluides et des transferts, Ecole Centrale de Nantes, 2008.
[33]H. Schlichting, Boundary Layer Theory, in: McGraw-Hill Series in Mechanical Engineering, McGraw-Hill, 1960.
[34] P.-L. Delafin, F. Deniset, J.-A. Astolfi, Prediction of hydrodynamic forces with and without transition model, in: 15th Numerical Towing Tank Symposium, 2012.
[35]O. Cadot, A. Desai, S. Mittal, S. Saxena, B. Chandra, Statistics and dynamics of the boundary layer reattachments during the drag crisis transitions of a circular cylinder, Phys. Fluids 27 (2015) 014101.
[36] P. Bot, M. Rabaud, G. Thomas, A. Lombardi, C. Lebret, Sharp transition in the lift force of a fluid flowing past non-symmetrical obstacles: Evidence for a lift crisis in the drag crisis regime, Phys. Rev. Lett. 117 (2016) 234501.