See discussions, stats, and author profiles for this publication at: https://www.researchgate.net/publication/288309870
Quantifying sea urchins covering behavior by
image analysis
Article in Cahiers de Biologie Marine · January 2013
CITATION
1
READS41
2 authors: Some of the authors of this publication are also working on these related projects: Sea cucumber saponins and their effect on biological plasma membranesView project
Emily Claereboudt University of Liège 1 PUBLICATION 1 CITATION SEE PROFILE Michel Claereboudt Sultan Qaboos University 55 PUBLICATIONS 1,065 CITATIONS SEE PROFILE All content following this page was uploaded by Michel Claereboudt on 08 September 2016. The user has requested enhancement of the downloaded file.Introduction
The flower or trumpet sea urchin, Toxopneustes pileolous (Lamarck, 1816) is a common species in many areas of coarse sediment in the Omani sub-tidal ecosystems. It is nearly always found with various pieces of debris attached to the aboral surface. This “covering behavior” is defined as
the temporary attachment of pieces of debris (seaweeds, pebbles, shell fragments, etc.) on the aboral surface using tube feet. It is reported in various tropical and temperate species. For several species such as Strongylocentrotus
droebachiensis (Müller, 1776) (Adams, 2001; Dumont et
al., 2007), Lytechinus variegatus (Lamarck, 1816) (Sigg et al., 2007), Tripneustes ventricosus (Lamarck, 1816) (Fierce
Quantifying sea urchins covering behavior by image analysis
Emily J.S. CLAEREBOUDT1and Michel R. CLAEREBOUDT2
(1)Université de Liège, Gembloux Agro-Bio Tech, 2 Passage des Déportés, B-5030, Gembloux, Belgique
Mobile: +32 (0)479 07 83 67, Fax: +(968) 244 13418, Email: [email protected]
(2)Sultan Qaboos University, College of Agricultural & Marine Sciences, Box 34. Al-Khod 123, Sultanate of Oman
Abstract: Many sea urchin species collect debris on their aboral surface, a behavior collectively described as “covering
behavior”. In the Sultanate of Oman, the flower sea urchin, Toxopneustes pileolus, systematically shows this behavior, accumulating pieces of dead coral, pebbles, and fragments of various mollusks shells on its test. We compared the amount, size distribution, and relative volumetric mass of the covering material in three T. pileolus populations using both underwater image analysis and physical analysis of collected debris. The underwater photographic method to estimate test cover was a good predictor of the actual amount of debris on the test (R2= 0.85). Toxopneustes pileolus, preferred covering itself with the largest pieces of debris available in the surface sediment, but did not select pieces according to relative density. There were no significant differences in percentage cover neither among urchins of different diameters nor among urchins collected in different populations. We discuss these results in relation to various advanced hypothesis on the function of the covering behavior.
Résumé : Quantification du comportement de couverture chez les oursins par analyse d’image. Plusieurs espèces d’oursin
accumulent sur la face aborale du test des débris divers: un comportement qualifié de “couverture”. Au Sultanat d’Oman, l’oursin Toxopneustes pileolus fait preuve de ce comportement de façon systématique et accumule sur son test des fragments de coquille de mollusque, des morceaux de corail mort ou de petits gravillons. Nous avons comparé la quantité, la distribution de taille et la masse volumique relative de ces matériaux dans trois populations de T. pileolus en utilisant d’une part une méthode de photographie sous-marine et d’autre part une analyse detaillée du matériel recolté au laboratoire. La méthode d’analyse photographique in situ s’est avérée un bon indicateur de la quantité de débris accumulés par les oursins (R2= 0.85) malgré une tendance à la sous-estimation. Toxopneustes pileolous semble préférer les particules les plus grosses parmi celles se trouvant dans le sédiment voisin mais sans prendre en compte leur masse volumique. Nous n’avons observé de différence entre le niveau de couverture des oursins, ni entre populations, ni entre oursins de tailles différentes. Ces résultats sont mis en relation avec les différentes hypothèses avancées afin d’expliquer le “comportement de couverture”.
588 SEA URCHIN COVERING BEHAVIOR
& Lapin, 2004) and Lytechinus anamesus Clarck, 1912 (Lees & Carter, 1972), visible or UV light were the main triggering factors of the covering behavior. A single study so far has shown the role of covering as a camouflage behavior (Amsler et al., 1999) and several studies have suggested that the addition of pebbles and small rocks on the test serves to increase the relative density of urchins either because of their small size (Richner & Milinski, 2000) or the presence of high velocity currents (James, 2000). This increase in density would arguably give the urchin a higher stability and resistance to being overturned. Other hypotheses include the temporary storage of food items (Dix, 1970) or the protection of small structure (genital pore, madreporite or pedicellariae) from fine (sediment) or larger (seaweed fronts) particles suspended in the water (Richner & Milinski, 2000).
The aim of this study was, first to investigate whether photographic measurements of the debris on sea urchins would give reliable estimates, and second to examine the relationship between covering behavior and the type, size and density of the sediment found on and around T. pileolus.
Material and Methods
We collected specimens of Toxopneustes pileolus on May 2010 at 3 different locations at 10 m in depth (23º35’19.9”N-58º36’24.2”E, 23º31’13.3”N-58º43’30.3”E and 23º31’14.1”N-58º44’10.5”E) near the Capital area of the Sultanate of Oman (Fig. 1). The urchins were collected at approximately the same time of (cloudless) days at all three locations.
Sea urchins were first photographed in-situ with a standard scale (a 17.7 cm wide “ziplock” bag), then gently placed with all adhering pebbles and debris into labeled plastic bags. The open bag was placed over the urchin then gently closed underneath the animal, lifted from the sediment and zipped underwater. As the urchins have a relatively strong grip to their adhering material, very little material was lost during collection. At the same time a sample of sediment was also collected at a short distance, 20-40 cm, from each urchin and placed into a different labeled bag. This sediment was collected inside a circular shaped frame (23 cm in diameter) deeply set into the sea floor to ensure a constant sampling area (415 cm2). Only the first two centimeters of sediment were collected from this circular frame using a hand scoop. Six urchin samples and six sediment samples were collected in location 1 and 2, and eight in location 3. All debris, rocks, and pebbles attached to each urchin were gently removed with tweezers and collected in the labeled collection bag. The urchin was photographed again on a scaled surface to calculate an exact size and then released back into the environment. The bags of debris collected from the urchins and the sediment collected around each urchin were brought back to the laboratory for further processing.
All sediment samples were rinsed in freshwater to remove salt, and dissolved organic matter, and then sieved on 4 and 2 mm mesh to separate pebbles and rocks from sand. The individual size fractions were then dried until constant weight and weighed to the nearest 0.01 g. All particles larger than 1 cm in diameter were individually photographed and weighed to the nearest 0.001 g.
All pieces of debris collected on each urchin were individually photographed and weighed to the nearest 0.001g. The software ImageJ (Abràmoff et al., 2004) was used to calculate the surface area of each photographed piece of debris after calibration. From the estimated surface area, we calculated an Equivalent Circular Diameter (ECD) as:
(1) where S is the measured surface area of the particle.
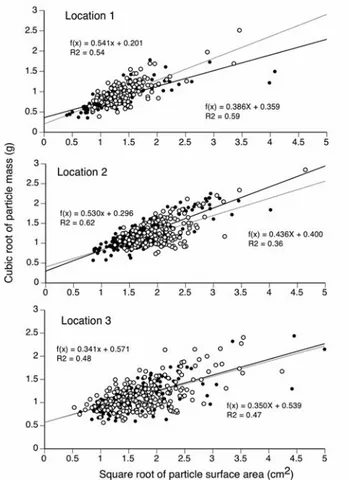
Estimates of the density of the debris particles found on and around the urchins were calculated using regression lines linking the cubic root of the weight of each particle to the square root of its surface area. Because the weight of a particle is its volume (proportional to the average length L of a solid to the cube) multiplied by the material density and its surface area is proportional to the square of its average length (L2), the ratio of the square root of the surface area to the cubic root of its weight is proportional to its density. On a scatter plot of these two variables, different densities of particles correspond thus to different slopes of the regression lines.
Figure 1. Toxopneustes pileolus. Map of the coast of Muscat (Sultanate of Oman), indicating the position of the 3 sampling locations.
Linear regressions were tested by ANCOVA and differences in percentage cover by ANOVA after arcsine(square root) transform of the proportions (Zar, 1984) using DataDesk (www.datadesk.com).
Results
All the urchins observed at the three locations displayed covering behavior and all had the same type of debris on their aboral surfaces: fragments of mollusk or sand dollar shell, pieces of coral skeleton, pebbles of different origin, and the occasional dark and dense ophiolite fragments washed in from the nearby wadis (dried river beds). Debris recovered from the urchins varied in size from around 16 cm2 for the largest to slightly less than 1 cm2. The average Equivalent Circular Diameter (ECD) of the debris found on the urchin differ significantly (ANOVA, F2,17 = 52.54, p < 0.001) among locations with the smallest particles found at location 1 (1.47 cm ECD) and the largest found at location 2 (1.73 cm ECD). Similarly, the smallest sea urchins were also found at location 1 and the largest urchins found at location 2 (ANOVA, F2,472 = 20.37, p < 0.001). The surface area of the urchins were square root transformed to insure homoscedasticity (F-test, F2,6=3.57, p = 0.10). The ECD values were tested for homoscedas -ticity (F-test, F2,17= 1.41, p = 0.25) prior to analysis.
For all urchins photographed, the photographic estimate of surface area covered by debris (from underwater photographs) was compared to the actual surface area of debris attached to the sea urchin test by adding up the areas of all individual debris particles collected from each urchin. The linear relationship between these variables was highly significant (R2= 0.84, p = 0.003, Fig. 2) and the slope of
the regression was 0.693, suggesting a systematic bias (underestimate) of the actual surface area.
There was no significant relationship between the size of the urchin (surface area of the aboral surface) and the % cover (t-test on slope of the regressions, t = -1.33, DF = 18, p = 0.19, Fig. 3). Similarly, the % cover did not vary between locations (ANOVA, F2,17= 0.81, p = 0.45, Fig. 4).
At all three locations, most of the particles found on the urchins were larger than 1 cm equivalent circular diameter (ECD) whereas in the surrounding sediment, most of the particles were < 1 cm ECD (Fig. 5).
The regressions analysis of the cubic root of their individual weight and the square root of the surface area of debris collected at the three locations (factor 1) and on or around sea urchins (factor 2) showed highly significant
Figure 2. Toxopneustes pileolus. Linear regression between cover (cm2) estimated by underwater photographs of the urchin in-situ and that measured by adding the surface area of all particles found on each urchin at three locations. The thin line of slope = 1 is the optimal estimate.
Figure 3. Toxopneustes pileolus. Relationship between relative cover (%) and the size of the urchin (projected surface area of the test in cm2).
Figure 4. Toxopneustes pileolus. Mean relative cover (%) of the aboral surface of the urchin by debris at three locations. Values were calculated by adding the surface area of all particles covering each urchin. Error bars are standard deviation.
linear relationships between these two variables (Fig. 6). The ANCOVA indicated that the density of particles did not vary between the urchins and the surrounding sediment but did vary significantly across locations (Table 1) suggesting that the urchins did not accumulate particles of different density than those available in their vicinity.
Discussion
All sea urchins observed underwater showed a covering behavior and although there was some variation in the amount of debris collected by the urchin, the percentage cover did not vary significantly with the size of the urchin (Fig. 3) nor among locations (Fig. 4). The percentage cover
found in the present study (62-70%) corresponds to the high end of the range for sea urchin (James, 2000). A study done on the urchin Lytechinus anamesus showed similar results with a percentage cover with mussel shells averaging 65% (Lees & Carter, 1972). In another study, the covering behavior of Strongylocentrotus droebachiensis
590 SEA URCHIN COVERING BEHAVIOR
Figure 5. Toxopneustes pileolus. Size distribution (relative weight) of the particles larger than 4 mm found in the sediment (dark bars) and on the sea urchin (light bars) at three locations.
Figure 6. Toxopneustes pileolus. Regression between the square root of the surface area and the cubic root of the mass for all particles found on sea urchins (filled symbols) and in the two largest fraction of the surrounding sediment (open symbols) at three locations. The regression slopes are proportional to the volumetric mass of the particles. In location 3, the two regression lines are graphically nearly identical.
Source of Variation Sum of squares DF Mean Square F-Stat p-value
Particle area (covariate) 53.89 1 53.89 1023.2 < 0.001
Location 1.94 2 0.97 18.44 < 0.001
Urchin/Sediment 0.054 1 0.054 1.02 0.31
Residual error 54.46 1034 0.053
Total 125.298 1038
Table 1. Analysis of covariance of the transformed mass (cubic root) of the particles with their surface area (square root) as a covari-ate across locations (factor 1) and sources of the particle (urchins vs sediment: factor 2).
was expressed as a semi-quantitative index (Dumont et al., 2007) most of the urchins were assigned a covering index of 2-3 corresponding to over 50% cover. On the tropical species Toxopneustes roseus (Agassiz, 1863) off the coast of Baja California and at the same depth as this study (9.6-11.6 m) only 38% of the aboral surface of the urchins was covered by debris (James, 2000) and on a photograph of
Toxopneustes pileolus in Taiwan, the cover seems to reach
nearly 90% (Chen & Soong, 2010) with coral fragments. There were differences in exposure to wave among the three sites: Site 1 experiences more wave action than either 2 or 3 which are both located in relatively deep embayments (Fig. 1). Despite these abiotic differences in exposure there were no significant differences in cover (Fig. 4) suggesting that exposure does not affect covering behavior.
This result is contrary to observations of Lytechinus
anamesus (Lees & Carter, 1972) and the congeneric Toxopneustes roseus (James, 2000). Our results also are
contrary to observations of Paracentrotus lividus (Lamarck, 1816) (Crook et al., 1999), T. pileolus did not change the amount of covering behavior with the size (Fig. 3).
The urchins in this study clearly selected the largest particles available in the sediment (Fig. 5) but did not make this selection on the basis of the volumetric mass of the particle available in the surrounding sediment (Fig. 6). In fact, in location 1 where dense ophiolite fragments are relatively frequents in the sediment, only one was found on an urchin. This preference for large particles and lack of preference for particular densities of rocks, does not support the hypothesis that urchins use pebbles and pieces of coral to anchor themselves to the bottom as suggested for the congeneric species Toxopneustes roseus (James, 2000).
Our observations support the other hypotheses that explain covering behavior. The large, mostly mineral and opaque debris, found on the urchins provide effective protection from light or UV light ( Verling et al., 2002; Dumont et al., 2007) and also from suspended particles (Richner & Milinski, 2000). Similarly, the covering of the urchin by particles collected from the sediment, may provide effective camouflage from predators (Dumont et al., 2007). Our results also support the food storage hypothesis (Dix, 1970) because most of the large particles collected on the urchins were covered with turf and encrusting coralline algae that T. pileolus consumes (James, 2000).
The photographic estimate of urchin cover gave a good although underestimate of the actual cover (R2 = 0.84). Because photographic estimates are rapid (a few seconds underwater, a few minutes in the laboratory), a larger number of urchins could be photographed and small changes in cover measured over time or space in situ without disturbing the normal behavior of the urchins. It might even be possible to mark some of the debris and
photograph the same urchins repeatedly (assuming the same debris is not dropped by one urchins to be used later by another). The 0.69 observed slope, and corresponding bias, is likely the result of the convexity of the urchin aboral surface. If flat particles of unit surface areas were distributed randomly on a hemispherical surface, on average, the angle of the position of these particles would be half-way down the surface: i.e. 45º. The perceived surfaces of these particle to an observer above the hemispherical surface would then be on average cos(45º) = 0.70, very close to the observed 0.69.
Although there were no significant differences in the relative cover among the three locations, the small urchins (location 1) seem to cover themselves with smaller particles than the larger urchins found in location 2 and 3. This difference may be related to the ability of larger urchins to lift larger particles from the sediment using more tube feet. The abundance of smaller urchins in location 1 is likely related to recent history. This more exposed location was severely impacted by cyclone Gonu in June 2007 (Tyagi et al., 2009) which destroyed most of the benthic fauna. These urchins represent a recent recruitment event and have not reached the sizes observed at the other locations.
References
Abràmoff M.D., Magalhães P.J. & Ram S.J. 2004. Image processing with ImageJ. Biophotonics international, 11: 36-42. Adams N.L. 2001. UV radiation evokes negative phototaxis and covering behavior in the sea urchin Strongylocentrotus droebachiensis. Marine Ecology Progress Series, 213: 87-95.
Amsler C.D., McClintoc J.B. & Baker B.J. 1999. An Antarctic feeding triangle: defensive interactions between macroalgae, sea urchins, and sea anemones. Marine Ecology Progress Series, 183: 105-114.
Chen A. & Soong K. 2010. “Uncovering” behavior at spawning of the Trumpet Sea Urchin Toxopneustes pileolus. Zoological Studies, 49: 9.
Crook A.C., Verling E. & Barnes D.K.A. 1999. Comparative study of the covering reaction of the purple sea urchin, Paracentrotus lividus, under laboratory and field conditions. Journal of the Marine Biological Association of the United Kingdom, 79: 1117-1121.
Dix T.G. 1970. Covering response of the echinoid Evechinus
chloroticus (Val.). Pacific Science, 24: 187-194.
Dumont C., Drolet D., Deschenes I. & Himmelman J. 2007. Multiple factors explain the covering behaviour in the green sea urchin, Strongylocentrotus droebachiensis. Animal Behaviour, 73: 979-986.
Fierce S. & Lapin H.E. 2004. Selectivity of covering material in two sea urchins, Tripneustes ventricosus and Lytechinus variegatus. Dartmouth Studies in Tropical Ecology, 2004: 166-168.
James D.W. 2000. Diet, movement, and covering behavior of the sea urchin Toxopneustes roseus in rhodolith beds in the Gulf of
California, México. Marine Biology, 137: 913-923.
Lees D.C. & Carter G.A. 1972. The covering response to surge, sunlight, and ultraviolet light in Lytechinus anamesus (Echinoidea). Ecology, 53: 1127-1133.
Richner H. & Milinski M. 2000. On the functional significance of masking behaviour in sea urchins—an experiment with Paracentrotus lividus. Marine Ecology Progress Series, 205: 307-308.
Sigg J.E., Lloyd-Knight K.M. & Boal J.G. 2007. UV radiation influences covering behaviour in the urchin Lytechinus variegatus. Journal of the Marine Biological Association of the
United Kingdom, 87: 1257-1261.
Tyagi A., Mohapatra M., Bandyopadhyay B.K., Singh C. & Kumar N. 2009. The first ever super cyclonic storm “Gonu” over the Arabian Sea during 1-7 June 2007: a case study. In: Indian Ocean Tropical Cyclones and Climate Change (Y. Charabi ed), pp. 305-13. Springer: Dordrecht.
Verling E., Crook A. & Barnes D. 2002. Covering behaviour in
Paracentrotus lividus: is light important? Marine Biology, 140: 391-396.
Zar J.H. 1984. Biostatistical analysis. Prentice Hall: Englewood Cliffs, NJ. 718 pp.
592 SEA URCHIN COVERING BEHAVIOR
View publication stats View publication stats