Coherent Lattice and Molecular Dynamics
in
Ultrafast Single-Shot Spectroscopy
by
Peter Roland Poulin
B.Sc. Chemistry, University of Western Ontario, 1996
M. Sc. Chemistry, University of Toronto, 1999
Submitted to the Department of Chemistry
in partial fulfillment of the requirements for the degree of
Doctor of Philosophy
at the
MASSACHUSETTS INSTITUTE OF TECHNOLOGY
June 2005C Massachusetts Institute of Technology, MMV
All rights reserved
/7
M A S A C US.T S I N S T ? i j MASSACHUSE S NTITUTE OF TECHNOLOGY JUN 2 1 2005 I I! ArCor--Author
Department of Chemistry
April 1, 2005
Certified by
Keith A. Nelson
Thesis Supervisor
Accepted by
Robert W. Field
Chairman, Departmental Committee on Graduate Students
I I Ir Pqr L I . I I L.0I .. %1--% I I L_ %j
This doctoral thesis has been examined by a committee of the Department of
Chemistry as follows:Professor Andrei Tokmakoff
Professor Keith A. Nelson
Ch-m- an
Thesis Supervisor
c /
/ ) I.
Coherent Lattice and Molecular Dynamics
in
Ultrafast Single-Shot Spectroscopy
byPeter Roland Poulin
Submitted to the Department of Chemistry on April 1, 2005 in partial fulfillment of the requirements for the degree of Doctor of Philosopy at the Massachusetts Institute of Technology
Abstract
This thesis focuses on the development, refinement, and application of dual-echelon single-shot ultrafast spectroscopy to the study of coherent nuclear motion in condensed phase systems. The general principles of the single-shot method are described, and particular emphasis is given to the general applicability and shortcomings of this technique and the extraction of data from raw laboratory images. Coupled to the single-shot system is a synchronously pumped dual-beam noncollinear optical parametric amplifier which was developed to provide independently tunable pump and probe beams in the visible and UV regions of the electromagnetic spectrum.
The second part of the thesis concerns the application of this technique to the study of atomic motions in liquids and solids. Single-shot nonresonant impulsive stimulated Raman scattering (ISRS) measurements in m-iodoanisole and bismuth germanate reveal the existence of transient coherent behavior. High-field resonant excitation of the semimetals bismuth, antimony and tellurium, as well as the semiconductor germanium telluride, reveals dramatic lattice anharmoniticity as a function of pump fluence. Finally, ultrafast photodissociation of the triiodide ion both in solution and in the solid state gives considerable insight regarding the role of the local environment in mediating chemical reaction dynamics.
Thesis Supervisor: Keith A. Nelson Title: Professor of Chemistry
Acknowledgements
It is with great pleasure that I acknowledge, first and foremost, my supervisor Keith Nelson for his enthusiasm, insight, vision and patience, without which the single-shot project would remain little more than a dream. In my time at MIT, he has been a source of guidance and inspiration without whom the work reported in this thesis simply could not have been completed. I don't think it's possible to come away from a conversation about science with Keith in a state other than "fired up", and it's his infectious enthusiasm which keeps all of us going.
I also wish to thank my committee members, Andrei Tokmakoff and Dan Nocera, for their guidance and support during the course of my graduate career. Andrei is a superb spectroscopist, and Dan can scarcely go an hour without coming up with a great new idea, and the combination is potent indeed.
I have had the distinct pleasure of working with and around so many wonderful individuals in the Nelson group, and the loss of this daily contact is one of the most difficult aspects of leaving MIT. Greg Wakeham introduced me to the lab and to the single-shot experiment, and I owe a large debt of gratitude to him. Tim Crimmins, Richard Koehl and Rebecca Slayton also welcomed me warmly when I joined the group, and for that I am most grateful.
The cast of characters who constituted "my generation" in the lab are a diverse bunch indeed. Nikolay Stoyanov, the dancing phenom, left an impression on us all which defies description. Jaime Choi (nee Beers), my sushi-eating pal, is a sweetheart through-and-through. David "Dubya" Ward has a presence unlike any other. Josh Vaughan is a good friend, a great scientist, and a man of boundless curiousity. Ben Paxton is a man after my own heart, and I value tremendously the times we've shared playing baseball and talking sports and life (go Red Sox!) Darius Torchinsky and I have spent many hours discussing politics and grad school, and I respect his thoughtfulness and perseverance. Eric Statz, to whom the torch is now passed with our recent graduations - how I'll miss the lunch time round table in the office! And finally, Thomas Feurer, a constant source of fresh ideas and insight, and one of the best scientists I have ever met.
So many others have come and gone in the Nelson group during my time, and made it such an enjoyable place to work, that I would be remiss if I failed to acknowledge them: Christ, Thomas, Efren, Kenji, Masashi, Cindy, Kathy, Ka-Lo, Emmanuel, Christoph, Gagan, Tina and Taeho - thank you all.
Outside the lab, I feel truly privileged to count among my good friends Jenny Yang (go Red Sox again!), Dave Lahr, Sean Hopkins, Steve Soares, Lynne Woodroofe, Oded Rabin and Scott Witonsky. Your friendship and support have added to my life in ways which I cannot adequately express.
I wish to acknowledge also the unfailing support of my mother, brother and sister-in-law, who, have always taken an interest in my work at MIT, and whose strength and love have made this journey so much more bearable.
Finally, I wish to thank Sandra, who I love dearly and who is closer to me than any other. This thesis, I dedicate to you...
Do notfollow where the path may lead.
Go instead where there is no path and leave a trail.
Ralph Waldo Emerson
Life's a journey, not a destination.
Table of Contents
A bstract . ... ...3
Acknowledgements ... 5
1. Introduction 31 2. Dual Echelon Single-Shot Ultrafast Spectroscopy 41 2.1 Amplified Titanium-Sapphire Laser System ... 41
2.2 The Dual Echelon Single-Shot Technique ... 47
2.3 Analysis of Single-Shot Images ... ... 57
2.4 Sources of Error in Single-Shot Measurements ... 72
2.4.1 Fabrication and Construction Imperfections ... 72
2.4.2 Sensitivity Limitations ... 74
2.4.3 Temporal Dispersion of Probe Pulses ... 79
2.4.4 Wavevector Mismatch ... 85
2.4.5 Diffraction by Optical Elements ... 87
3. Generation of Tunable Ultrashort Pulses 103 3.1 Wavelength Tuning by Parametric Amplification ... 103
3.2 Noncollinear Broadband Phase-Matching in an OPA ...107
3.3 Experimental Setup for a Noncollinear OPA ... 116
3.4 Results ... ... 12 5125... 3.5 Dual Beam Phase-Locked Single-Shot NOPA ... 137
3.6 Conclusion ... 144
4. Time-resolved Nonresonant Raman Scattering in Liquids and Solids 147 4.1 Classical Theory of Stimulated Raman Scattering ... 147
4.2 ISRS Measurements in Bismuth Germanate ... 158
4.3 Stimulated Raman Scattering in 3-Iodoanisole ... 169
4.4 Conclusion ... 180
5. Impulsive Absorption in Semimetals and Semiconductors 185 5.1 Introduction to Ultrafast Photoexcitation of Semimetals ... 186
5.2 Apparatus for Time-Resolved Reflectivity Experiments ... 192
5.4 Coherent Control of Semimetal Phonon Evolution ... 212
5.5 Long-Time Lattice Dynamics at High Pump Intensities ... 223
5.6 Ultrafast Phase Transition in Germanium Telluride ...243
5.7 Theory of Impulsive Absorption in Semimetals and Semiconductors ... 257
5.7.1 Classical Theory of Reflectivity ... 260
5.7.2 Microscopic Theory of Coherent Phonon Oscillations ... 268
5.7.3 Variation of Coherent Phonon Frequency ... 274
5.7.4 Intensity-Dependent Reflectivity and Carrier Relaxation ...279
5.7.5 Ultrafast Phase Transitions ... 282
5.8 Conclusion ... 286
6. Ultrafast Triiodide Photochemistry in Solution 293 6.1 Introduction to the Triiodide System ... 293
6.2 Transient Absorption Experimental Setup ... 300
6.3 Transient Absorption of Triiodide and Diiodide in Ethanol ... 301
6.4 Solvent-Dependent Reaction Dynamics ... 3....11
6.5 Viscosity-Dependent Reaction Dynamics ... 319
6.6 Triiodide in a Glass-Forming Liquid ... 325
6.7 Analysis of Vibrational Energy ... 337
6.8 Conclusion ... 355
7. Solid State Triiodide Photochemistry 361 7.1 Synthesis of Single Crystal Triiodide Samples ...363
7.1.1 Tetra-n-butylammonium Triiodide ... 365
7.1.2 Tetraphenylphosphonium Triiodide ... 367
7.1.3 Tetraethylammonium Triiodide ... 369
7.2 Transient Absorption of Solid-State Triiodides .. ...371
7.3 Molecular Dynamics Simulation of I3- Photodissociation ...380
7.4 Discussion of Results ... 397
7.5 Conclusion ... 405
List of Figures
2-1 The top panel illustrates spectral measurement of pulses from the Kerr-lens modelocked oscillator. The FWHM bandwidth is about 40 nm. The bottom panel shows the measurement of the intensity autocorrelation for the same pulses. Assuming a Gaussian envelope shape yields a FWHM duration of 72 fs ... 43 2-2 The top panel illustrates the spectral bandwidth of the amplified 10 Hz
pulse train. Each pulse has a FWHM bandwith of roughly 30 nm. In the bottom panel, the intensity autocorrelation trace for the amplified pulses has a FWHM duration of 85 fs, corresponding to a 55 fs pulse duration ...46 2-3 Schematic diagram of a transmissive echelon ... 51
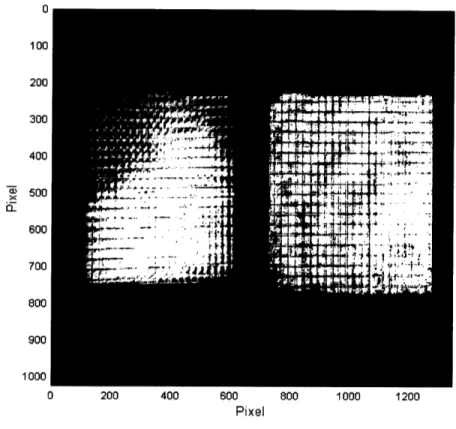
2-4 Crossed-echelon method for generating a time-structured probe pulse where temporal delay is mapped onto the spatial profile of the pulse. Only 25 independent delay steps are shown in the figure, but the actual echelons generate 400 individual steps .... ... 52 2-5 Schematic illustration of the dual echelon single-shot experiment ...53 2-6 CCI) image showing sample (left) and reference (right) beams. Both
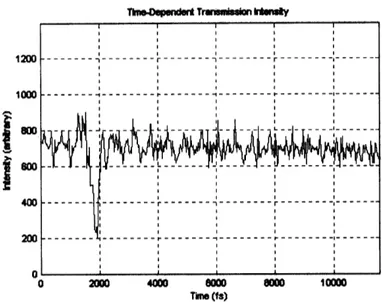
beams contain an image of the crossed echelons, but only the sample beam has passed through the material under investigation. The earliest time delay points are located in the top left corner of the sample image and the bottom right corner of the reference image. Traversing row-by-row down any column, successive delay increments are 25 fs. From column-to-column across any row, the delay increment is 500 fs. The total time window for the 20x20 2-D array of 400 delay points is 10 ps. The darkened area on the sample image corresponds to a reduction of transmitted light intensity due to the material response. Here, a 400 nm pump pulse induces a fast "electronic" time-dependent response. The modulation of 800 nm probe light over a time window of about 350 fs is due t:o hot-electron generation at the surface of the fused silica sample ... 56
2-7 Schematic of algorithm used to extract single-shot data from raw CCD images. Four processed echelon images are needed to reconstruct and correct the response function data: the sample image, the reference image, and the corresponding background images ... 59 2-8 Illustration of the procedure used to isolate the sample image from the raw
CCD image data. Raster-scanning in all four directions indicated along the vertical and horizontal scan lines locates the first non-zero-valued pixel on each edge of the image. The global maximum and minimum are taken to define the pixel area occupied by the sample image. The heavy white box in the figure represents the retrieved boundaries. Note that the thick white line in the center of the raw image is only a guide for the eye -there is no such division on the actual images. This procedure works in similar fashion for the reference image, which is then inverted ... 60
2-9 Numerical procedure for locating the divisions between echelon time points. In this most accurate method, each row and column of the image is raster-scanned to find the locations where the absolute intensity falls below a zero-threshold, and the spatial derivative of the intensity changes sign. In most cases, these conditions are sufficient to define the division
points ...
62
2-10 Application of window function to individual echelon time squares. In the left panel, the echelon divisions are located by raster-scanning individual rows and columns of the image, creating a 2-D grid pattern defining the spatial divisions between time points. In the right panel, the number of usable pixels in each square is further reduced via application of a window function which preferentially selects a certain fraction of the centermost pixels, typically 75%. The window boundaries for each square are
indicated by the rectangles drawn within each ... 64 2-11 Horizontal scan through row 500 of an echelon image. The usable
fraction of pixels is determined for each square by applying a window function centered on the midpoint of the intensity distribution for that
square
...
65
2-12 (Left) Image of echelon square (1,9). Note the higher intensity in the top left comer, due to edge diffraction. (Right) Image of square (1,3). Here, an edge imperfection results in the inclusion of many zero-valued pixels in the mean intensity summation. These effects can be removed either by iteratively adjusting the window function, which is computationally expensive, or by utilizing a smoothing function on selected troublesome echelon locations ... 67
2-13 Recovered mean signal intensities from the sample image of the data scan. No corrections to the single-shot data have been applied. Note that the strong t = 0 feature is clearly visible, but the prior and subsequent baseline is very noisy. The baseline noise contains an oscillatory component with period 500 fs, which matches the periodicity of the thin echelon. This feature is introduced systematically into the data by discontinuities in the mean signal intensities when moving from the bottom row of one echelon column to the top row of the next . ... ... ...69 2-14 Instrument response function for a single-shot experiment derived from
the reference image of the data scan. This response function contains sharp features due to anomalously large or small pixel intensities at particular spatial locations on the echelon image. These anomalous values introduce systematic error into the measurement; the instrument response function is used to correct the recovered data for such errors ... 70 2-15 Single-shot data after the instrument response function is applied to
remove baseline systematic noise. The data correction procedure is effective for low pump pulse intensities but becomes increasingly less effective at higher intensities ... 71 2-16 Defect regions in the cross-section view of the echelon matrix. Edge
imperfections are indicated by arrows and internal scattering centers are circled. Such noise sources are very difficult to compensate on account of the unpredictable nature of the transverse distribution of scattered probe light they produce ... ...73 2-17 Continuum generation in 1 mm crystal quartz. Pump pulses of 10 ,uJ and
50 fs at 800 nm are focused to a 150 im diameter spot on the front surface of the crystal. The resulting self-phase modulation due to the high pump intensity modifies the spectral properties of the pump pulse, generating frequency components over a very broad bandwidth ... 76 2-18 Temporal dispersion of probe pulses as a function of echelon delay. The
linear dispersion of the echelon glass broadens the temporal profile of the ultrashort probe pulses. The initial probe pulse has a FWHM duration of 31.5 fs, but is stretched to a duration of 49.6 fs at t = 9000 fs on the spatial echelon grid ... . ... .. ... 82 2-19 Temporal broadening of probe pulses at wavelengths of 500 nm (top) and
650 nm (bottom). The echelon glass exhibits normal dispersion, so pulse broadening is more severe at shorter wavelengths. The furthest delayed probe pulses at 500 nm may no longer satisfy the conditions for impulsive
2-20 Probe pulse phase delay induced by wavevector mismatch. The wavevector of most spatial regions of the probe beam (which correspond to probe delay times) deviates from the ideal forward-scattering direction. The effect of this mismatch is to introduce a phase delay contribution to the nominal arrival time at the focal plane for each spatial region ... 86
2-21 Echelon image aberration introduced by passage through the sample. Here the sample is a 200 ptm thick solution-grown molecular triiodide crystal. The left hand sample image results from a complex series of scattering events within the bulk crystal. In spite of the distortion, individual echelon time points remain defined with enough contrast such that extraction of numerical data is possible ... 88
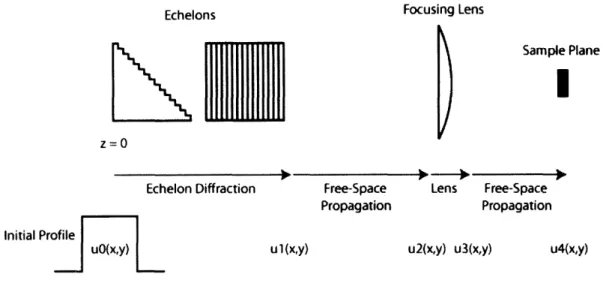
2-22 Schematic illustration of diffraction calculation for the single-shot setup. The initial beam profile is a square wave due to the 1" diameter aperture in the optical layout. The beam traverses four separate stages, each of which constitutes a propagation calculation: passage through the echelons, free-space evolution, lens passage, and free-free-space evolution to the sample ... 93 2-23 Probe beam intensity profiles at the sample position for a series of
wavelengths. The intensity distribution depends critically on the phase delay acquired via passage through the echelon. When the delay is an integer multiple of the wavelength, all interference is constructive and only a central peak is observed. However, when this condition is not satisfied, multiple diffraction peaks result, with positions and intensities dependent upon the relative sign of the phase shift ... 95 2-24 Calculation of probe beam spatial profile after scattering in the sample and
reconstruction by a collimating lens. The top panel shows the placement of the scattering defect. Lower panels show the calculation of the probe profile as a function of the displacement of the defect from the focal point ...98
3-1 Group velocity matching in a collinear optical parametric amplifier. On the left hand side, signal and idler pulses are time-coincident when they begin to interact. In a normally dispersive medium, the group velocity of the idler pulses is greater than the group velocity of the signal pulses, so that the two separate as they propagate through the material. On the right hand side, the pulses continue to interact but because of their separation, new idler photons are added to the trailing edge of the idler field, whereas new signal photons are added to the leading edge of the signal field. The result is temporal broadening of both pulses ... 108
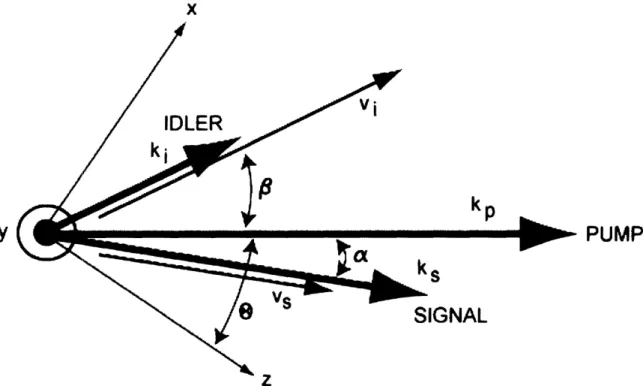
3-2 Phase-matching geometry for noncollinear three-wave mixing in BBO. Pumrp, signal and idler beams propagate in the x-z plane of the crystal. The thick arrows represent the wavevectors of the three beams and the thin vectors represent their group velocities ... 109
3-3 Phase-matching curves for type-I three-wave mixing in BBO. The phase-matched signal wavelength is plotted as the ordinate against the polar angle 0, for a series of noncollinear angles a. The shape of the curves changes from a reflexive "U" with an inflection to a monotonically-decreasing function of the polar angle as a increases. At a noncollinear angle of 3.7°, the curve is nearly vertical from 500-750 nm, suggesting the possibility of very broadband phase-matching with this geometry ...1 10 3-4 Group velocity matching in a noncollinear optical parametric amplifier.
The group velocities of signal and idler pulses are different, but the projection of the idler group velocity along the direction of the signal field is equal to the group velocity of the signal. As a result, the signal and idler pulses propagate together through the nonlinear medium. No pulse broadening results from temporal walkoff as in the case of collinear phase-matching. However, since the idler velocity contains a nonzero component normal to the signal propagation direction, the pulses walk off laterally from one another. As this occurs, new photons are added to both fields on the interior edges of each pulse. Both pulses emerge spatially wider, but unchanged temporally except for dispersion due to the medium....115
3-5 Schematic view of the single-shot noncollinear optical parametric amplifier. Single pulses gated out of the Ti:sapphire amplifier are divided and used to generate both pump and seed pulses for the parametric interaction. The center wavelength is controlled by adjusting the seed pulse delay line. Following amplification, OPA pulses are recompressed in a double-pass prism compressor with a deformable mirror retroreflector, providing fine control over the spectral phase ... 117
3-6 Parametric superfluorescence from a 1 mm BBO crystal pumped with individual 400 nm, 70 ,gJ pulses from a Ti:sapphire laser. The bright spot in the center is pump light exiting through the back surface of the crystal. The superfluorescence is emitted along a right-angled cone at an angle of 3.7° and corresponds to signal wavelengths in the range 500-750 nm. Another ring of larger circumference is also present but invisible in the figure; it corresponds to emission at idler wavelengths which all fall beyond the detection range of the camera. The above pattern is generated in a single-shot OPA ... ... 119
3-7 Continuum generation in sapphire. Focusing weak 0.5 ,J, 800 nm pulses in a 1.2 mm thick sapphire plate generates a broadband continuum. Self-focusing in the crystal leads to nonlinear self-phase modulation, which in turn modulates the optical phase of the driving field, generating new frequency components. The highly-structured shape of the spectrum is characteristic of this process ... ... 120
3-8a Spectra of pulses generated in a single-shot OPA. Wavelengths are tuned to 480 nm, 515 nm and 555 nm respectively ... 126 3-8b Spectra of pulses generated in a single-shot OPA. Wavelengths are tuned
to 630 nm, 670 nm and 710 nm respectively ... 127
3-9a Interferometric autocorrelation traces of NOPA pulses at wavelengths 480 nm, 515 nm and 555 nm ... 131
3-9b Interferometric autocorrelation traces of NOPA pulses at wavelengths 630 nm, 670 nm and 710 nm ... 132
3-10a Interferometric autocorrelation of compressed NOPA pulses at
wavelengths of 480 nm, 515 nm and 555 nm ... 135
3-10b Interferometric autocorrelation of compressed NOPA pulses at
wavelengths of 630 nm, 670 nm and 710 nm ... 136
3-11 Schematic illustration of the dual beam phase-locked single-shot NOPA. Two continuum generation stages are used to seed the OPA on both sides of the pump beam, producing two independently tunable ultrafast outputs. Since both beams traverse the same optical elements, the accumulated dispersion in each case is the same ... 138
3-12 (Top) NOPA operating with a single seed input. The bright center spot is the pump beam, and the beam on the left is the amplified signal beam. Note that it is located on the circumference of the superfluorescence ring. (Bottom) NOPA operating with two seed pulses, located on either side of the pump beam. The right-hand pulse is tuned to 550 nm and the pulse on the left has 720 nm center wavelength ... 141
3-13 Fringe patterns which result from interference between the two NOPA output beams. The large wavelength range over which this occurs implies phase-coherent output which spans the entire tuning range of the am plifier ... 143
4-1 Crystal structure of BGO reproduced from reference 17. Individual GeO4 tetrahedra are indicated by solid lines. Each Bi3 + is loosely coordinated to
three nearest-neighbor and three next-nearest-neighbor oxygen atoms ...159
4-2 HH and HV Raman spectra for BGO, reproduced from reference 41. Note that the HV spectrum is enhanced by a factor of 11 for visibility. A particularly intense Raman mode is located at 90 cm-' in the HH spectrum.... 160 4-3 Raw data scan recorded on the CCD camera for a 100 gpm thick sample of
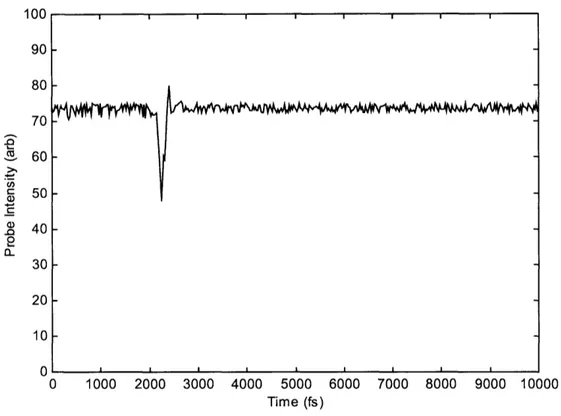
BGO pumped by an 820 nm, 50 fs single pulse and probed at 410 nm. A very strong initial response lasting about 225 fs is visible, but no further modulation of transmitted light intensity is apparent ... 162
4-4a Single-shot nonresonant Raman scattering measurements in BGO. A
strong vibrational signature appears after the initial modulation of transmitted light intensit near t = 0 and continues throughout the experimental time window. Two separate single-shot measurement results
are show n ... 164
4-4b Single-shot nonresonant Raman scattering measurements in BGO. A
strong vibrational signature appears after the initial modulation of transmitted light intensity near t = 0 and continues throughout the
experimental time window. Two separate single-shot measurement results, distinct from those on the previous page, are shown ... 165
4-5 (Top) Comparison of stimulated Raman scattering in BGO at three diffi:rent laser fluences. Larger amplitude vibrations result from more intense pump pulses. (Bottom) Maximum oscillation amplitude (proportional to signal amplitude) as a function of pump pulse intensity. The scaling is approximately linear, in accordance with the classical model of ISRS ... 166
4-6 Power spectrum of the time-resolved response of BGO. The 90 cm-' mode is easily recovered, although none of the weaker modes are visible ... 167
4-7 (Top) Schematic illustration of probe spectrum filtering in order to detect modulations in transmitted intensity resulting from coherent oscillations in the sample. (Bottom) Spectral filtering on opposite sides of the probe pulse central wavelength produces oppositely-phased oscillatory signals ...168
4-8 Chemical structure of 3-iodoanisole ... 170 4-9 Excitation of 3-iodoanisole at 800 nm by a single pump pulse at varying
intensities. Clockwise from top left: 6 J/cm2, 12 pJ/cm , 25 J/cm , 35
4-10 Single-shot response of 3-iodoanisole at an excitation intensity of 15 mJ/cm2. Oscillation amplitude is a maximum at roughly 400 fs and then rapidly decays away in 1.5 ps. The oscillatory signal returns again at later times and reaches a second local maximum at 2.3 ps ... 173
4-11 Power spectrum of the time-resolved response of 3-iodoanisole. There are two closely spaced modes apparent at 248 cm' and 264 cm'. The inset shows the CW Raman spectrum of both iodobenzene and 3-iodoanisole for com parison ... 174
5-1 Crystal structure of bismuth. Bismuth belongs to monoclinic space group C2/m with two of three unit cell angles equal to 90°. The solid lines in the
figure are provided as a guide to the eye ... 186
5-2 Crystal structure of antimony. The lattice structure is trigonal, with space group R3-mh. As before, the solid lines are included as a guide to visualize the symmetry of the lattice ... ... 188
5-3 Crystal structure of tellurium viewed along the z-axis. Tellurium atoms of the same shading lie in the same plane. The dark atoms lie below the plane of the paper and the white atoms lie above the paper plane. The lattice constant a characterizes the interhelical spacing, u represents the helix spacing, and the parameters r and R correspond to the nearest neighbor and next-nearest neighbor distances. The figure is adapted from reference 10 ... 189 5-4 Single-shot experimental apparatus for performing experiments in
reflectivity mode. Instead of imaging the echelon grid through the sample, the polished sample surface acts as a mirror. The reflected echelon image is collimated by a curved mirror and 20 cm f.l. lens combination and then reduced in size by a factor of four prior to being imaged onto the surface of a CCD camera. The reference arm of the apparatus remains unchanged from the transmission version of the experiment . ... 193
5-5 Generation of a multiple-pulse pump train. A single input pulse is split by a series of beamsplitters with R/T ratios of 1:3, 1:2 and 1:1 into four independently delayed replicas. A variable filter (VF) in each beam path permits amplitude attenuation of each beam. The four beams are recombined such that they traverse a common optical path to the sample, permitting multiple-pulse excitation of coherent responses ... 195
5-6a Time-dependent single-shot reflectivity of single crystal bismuth at 800 nm at a range of pump pulse intensities. Both the amplitude of the observed oscillations and the electronic background signal due to newly generated conduction band electrons increase with increasing pump fluence (indicated on each data trace). The data sweeps shown here all correspond to below-damage-threshold excitation ... 196
5-6b Time-dependent single-shot reflectivity of single crystal bismuth at 800 nm at a range of pump pulse intensities. Both the amplitude of the observed oscillations and the electronic background signal due to newly generated conduction band electrons increase with increasing pump fluence (indicated on each data trace). The 25.0 mJ/cm2 trace represents excitation at the bismuth single-shot damage threshold, although multi-shot structural damage may occur at lower fluences ... 197
5-7 Illustration of the origin of the cosine-like phase dependence of oscillations in bulk reflectivity due to impulsive absorption in bismuth. Absorption at the pump wavelength promotes valence electrons to the conduction band and effectively shifts the equilibrium lattice potential (grey curve, minimum ro) to a new, larger separation (black curve, minimum rp) on account of the reduced nuclear charge screening. Bismuth atoms experience increased mutual repulsion and motion is directed along coordinates which correspond to "breathing modes" of Al symmetry. A vibrational wave packet is created via this process, initially located at the inner turning point of the lattice potential. The packet evolves according to the specific shape of the black curve; however, since the initial position is one of maximum displacement from the equilibrium position, the oscillations have cosine-like phase character ... 199
5-8 Comparison of oscillations in bismuth reflectivity at four different pump pulse fluences. Near t = 0, the reflectivity oscillations are all in phase. On account of differing Ag phonon frequencies, the phase relationship changes as a function of time. After seven oscillation cycles, the responses at 2.0 mJ/cm2 and 4.0 mJ/cm2are 180°out of phase, whereas the response for 9.0 mJ/cm2 excitation is 180° out of phase with the 2.0 mJ/cm2 response after only three cycles ... 202 5-9a Variation of phonon frequency (top) and phonon amplitude (bottom) with
excitation intensity in single crystal bismuth. In both cases, the response scales almost linearly with pump intensity to roughly 6.0 mJ/cm2, and then a distinct plateau region occurs. The responses at very high intensities also follow a qualitative trend, but it is difficult to extract reliable parameters since there are few oscillations in the data ... 203
5-9b Variation of phonon dephasing time with excitation intensity in single crystal bismuth. As before, the response scales almost linearly with pump intensity to roughly 6.0 mJ/cm2, and then a distinct plateau region occurs. The high intensity points are determined semiquantitatively due to the small number of cycles in the experimental data ... 204
5-10a Time-resolved reflectivity of single crystal antimony measured in one
laser shot. The induced reflectivity change is positive for antimony, and results from impulsive absorption at the pump wavelength of 800 nm. The amplitude of the coherent oscillations increases with increasing pump intensity, and the phonon frequency shifts noticeably lower. The oscillation dephasing rate also appears to increase for more intense pump
pulses
...
206
5-10b Time-resolved reflectivity of single crystal antimony measured in one laser shot. The induced reflectivity change is positive for antimony, and results from impulsive absorption at the pump wavelength of 800 nm. The amplitude of the coherent oscillations increases with increasing pump intensity, and the phonon frequency shifts noticeably lower. The oscillation dephasing rate also appears to increase for more intense pump pulses. The dephasing rate changes dramatically for the last three scans which are in the region of antimony's single-shot damage threshold ... 207
5-lla Coherent phonon frequency and amplitude as a function of pump pulse intensity for single crystal antimony. In each case, the response scales linearly with intensity up to about 10.0 mJ/cm2, and then saturates ... 209
5-llb Coherent phonon dephasing time as a function of pump pulse intensity for single crystal antimony. The response scales linearly with intensity up to about 10.0 mJ/cm2, and then saturates ... 210 5-12 Oscillatory component of the time-dependent reflectivity of antimony.
The top panels show windowed Fourier transforms (normalized real part only) of the reflectivity signal for several pump intensities. At low intensity, the phonon peak is sharp. As the intensity increases, the phonon peak amplitude decreases and the peak width increases. The presence of only a few cycles at the highest fluences yields a nondescript spectrum. In the bottom panel, the early-time oscillations are compared as a function of laser intensity. A strongly intensity-dependent phonon frequency causes the measured responses to propagate in and out of phase with one another ... 211 5-13a Time-resolved single-shot reflectivity of single crystal tellurium. The
reflectivity increases on account of the excitation pulse. The oscillation frequency, amplitude and dephasing rate all scale with the pump pulse intensity, and dephasing is rapid in all cases ... 213
5-13b Time-resolved single-shot reflectivity of single crystal tellurium. The reflectivity increases on account of the excitation pulse. The oscillation frequency, amplitude and dephasing time all scale with the pump pulse intensity, and dephasing is rapid in all cases. The scan at 30.0 mJ/cm2 is above the single-shot damage threshold for Te, and the oscillatory component of the signal disappears in under two cycles ... 214
5-14a Variation of the coherent phonon frequency (top) and amplitude (bottom)
in tellurium. In each case, the response scales linearly with intensity up to 8.0 mJ/cm 2and then reaches a plateau ... 215
5-14b Variation of the coherent phonon dephasing time in tellurium. The dephasing time scales linearly with intensity up to 8.0 mJ/cm2 and then reaches a plateau ... ... 216
5-15 Single-shot data showing two-pulse excitation sequences in bismuth, with the second pulse arriving between the second and third (top) or fifth and sixth (bottom) vibrational cycles. When the second pulse arrives in phase, the oscillation amplitude is enhanced. Cancellation of the oscillations can be achieved when the arrival time of the second pulse is exactly one-half cycle out of phase, although intensity adjustment is necessary. Intermediate cases result in both amplitude and phase shifts ... 218 5-16 Single-shot measurements showing two-pulse excitation of single crystal
bismuth. Excitation pulses are 9.00 mJ/cm2 and the second pulse arrives either during the third or the sixth vibrational cycle. In-phase arrival times produce amplification as before, but clear saturation of the phonon amplitude is observed. At arrival times which are 180° out of phase, nearly complete cancellation of the coherent response is still possible with intensity adjustment of the second pulse. As before, at intermediate times, both the amplitude and phase of the coherence are modified ... 220
5-17 Single-shot data showing coherent two-pulse excitation of tellurium. Pump pulse intensities are 3.00 mJ/cm2 (top) and 7.00 mJ/cm2 (bottom). The maximum tellurium reflectivity change is roughly 1.6% so saturation effects are not as obvious. Amplification and cancellation of the coherent response are possible with suitably chosen pulse pairs ... 222
5-18a Two-pulse excitation of bismuth. The intensity of the first pulse is 9.0
mJ/cm2 (top) or 13.0 mJ/cm2 (bottom). The second interrogating pulse intensity is 6.0 mJ/cm2 in both instances, and arrives at a fixed delay, relative to the first pump pulse, of 3.0, 4.0, 5.0, 6.0 or 7.0 ps ... 225
5-18b Two-pulse excitation of bismuth. The intensity of the first pulse is 17.0
mJ/cm2 (top) or 21.0 mJ/cm2 (bottom). The second interrogating pulse intensity is 6.0 mJ/cm2 in both instances, and arrives at a fixed delay, relative to the first pump pulse, of 3.0, 4.0, 5.0, 6.0 or 7.0 ps ... 226
5-18c Two-pulse excitation of bismuth. The intensity of the first pulse is 28.0
mJ/cm2. The second interrogating pulse intensity is 6.0 mJ/cm2, and it arrives at a fixed delay, relative to the first pump pulse, of 3.0, 4.0, 5.0, 6.0 or 7.0 ps ... 227
5-19a Single-shot data showing the results of double-pulse excitation of bismuth
at very high intensities. The intensity of the second pump pulse is 3.0 mJ/cm2 in each case in order to ensure that the material response is not perturbed too strongly. The initial pump pulse intensities are 26.0 mJ/cm2 (top) and 30.0 mJ/cm2 (bottom) and the second pulse arrives after 3.0 ps (bottom scan in each panel) or 7.0 ps (top scan in each panel) ... 229
5-19b Single-shot data showing the results of double-pulse excitation of bismuth
at very high intensities. The intensity of the second pump pulse is 3.0 mJ/cm2 in each case in order to ensure that the material response is not perturbed too strongly. The initial pump pulse intensities are 34.0 mJ/cm2 (top) and 50.0 mJ/cm2 (bottom) and the second pulse arrives after 3.0 ps (bottom scan in each panel) or 7.0 ps (top scan in each panel) ... 230
5-20a Single-shot data showing long-time evolution probed by induced lattice
coherences in bismuth. The initial pump pulse intensity is 26.0 mJ/cm2 (top) and 30.0 mJ/cm2 (bottom), while the second pulse is maintained at 3.0 mJ/cm2. The delay times between the pump pulses are indicated on the right hand side of the data sweeps. Since the two pump pulses are separated by a delay greater than the total 10 ps window of the experiment, only the response due to the second pump can be captured in a single laser shot ... ... 232
5-20b Single-shot data showing long-time evolution probed by induced lattice
coherences in bismuth. The initial pump pulse intensity is 34.0 mJ/cm2 (top) and 40.0 mJ/cm2 (bottom), while the second pulse is maintained at 3.0 mJ/cm2. The delay times between the pump pulses are indicated on the right hand side of the data sweeps. Since the two pump pulses are separated by a delay greater than the total window of the experiment, only the response due to the second pump can be captured in a single laser shot....233
5-20c Single-shot data showing long-time evolution probed by induced lattice
coherences in bismuth. The initial pump pulse intensity is 50.0 mJ/cm2
and the second pulse is maintained at 3.0 mJ/cm2. The delay times
between the pump pulses are indicated on the right hand side of the data sweeps. Since the two pump pulses are separated by a delay greater than the total window of the experiment, only the response due to the second pump can be captured in a single laser shot ... 234
5-21a Single-shot impulsive absorption of tellurium with two excitation pulses.
The intensity of the first pump pulse is 9.0 mJ/cm2 (top) or 11.0 mJ/cm2
(bottom) and the second is 6.0 mJ/cm2. Relative delay times between the pulses are indicated to the right of each data sweep ... 236
5-21b Single-shot impulsive absorption of tellurium with two excitation pulses.
The intensity of the first pump pulse is 15.0 mJ/cm2 (top) or 19.0 mJ/cm2
(bottom) and the second is 6.0 mJ/cm2. Relative delay times between the
pulses are indicated to the right of each data sweep ... 237
5-21c Single-shot impulsive absorption of tellurium with two excitation pulses.
The intensity of the first pump pulse is 23.0 mJ/cm2 (top) or 27.0 mJ/cm2
(bottom) and the second is 6.0 mJ/cm2. Relative delay times between the pulses are indicated to the right of each data sweep ... 238
5-22a Single-shot data showing double-pulse excitation of tellurium for very
long inter-pulse delays (indicated at the right of each sweep). Excitation intensities are 19.0 mJ/cm2 (top) and 22.0 mJ/cm2 (bottom) ... 240
5-22b Single-shot data showing double-pulse excitation of tellurium for very
long inter-pulse delays (indicated at the right of each sweep). Excitation intensities are 28.0 mJ/cm2(top scan) and 34.0 mJ/cm2
(bottom scan) ...241
5-22c Single-shot data showing double-pulse excitation of tellurium for very
long inter-pulse delays (indicated at the right of each sweep). Excitation intensities are 40.0 mJ/cm2 (top scan) and 50.0 mJ/cm2 (bottom scan) ... 242
5-23 Schematic illustration of solid-solid phase transition in germanium telluride. The light spheres are Ge atoms, and the dark spheres are Te atoms. The low temperature structure has rhombohedral symmetry. At a critical temperature of 625 K, a lattice rearrangement occurs which corresponds closely to motion along the Alg optic phonon, resulting in the high temperature cubic phase of GeTe ... ... 245
5-24a Time-dependent reflectivity of GeTe measured in a single laser shot.
5-24b Expanded view of time-resolved reflectivity measurements for germanium telluride at various excitation intensities. As the pump pulse fluence increases from 8.0 mJ/cm2 to 11.0 mJ/cm2, the frequency of the Aig phonon decreases and the dephasing rate increases. At 20.0 and 24.0 mJ/cm2, the reflectivity falls very rapidly after the initial electronic contribution to the signal, and AR even changes sign for up to 3.5 ps ... 247
5-25 Variation of phonon frequency with excitation pulse intensity for
germanium telluride. At low fluences, the frequency appears to scale almost linearly with intensity, but no plateau region is observed as for the sem im etals ... ... 248
5-26a Two-pulse excitation of the Alg lattice mode in germanium telluride.
Amplification of the coherent response is achieved by adjusting the delays of pump pulses such that vibrational motion is driven in-phase. The damping rate increases strongly and the phonon frequency shifts lower as the pump intensity increases ... ... ... 251
5-26b Three-pulse excitation of the Alg lattice mode in germanium telluride.
Amplification of the coherent response is achieved by adjusting the delays of pump pulses such that vibrational motion is driven in-phase. The damping rate increases strongly and the phonon frequency shifts lower as the pump intensity increases ... 252
5-26c Four-pulse excitation of the Aig lattice mode in germanium telluride.
Amplification of the coherent response is achieved by adjusting the delays of pump pulses such that vibrational motion is driven in-phase. The damping rate increases strongly and the phonon frequency shifts lower as the pump intensity increases ... 253
5-27a Excitation of germanium telluride with three intense pump pulses and a
variably delayed weak fourth pump pulse. In the top panel, three pulses of intensity 4.0 mJ/cm2 are used and in the bottom panel, three 8.0 mJ/cm2 pulses are employed. The fourth pulse is maintained at 5.0 mJ/cm2 in all cases. The delay time (relative to t = 0) of the fourth pulse is indicated to the right of each data sweep ... 255
5-27b Excitation of germanium telluride with three intense pump pulses of 12.0
mJ/cm2 and a variably delayed weak fourth pump pulse of intensity 5.0 mJ/cm2. The delay time (relative to t = 0) of the fourth pulse is indicated to the right of each data sweep ... 256
5-28a Long-time evolution of the coherent response in germanium telluride. A
single excitation pulse of intensity 12.0 mJ/cm (top) or 20.0 mJ/cm2 (bottom) arrives at time zero. A second much weaker interrogating pulse
(5.0 mJ/cm2) arrives after a delay indicated to the right of each trace. The probe window is adjusted such that the second pump pulse dynamics are
captured ... ... ... 2582...
5-28b Long-time evolution of the coherent response in germanium telluride.
Three excitation pulses of intensity 8.0 mJ/cm2 (top) or 12.0 mJ/cm2 (bottom) arrive in-phase to drive the Al phonon mode. A second much weaker interrogating pulse (5.0 mJ/cm2) arrives after a delay indicated to the right of each trace. The probe window is adjusted such that the second pump pulse dynamics are captured ... 259
5-28c Long-time evolution of the coherent response in germanium telluride.
Three excitation pulses of intensity 16.0 mJ/cm2 arrive in-phase to drive the Al phonon mode. A second much weaker interrogating pulse (5.0 mJ/cm2) arrives after a delay indicated to the right of each trace. The probe window is adjusted such that the second pump pulse dynamics are
captured
...
260
5-29 Variation of phonon frequency with carrier density for single- anddouble-pump excitation of bismuth ... 277
6-1 Absorption spectrum of triiodide ion in ethanol. Inset: Diiodide absorption spectrum in ethanol from reference 65 ... 296
6-2 Gas-phase energy levels of triiodide, diiodide and iodine relevant to our experiments. Absorption from the ground state of triiodide into the high energy excited state band leads to photodissociation, yielding diiodide and atomic iodine in one of two spin states. Absorption by the nascent diiodide ion leads to further dissociation, giving iodide ion and an iodine atom ... ... .... 298
6-3a Single-shot transient absorption scans for triiodide in ethanol solution. The probe pulse wavelength is indicated on the right hand side of each trace. The wavelengths represented here probe the blue edge of the ground state diiodide absorption band, which is centered at 740 nm ...302 6-3b Single-shot transient absorption scans for triiodide in ethanol solution.
The probe pulse wavelength is indicated on the right hand side of each trace. The wavelengths represented here probe the red edge of the ground state diiodide absorption band, which is centered at 740 nm ... 303
6-3c Transient absorption scan for triiodide in ethanol solution. The photolysis and probe pulses are both 300 nm, so the observed transient absorption dynamics are due to residual ground state triiodide ions ... 304
6-4 Wavepacket dynamics of triiodide and diiodide following interaction with a photolysis pulse at 300 nm. Wavelength-dependent probing in the visible and near-IR interrogates I2- at particular locations along the molecular coordinate. Due to the coherent nature of diiodide oscillations, opposite-phase behavior is observed on opposite sides of the absorption m axim um ... 306
6-5 Comparison of the oscillatory component of transient absorption signals at 660 nm and 780 nm. The oscillations show opposite phases, reflecting the average location of the molecular wavepacket along the I-I vibrational
coordinate
...
308
6-6 Diiodide absorption band narrowing in ethanol. Gaussian fits to transient absorption data at multiple wavelengths are shown at intervals of 1500,
3000, 5000 and 7000 fs following the initial photolysis pulse. The reduced width of the 740 nm absorption line at later times is clearly
evident ... ... ... 310
6-7a Transient absorption scans of photolyzed triiodide ion in a series of solvents (indicated at right). Probe wavelengths are 660 nm (top) and 700
nm (bottom
) ...
312
6-7b Transient absorption scans of photolyzed triiodide ion in a series ofsolvents (indicated at right). Probe wavelengths are 780 nm (top) and 820
nm (bottom
) ...
313
6-7c Expanded view of transient absorption of photolyzed triiodide ion at aprobe wavelength of 660 nm. The solvent is indicated to the right of each
data sweep ...
... 314
6-8a Temperature dependence of the viscosity of ethylene glycol ... 319
6-8b Dielectric spectra of ethylene glycol at various temperatures reproduced from data in references 92 and 93 ... 320
6-9 Temperature-dependent transient absorption measurements for triiodide in ethylene glycol. Probe wavelengths are 700 nm (top) and 800 nm (bottom ) ... ... 322
6-10 Structure of cresolphthalein dimethylether, a glass-forming liquid used as a solvent in the photodissociation reaction of triiodide ions ... 325
6-11 Position of the triiodide absorption maximum as a function of temperature ....326
6-12a Single-shot transient absorption of diiodide ion at 660 nm in a solution of
cresolphthalein dimethylether as a function of temperature (indicated to the right of each scan). Data sweeps which are shown in grey (310 K, 307 K and 303 K) correspond to solutions at or below the glass transition
temperature for CDE ... 327... 327
6-12b Single-shot transient absorption of diiodide ion at 700 nm in a solution of
cresolphthalein dimethylether as a function of temperature (indicated to the right of each scan). Data sweeps which are shown in grey (310 K, 307 K and 303 K) correspond to solutions at or below the glass transition temperature for CDE ... 328
6-12c Single-shot transient absorption of triiodide ion at 300 nm in a solution of
cresolphthalein dimethylether as a function of temperature (indicated to the right of each scan). Data sweeps which are shown in grey (310 K, 307 K and 303 K) correspond to solutions at or below the glass transition temperature for CDE ... 329
6-13 Fitting examples for transient absorption of triiodide and diiodide ions in CDE solution at 310 K ... 334
6-14a Time-dependent I2- absorption profiles at 363 K and 318 K in CDE
solution
...
...
... ...
...
...
..339
3...
6-14b Time-dependent I2- absorption profiles at 310 K in CDE solution ...340 6-15a Calculated absorption profiles and vibrational distributions at four
different time delays for I2- in CDE solution at 363 K ... 342
6-15b Calculated absorption profiles and vibrational distributions at four
different time delays for I2- in CDE solution at 318 K ... 343 6-15c Calculated absorption profiles and vibrational distributions at four
different time delays for I2- in CDE solution at 310 K ... 344
6-16a Diiodide excess vibrational energy as a function of time, calculated from
instantaneous absorption spectra as demonstrated previously. Data are shown for 363 K and 318 K. In each case, the dissipation of excess energy follows single-exponential kinetics, with time constants of 3.6 ps and 4.1 ps, respectively ... 350
6-16b Diiodide excess vibrational energy as a function of time, calculated from
instantaneous absorption spectra as demonstrated previously. Data are shown for 310 K. The dissipation of excess energy follows single-exponential kinetics, with a time constant of 4.4 ps ... 351 6-17 Single exponential fit of the fast decay component of 13- absorption in
ethanol. The data corresponds to temperature 310 K (top), 318 K (middle) and 363 K (bottom) ... ... 353
7-1 Crystal structure of tetra-n-butyl ammonium triiodide viewed along the a axis. The large, darkly shaded spheres are iodine atoms (as triiodide ions) arranged in two crystallographically independent, nearly linear chains. The smaller white spheres are the carbon and nitrogen atoms comprising the tetra-n-butylammonium counterions. The counterions are arranged in
a network-like geometry, separating the triiodide chains ... 366 7-2 Expanded view of tetra-n-butylammonium cation and the triiodide ion,
indicating the relative orientation of each within the triclinic crystal structure ... ... 367 7-3 Unit cell for tetraphenylphosphonium triiodide. There are two triiodide
ions per cell and each sits in a "pocket" formed by seven neighboring tetraphenylphosphonium cations. The overall structure is monoclinic ...368 7-4 Enlarged view of tetraphenylphosphonium and triiodide ions within the
crystal structure ... 369 7-5 View of tetraethylammonium triiodide along the b axis, adapted from
reference 3. Triiodide ions are located at the comers of the orthorhombic unit cell. Open circles are iodine atoms, with the heavy circles in the plane of the page and the lighter circles behind the plane. The triiodide ions form stacked arrays with columns of tetraethylammonium cations acting as spacers ... 370 7-6 Single-shot transient absorption of photogenerated diiodide ions in the
photodissociation of tetra-n-butylammonium triiodide. The photolysis wavelength is 300 nm and the probe wavelength, indicated to the right of each data sweep, is adjusted to monitor wave packet dynamics of the diiodide ions in various geometries. Single-shot damage in the crystal is observed by visual inspection, so each scan is recorded after translating an optimizing the orientation of the sample under very low illumination intensity ... ... 372
7-7 Comparison of single-shot transient absorption signals for photogenerated diiodide ion in tetra-n-butylammonium triiodide single crystals. Sweeps at 600 and 880 nm each display contributions from coherent motion of the
12-fragment, although these are almost exactly out of phase since the two wavelengths probe opposite sides of the diiodide ground state potential energy surface. The oscillation frequency is roughly 105 cm'l which
corresponds well with the gas phase value for diiodide ion ... 374
7-8 Single-shot transient absorption of diiodide ions following photolysis at 300 nm of tetraphenylphosphonium triiodide single crystals. The probe wavelength is indicated to the right of each data sweep. Coherent contributions to the TA signal are observed when probing near the edges of the diiodide absorption band, and reflect time-dependent motion of the
diiodide wave packet ... 376
7-9 Short-time evolution of transient absorption signals at probe wavelengths of 600 and 880 nm for photogenerated diiodide ions in tetraphenylphosphonium triiodide. Coherent oscillations due to diiodide vibrational motion are clearly observed and are anti-phased when measured on opposite sides of the absorption band center ... 377
7-10 Single-shot transient absorption of diiodide ions generated in the photolysis of tetraethylammonium triiodide single crystals. The probe wavelength is indicated to the right of each data sweep. As in the TA profiles for the other crystals employed in these experiments, an oscillatory contribution to the absorption signal is visible at wavelengths near the diiodide absorption band edge ... 379
7-11 Simulated transient absorption spectrogram for the diiodide ions in the photodissociation of crystalline tetra-n-butylammonium triiodide. The signal shows oscillatory behavior as the diiodide wave packet propagates along its ground state electronic surface ... 391
7-12 Nine randomly selected classical diiodide trajectories from the
photodissociation simulation for tetra-n-butylammonium triiodide, illustrating varied contributions to the overall transient absorption signal which result from different initial states ... 392
7-13 Simulated transient absorption spectrogram for crystalline
tetraphenylphosphonium triiodide. Several coherent oscillation cycles are visible after the diiodide ions are born between 300-350 fs, and these gradually dephase, accompanied by incoherent relaxation of excess vibrational energy which produces the absorption band narrowing at later
7-14 Simulated transient absorption spectrogram for the dissociation of crystalline tetraethylammonium triiodide. The initial signal is similar to the results for other solid-state triiodides, with coherent wave packet motion observed for about three cycles. The absorption signal decays rapidly starting at about 1400 fs ... 395 7-15 Fifteen randomly-selected trajectories from the Gaussian swarm used to
simulate the tetraethylammonium triiodide transient absorption
spectrogram
...
396
7-16a Measured (black) and calculated (grey) transient absorption profiles for
diiodide ions generated in the photodissociation of crystalline tetra-n-butylammonium triiodide. Probe wavelengths are 600 nm (top) and 740
nm (bottom
) ...
398
7-16b Measured (black) and calculated (grey) transient absorption profiles for
diiodide ions generated in the photodissociation of crystalline tetra-n-butylammonium triiodide. The probe wavelength is 880 nm ...399
7-17a Simulated (grey) and measured (black) transient absorption profiles at a
probe wavelengths of 600 nm and 740 nm for the photodissociation of crystalline tetraphenylphosphonium triiodide ... 401
7-17b Simulated (grey) and measured (black) transient absorption profiles at a
probe wavelength of 880 nm for the photodissociation of crystalline tetraphenylphosphonium triiodide ... 402
7-18a Calculated (grey) and measured (black) transient absorption profiles for
diiodide ion generated in the photodissociation of crystalline tetraethylammonium triiodide. The probe wavelengths are 660 nm and 740 nm ... 403
7-18b Calculated (grey) and measured (black) transient absorption profiles for
diiodide ion generated in the photodissociation of crystalline tetraethylammonium triiodide. The probe wavelength is 820 nm ... 404
List of Tables
3-1 Spectral bandwidths for pulses generated in the single-shot OPA ... 128
3-2 Pre-compression duration and time-bandwidth product for NOPA pulses ...133
3-3 Temporal duration and time-bandwidth product for compressed NOPA
pulses
...
137
4-1 Modes in HH polarized Raman spectrum of BGO, reproduced from reference 41. Symbols used are: vvw = very, very weak; m = medium; w
= weak; vvs = very, very strong ... 161
161...
5-1 Material properties from analysis of impulsive absorption measurements ...267
6-1 Fitting parameters for temperature-dependent transient absorption of diiodide ion in fluid and glassy CDE solution at 660 nm ... 335 6-2 Fitting parameters for temperature-dependent transient absorption of
Chapter
1
Introduction
The microscopic world is "alive" with motion - in the form of individual atoms, and groups of atoms, which move in random fashion. Substances which are chemically inert under a given set of conditions are comprised of atoms whose kinetic energy is insufficient to overcome the strong forces which bind the atoms and as such, remain chemically unchanged under normal circumstances. The motions which occur for atoms in stable chemical environments, in the absence of a strong perturbation, consist of small displacements about an equilibrium multidimensional configuration which represents a local energy minimum, balancing the Coulombic repulsions among electrons and among nuclei, and the attractions between electrons and nuclei.
However, it is evident that the "business" of chemical and/or physical change involves the rearrangement of atoms into a new minimum local energy configuration, usually in response to the application of a driving force which supplants a barrier in the complex energetic landscape and thereby facilitates the change. This is where the excitement lies, because the driving force is often under the control of the experimentalist. By judicious manipulation of this force, which can be chemical (reagents, catalysts) or physical (temperature, pressure, radiation, etc.), both the structural identity of the product(s) and the kinetics of the change can often be manipulated.
In this thesis, we will be concerned with the nature and dynamics of structural rearrangements in liquids and solids. The driving force for these rearrangements is a high-amplitude transient electric field due to one or more laser pulses, which couples very strongly to valence electrons. Atomic nuclei move in response to the large perturbations induced in the local distribution of electrons. The unique aspect of
inducing structural change in this manner is that atomic motions occur collectively - that is, atoms move in unison to their new equilibrium positions. Such motions typically occur on the timescale of bond vibration frequencies, from a few tens to a few hundreds
of femtoseconds (1 fs = 1 x 10- 15 s).
Given the rapidity with which physical and chemical change occurs, it is evident that in order to properly capture the dynamical evolution of atomic motion it is necessary to perform measurements with extremely high temporal fidelity. This effectively implies that the kind of collective change investigated herein is best captured by analyzing the interactions between the material in question and a series of well-characterized ultrashort pulses of light. The suitability of optical pulses derives from the fact that it is now possible to routinely generate, by means of solid-state lasers, pulses with durations less than 10 fs. Because the theory of light-matter interactions is well established, we can extract from optical measurements the microscopic details of chemical and physical change.
Most time-resolved spectroscopy involves more-or-less exotic variations of the pump-probe technique. In such experiments, one or more "pump" pulses are used to induce a material response by any one of a number of possible physical mechanisms, and then a much weaker "probe" pulse is used to interrogate the induced response. In the
simplest variant of the technique, a single pump pulse is employed, followed by a single probe pulse separated in time from the pump by a well-characterized interval. The measured perturbation of the electric field of the probe pulse is due to time-evolving
sample response to the pump. One measurement of this type characterizes the sample at a particular point in time (relative to the pump-defined zero of time). Generally, such experiments are repeated in sequence, each time changing the delay between pump and probe to interrogate the sample at a different relative interval, and ensuring that the sample returns to equilibrium before another pump-probe pulse pair is applied.
The pump-probe method is robust and has enjoyed remarkably widespread application to the study of a great variety of materials, and in a great number of increasingly sophisticated incarnations. However, on account of the need for the sample to return to its original equilibrium state between pump-probe sequences, it is imperative that no permanent change in structure occur or that the irradiated sample be replenished in between repetitions of the measurement. Practically, this limits the use of pump-probe techniques to the study of reversible responses in most solids. In order to induce and measure truly irreversible chemical and physical change, it is necessary to manipulate the sample between pump-probe sequence shots. For solids, this is usually accomplished by translating the sample in a plane perpendicular to the direction of pulse propagation. For liquid samples, which are almost exclusively homogeneous, flow cells are most commonly employed to refresh the volume of material being investigated between shots. Either of these approaches works well if the materials under consideration are available as large samples of good optical quality. Unfortunately, many interesting and highly reactive species, which would otherwise be quite worthy of study, are difficult to obtain
either in quantity or in good quality. The solution to this problem is to develop a new ultrafast pump-probe technique which allows us to capture all of the time-dependent dynamical information in a single laser shot. In this way, only a single spot of good quality on a single sample is necessary in order to conduct the experiment.
The first part of this thesis will focus on the introduction of a dual echelon single-shot pump-probe technique which was designed to circumvent the difficulties outlined above. As the details of the technique have been previously described [1,2], the discussion will center upon the general applicability of the technique and its inherent limitations and systematic errors. Further, more detailed attention will be given to the development of numerical techniques to extract information from the raw image data which the experiment generates, since standard pump-probe data are captured in an entirely different fashion.
As mentioned, collective irreversible structural change is the very nature of chemistry, and there are a large number of candidate systems for investigation which are important for both fundamental and practical reasons. We have chosen materials for study on the basis of their varied responses to optical excitation, and indeed for the increasingly dramatic structural modifications which result. For solid-state irreversible chemical reactions, we have sought a family of crystalline solids in which the elementary chemistry is similar but the local and collective structural constraints are varied, so that the effects of such constraints on reaction dynamics and results may be studied. For solid-state structural change, we have examined systems in which high-intensity electronic excitation may yield either new solid or liquid phases, and examined the responses to differing excitation intensities and waveforms.