Detection of counterfeit Viagra
®by Raman Microspectroscopy
imaging and multivariate analysis.
Pierre-Yves Sacréa,c#, Eric Deconincka#, Lien Saerensb, Thomas De Beerb, Patricia Coursellea, Roy Vancauwenberghed, Patrice Chiapc, Jacques Crommenc, Jacques O. De
Beera,*
a
Laboratory of Drug Analysis, Scientific Institute of Public Health, Brussels, Belgium
b
Laboratory of Pharmaceutical Process Analytical Technology, Ghent University, Ghent, Belgium.
c
Department of Analytical Pharmaceutical Chemistry, Institute of Pharmacy, University of Liege, Liege, Belgium.
d
Federal Agency for Medicines and Health Products, Brussels, Belgium
Abstract
During the past years, pharmaceutical counterfeiting was mainly a problem of developing countries with weak enforcement and inspection programs. However, Europe and North America are more and more confronted with the counterfeiting problem. During this study, 26 counterfeits and imitations of Viagra® tablets and 8 genuine tablets of Viagra® were analysed by Raman microspectroscopy imaging.
After unfolding the data, three maps are combined per sample and a first PCA is realised on these data. Then, the first principal components of each sample are assembled. The exploratory and classification analysis are performed on that matrix.
PCA was applied as exploratory analysis tool on different spectral ranges to detect counterfeit medicines based on the full spectra (200-1800 cm-1), the presence of lactose (830-880 cm-1) and the spatial distribution of sildenafil (1200-1290 cm-1) inside the tablet. After the exploratory analysis, three different classification algorithms were applied on the full spectra dataset: linear discriminant analysis, k-nearest neighbour and soft independent modelling of class analogy.
PCA analysis of the 830-880cm-1 spectral region discriminated genuine samples while the multivariate analysis of the spectral region between 1200-1290 cm-1 returns no satisfactory results.
A good discrimination of genuine samples was obtained with multivariate analysis of the full spectra region (200-1800 cm-1). Application of the k-NN and SIMCA algorithm returned 100% correct classification during both internal and external validation.
Keywords:
Raman Microspectroscopy, counterfeit medicines, PCA, discrimination, chemical imaging
#
These authors contributed equally to this work.
*Corresponding Author. Tel.: +32 2 642 51 70; Fax: +32 2 642 53 27 E-mail address: jacques.debeer@wiv-isp.be
Introduction
During the past years, pharmaceutical counterfeiting was mainly a problem of developing countries with weak enforcement and inspection programs. Asia and Latin America are the most contaminated geographical regions. However, Europe and North America are more and more confronted to the counterfeiting problem. [1]
Recently, the Belgian Federal Agency for Medicines and Health Products (AFMPS/FAGG) participated in PANGEA III, an international operation fighting against the online sale of counterfeit and illegal medicines [2]. The most encountered therapeutic categories in Belgium were weight-loss drugs and potency enhancing drugs such as Viagra® (Pfizer). Since its approval by the American Food and Drug Agency (FDA) [3] and the European Medicines Agency (EMA) [4] in 1998, Viagra® has become one of the most counterfeited medicines in industrialized countries. Several spectroscopic techniques have been used to detect counterfeit Viagra®. Rodomonte et al. used colorimetry to detect counterfeit medicines based on their differences of tablets and second packaging colour [5]. Vredenbregt et al. applied NIR spectroscopy on 103 samples to detect counterfeit Viagra® but also to check the homogeneity of batches and screen the presence of sildenafil citrate [6]. De Veij et al. showed for the first time that Raman spectroscopy was able to detect counterfeit Viagra® [7]. However this study compared 18 illegal samples to only one genuine tablet. Our group concluded that the combination of IR and NIR spectroscopy was more powerful than FT-IR, NIR or Raman spectroscopy alone to discriminate genuine from illegal Viagra® samples [8]. X-ray powder diffraction [9], NMR (1H, 13C, 15N) [10], and NMR (2D DOSY, 3D DOSY-COSY, 1H NMR) [11] were also used to detect counterfeit Viagra®. However, compared to the first cited techniques, X-ray diffraction and NMR necessitate a more elaborated sample preparation and are therefore only performed by well trained analysts.
Chemical imaging is a powerful tool since it provides physico-chemical information and spatial information of the sample. Raman microspectroscopy imaging is widely used in the biomedical field. Among others, it has been recently used to predict the cellular response to cisplatin in lung adenocarcinoma [12] and to study the molecular interactions between zoledronic acid and bone [13]. It is also used in the pharmaceutical field since it necessitates a negligible sample preparation (e.g. for tablet analysis, sample preparation is only cutting tablets in two). It has been mostly used in pharmaceutical technology applications [14-17]. Near infrared chemical imaging (NIR-CI) has also been used in the field of pharmaceutical technology [18-21]. More recently, NIR-CI has been used by Lopes et al. to detect and classify counterfeit antiviral drugs [22] and to determine their chemical composition [23]. Puchert et al. successfully used NIR-CI to detect counterfeit bisoprolol tablets [24].
During this study, 26 counterfeits and imitations of Viagra® tablets and 8 genuine tablets of Viagra® were analysed by Raman microspectroscopy imaging. After an exploratory PCA analysis, linear discriminant analysis (LDA), k-nearest neighbours (k-NN) and soft independent modelling by class analogy (SIMCA) were applied on the full spectra dataset, as classification algorithms. Other spectral ranges were also investigated to detect counterfeit medicines based on the presence of lactose and the spatial distribution of sildenafil inside the tablet. The aim of this study was to discriminate illegal samples and to evaluate which of the three applied classification algorithm was the best suited for purpose. As far as we know, this is the first time that Raman microspectroscopy imaging is used to detect counterfeit medicines.
1. Theory
1.1. Principal component analysis
PCA is a variable reduction technique, which reduces the number of variables by making linear combinations of the original variables. These combinations are called the principal components and are defined in such way that they explain the highest (remaining) variability in the data and are by definition orthogonal.
The importance of the original variables in the definition of a principal component is represented by its loading and the projections of the objects on to the principal components are called the scores of the objects [25].
1.2. Selection of a test set for external validation.
In order to perform an external validation of the classification models, matrix B was split into a training and a test set applying the Kennard and Stone algorithm [25, 26]. Kennard and Stone algorithm is a uniform mapping algorithm that consists of maximizing the minimal Euclidian distance between each selected point and all the other. In this study, the selection of the objects started with the furthest object from the mean point using the Euclidian distance. The second chosen object i0 is the furthest point from the previous one, i:
)) min( ( max 0 0 ,i i i i selected d d =
where dselected is the Euclidian distance between the new selected point i0 and the previously
Then, all the other objects are selected the same way until the selected number of objects of the training set is reached. The remaining objects are included in the test set.
1.3. Linear Discriminant Analysis (LDA)
Linear discriminant analysis [27,28] is a feature reduction method just like PCA. But when PCA selects a direction which maximises the variance of the data, LDA selects the direction that maximises the between-class variance and so discriminate the given classes. The latent variable obtained is a linear combination of the original variables and is called canonical variate. For k classes, k-1 canonical variates are determined. To maximize the discriminating power, the algorithm selects a linear function of the variables, D, that maximizes the ratio between the between-class variance and the within-class variance.
1.4. k-Nearest Neighbour (k-NN)
The k-NN algorithm [27] was applied on the training set. The algorithm computes the minimal Euclidian distances between an unknown object and each of the objects of the training set. For a training set of n samples, n distances are calculated. Then it selects the k nearest objects (here k is set at 3) to the unknown one. The unknown object is classified in the group to which the majority of the k objects belong. The main advantages of this method are its mathematical simplicity and the fact that it is free from statistical assumptions.
1.5. Soft Independent Modelling by Class Analogy (SIMCA)
SIMCA [27] is not a discriminating algorithm but a classifying algorithm since it decides whether a new object belongs to a certain class or not. If the object doesn’t belong to a class, it is considered as an outlier while with LDA and k-NN it is always classified.
The algorithm also defines latent variables and uses them to classify the objects.
First of all, the algorithm determines the number of eigenvectors needed to describe the training class by applying cross-validation. Then a critical value of the Euclidian distance towards the model, scrit, is defined. Along each eigenvector score limits are defined as:
t K
s
t
t
max=
max(
)
+
0
.
5
t Ks
t
t
min=
min(
)
−
0
.
5
where max(tK) is the largest score of the training objects of the studied class on the
Objects with an Euclidian distance s < scrit and scores tmin < t < tmax are said to belong to the
studied class otherwise they are considered as outliers.
In fact all of the classes are modelled separately and test objects are predicted as belonging or not to the studied class. Afterwards the different models can be assembled. In this case, a test object will be predicted as belonging to the nearest class.
2. Experimental
2.1. Samples
2.1.1. Illegal samples
A total of 26 counterfeit and imitation tablets of Viagra® were donated by the Federal Agency for Medicines and Health Products in Belgium (AFMPS/FAGG). They all come from postal packs ordered by individuals through internet sites. All samples were delivered in blisters or closed jars with or without packaging. All samples, once received, were stored at ambient temperature and protected from light.
2.1.2. Reference samples
Pfizer SA/NV (Belgium) kindly provided one batch of each different dosage of Viagra® (25 mg, 50 mg, 100 mg). Two other batches of each dosage were purchased in a local pharmacy in Belgium. A total of 8 references (3 different batches of 100 mg, 3 different batches of 50 mg and 2 different batches of 25 mg) were used in this study.
All references were delivered in closed blisters with packaging and were stored protected from light at ambient temperature.
2.2. Raman Microspectroscopy measurements
Each tablet was radially and sharply cut into two parts. Each part was made as smooth as possible to avoid spectral intensity differences due to differences in sample to probe distance. and a 1700 µm x 1300 µm area of the fracture plane was scanned by a 10x long working distance objective lens (spot size laser = 50 µm) in point-by-point mapping mode with a step size of 100 µm in both the x and y directions (= 221 points per mapping).
The image system was a RamanRxn 1 Microprobe (Kaiser Optical Systems, Ann Arbor, USA), equipped with an air-cooled CCD detector (back-illuminated deep depletion design). The laser wavelength during the experiments was the 785 nm line from a 785 nm Invictus NIR diode laser. All spectra were recorded at a resolution of 4 cm-1 using a laser power of 400 mW and a laser light exposure time of 30 sec per collected spectrum. Data collection was done using HoloGRAMSTM (Kaiser Optical Systems, version 2.3.5) data collection software, HoloMAPTM (Kaiser Optical Systems, version 2.3.5) data analysis software and Matlab software (The Matworks, version 7.7).
Three maps were taken at different positions of the core of the tablet.
2.3. Data analysis
All data treatments were realized with Matlab (The Matworks, Natick, MA, USA, version 7.9.0). SIMCA analysis was performed using the PLS_toolbox (Eigenvector Research, Inc., Wenatchee, WA, USA, version 6.0.1).
2.3.1. Data pre-processing
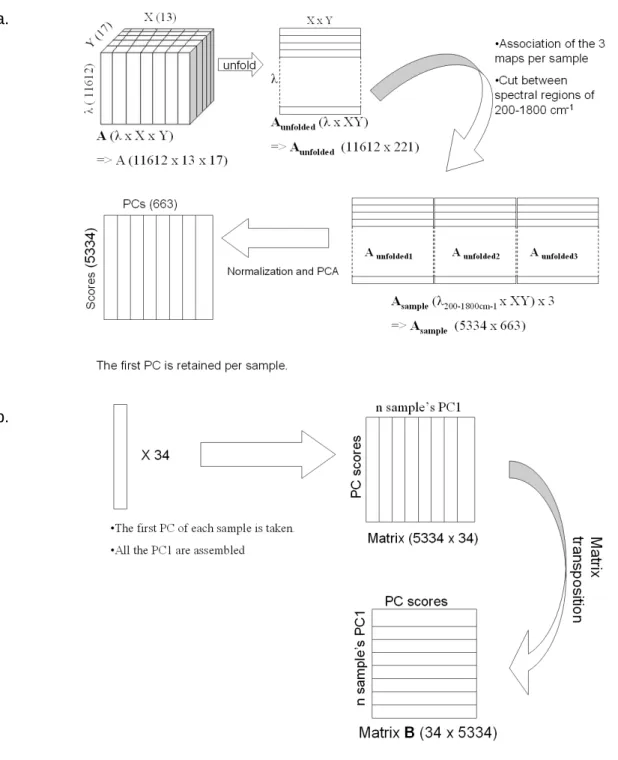
Each Raman microspectroscopic map is a spectral hypercube (Figure 1a). For a map A, X and Y represent the spatial information and λ the spectral information. First of all, an unfolding step is imperative to convert a three dimensional dataset A (λ x X x Y) in a two dimensional exploitable dataset Aunfolded (λ x XY). Thus, starting from the matrix A (11612 x
13 x 17) matrix, the matrix Aunfolded (11612 x 221) is obtained after unfolding.
Once each map has been unfolded, the three maps of a same sample are associated and only the spectral region between 200-1800 cm-1 is kept (representing 5334 recorded intensities). The resulting Asample matrix is normalized, a principal component analysis (PCA)
is performed per sample and the first principal component (PC1) is retained. The first principal component includes the majority of the information variance of the spectral data over the measured regions of the sample (Table 1).
This pre-processing step allows us to reduce a dataset of (11612 x 13 x 17) x 3 in a column vector of (5334 x 1) representing the sample.
a.
b.
Figure 1: Pre-processing of the Raman Microspectroscopy imaging data. All numbers presented are for the treatment of the 200-1800cm-1 spectral range maps.
a. Pre-treatment step per sample, from the hyperspectral cube to the first PC.
b. Treatment of the data, from the first principal component of each sample to the final PCA discriminating plot.
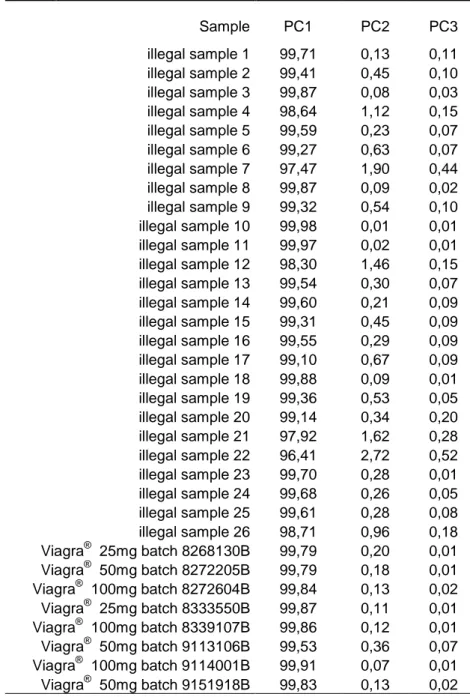
Table 1: Percentage of variation of matrix Asample (see 3.3.1.) explained by
the three firstprincipal components.
Sample PC1 PC2 PC3 illegal sample 1 99,71 0,13 0,11 illegal sample 2 99,41 0,45 0,10 illegal sample 3 99,87 0,08 0,03 illegal sample 4 98,64 1,12 0,15 illegal sample 5 99,59 0,23 0,07 illegal sample 6 99,27 0,63 0,07 illegal sample 7 97,47 1,90 0,44 illegal sample 8 99,87 0,09 0,02 illegal sample 9 99,32 0,54 0,10 illegal sample 10 99,98 0,01 0,01 illegal sample 11 99,97 0,02 0,01 illegal sample 12 98,30 1,46 0,15 illegal sample 13 99,54 0,30 0,07 illegal sample 14 99,60 0,21 0,09 illegal sample 15 99,31 0,45 0,09 illegal sample 16 99,55 0,29 0,09 illegal sample 17 99,10 0,67 0,09 illegal sample 18 99,88 0,09 0,01 illegal sample 19 99,36 0,53 0,05 illegal sample 20 99,14 0,34 0,20 illegal sample 21 97,92 1,62 0,28 illegal sample 22 96,41 2,72 0,52 illegal sample 23 99,70 0,28 0,01 illegal sample 24 99,68 0,26 0,05 illegal sample 25 99,61 0,28 0,08 illegal sample 26 98,71 0,96 0,18 Viagra® 25mg batch 8268130B 99,79 0,20 0,01 Viagra® 50mg batch 8272205B 99,79 0,18 0,01 Viagra® 100mg batch 8272604B 99,84 0,13 0,02 Viagra® 25mg batch 8333550B 99,87 0,11 0,01 Viagra® 100mg batch 8339107B 99,86 0,12 0,01 Viagra® 50mg batch 9113106B 99,53 0,36 0,07 Viagra® 100mg batch 9114001B 99,91 0,07 0,01 Viagra® 50mg batch 9151918B 99,83 0,13 0,02
The column vectors obtained for each sample were assembled in a (5334 x 34) matrix which is transposed resulting in a matrix of dimensions (34 x 5334) where 34 is the number of samples and 5334 the number of wavelengths for which spectral data is available (Figure 1b). This dataset, named matrix B, was used in further analysis.
3. Results and Discussion
3.1. Raman microspectroscopy maps
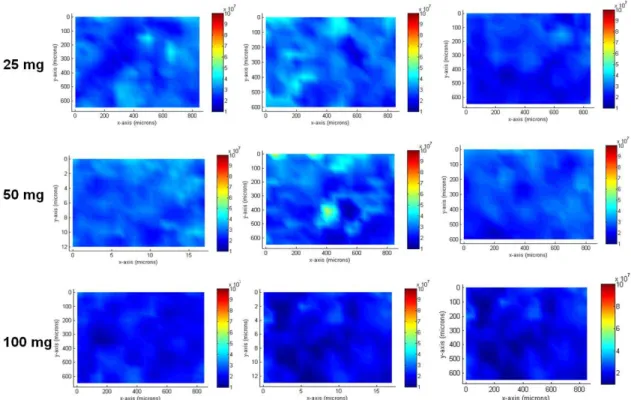
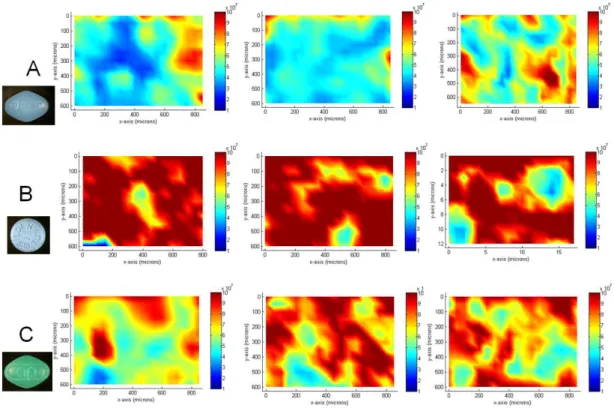
Figure 2 shows typical genuine Viagra® maps at the three dosage forms and Figure 3 shows the maps of 3 illegal samples which are representative of the other illegal samples. There is no visible difference between the dosage forms of the genuine samples at the chosen intensity range (1 x 10⁷ – 10 x 107 Raman counts). However, as can be seen, the spectral intensities are much higher in illegal preparations than in genuine tablets. This is sometimes due to higher sildenafil content but in most cases this is due to a higher background shift. This shift may be caused by high impurity content or the use of other excipients like colored excipients such as sample B in Figure 3 which is a non coated blue tablet. Those excipients may cause fluorescence or be more Raman active and, therefore, be responsible of those higher spectral intensities.
As the aim of this study was to be able to discriminate illegal Viagra® from genuine ones, the different shifts were not corrected. Those differences must be kept to perform a correct and complete discrimination based on both spectral intensities, additional peaks and also on the peak intensity distribution.
Figure 2: Raman Microspectroscopy imaging maps of representative genuine. Three maps in the spectral region
of 200-1800cm-1 taken at different positions of the core of three dosage forms of genuine Viagra® are presented. Spectral intensity colors are comprised between 1x10⁷ and 10x107 Raman Counts.
Figure 3:Raman Microspectroscopy imaging maps of representative illegal samples. Three maps in the spectral region of 200-1800cm-1 taken at different positions of the core of three illegal samples are presented with the corresponding sample photo. Spectral intensity colors are comprised between 1x10⁷ and 10x107 Raman Counts.
3.2. PCA
In order to evaluate which of the whole spectrum or specific spectral regions is the best to discriminate genuine samples from illegal ones; principal component analysis was applied as exploratory method.
3.2.1. spectral range 200-1800 cm-1
The PCA analysis has been performed on the matrix B. The complete spectral region between 200 cm-1 and 1800 cm-1 has been chosen because this is the most informative region for pharmaceutical tablet analysis.
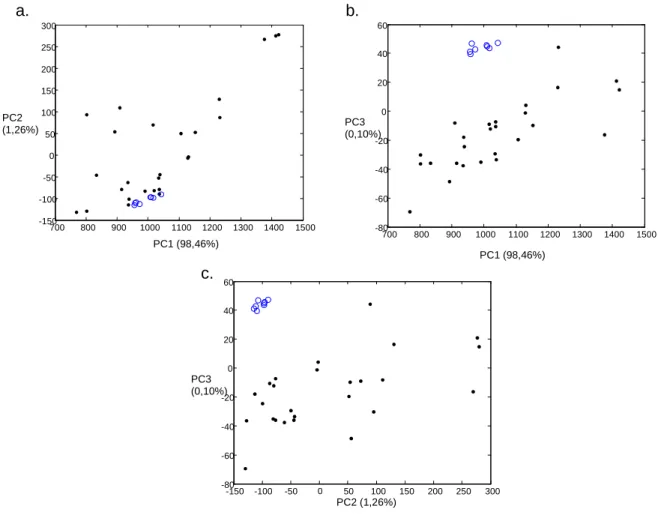
As can be seen from Figure 4, a clear discrimination was obtained. This discrimination is mainly due to PC3 which explains only 0.1% of the variance.
No real cluster can be seen but a group of three illegal samples are clearly apart from the other ones. This is explained by the fact that the three samples are non coated colored tablets. This is logical since the colorant results in higher spectral intensities.
700 800 900 1000 1100 1200 1300 1400 1500 -150 -100 -50 0 50 100 150 200 250 300 PC1 (98,46%) PC2 (1,26%) 700 800 900 1000 1100 1200 1300 1400 1500 -80 -60 -40 -20 0 20 40 60 PC1 (98,46%) PC3 (0,10%) -150 -100 -50 0 50 100 150 200 250 300 -80 -60 -40 -20 0 20 40 60 PC2 (1,26%) PC3 (0,10%) a. b. c.
Figure 4: PCA plots of the 200-1800cm-1 spectral range dataset. Black dots are illegal samples and blue circles
are genuine Viagra® samples. a. PC1-PC2 plot, b. PC1-PC3 plot, c. PC2-PC3 plot.
3.2.2. Spectral range 830-880 cm-1
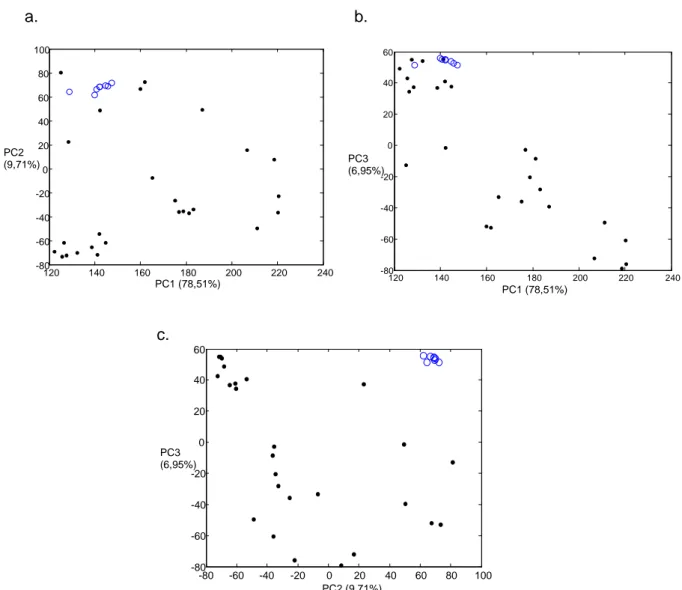
A second PCA analysis has been performed between the 830-880 cm-1 spectral range. In this region, genuine tablets shows no peak because lactose is not present in the core of genuine Viagra® tablets whereas illegal samples show two peaks at 851 and 876 cm-1. These two peaks are attributed to lactose [7, 29]. As can be seen on Figure 5, a good discrimination between genuine and illegal samples is achieved with the PC2-PC3 plot. These two principal components explain 10% and 7% of the variance respectively. One can then see that counterfeiters do not copy the genuine tablet formulation but use more classical filler excipients such as lactose.
Some clusters or sample regrouping can be observed. However, no clear reason has been found since no full excipients analysis has been performed.
120 140 160 180 200 220 240 -80 -60 -40 -20 0 20 40 60 80 100 PC1 (78,51%) PC2 (9,71%) 120 140 160 180 200 220 240 -80 -60 -40 -20 0 20 40 60 PC1 (78,51%) PC3 (6,95%) -80 -60 -40 -20 0 20 40 60 80 100 -80 -60 -40 -20 0 20 40 60 PC2 (9,71%) PC3 (6,95%) a. b. c.
Figure 5: PCA plots of the 830-880cm-1 spectral range dataset. This spectral region corresponds to lactose peaks. Black dots are illegal samples and blue circles are genuine Viagra® samples.
a. PC1-PC2 plot, b. PC1-PC3 plot, c. PC2-PC3 plot.
3.2.3. Spectral range 1200-1290 cm-1
A multivariate analysis has been performed keeping only the 1200-1290 cm-1 spectral range. This region corresponds to intense peaks at 1238 and 1272 cm−1 which are attributed to the C=N bond of sildenafil in Viagra® tablets [7]. To perform this analysis, the matrix B was normalized before the last PCA. This normalization avoided differences due to intensity while keeping only the information related to the distribution of sildenafil in the tablets. This analysis did not discriminate genuine tablets from illegal samples. It indicates that the distribution of the active ingredient is not sufficiently different among the different samples to permit discrimination.
700 800 900 1000 1100 1200 1300 1400 1500 -150 -100 -50 0 50 100 150 200 250 300 PC1 (98,46%) PC2 (1,26%) 700 800 900 1000 1100 1200 1300 1400 1500 -80 -60 -40 -20 0 20 40 60 PC1 (98,46%) PC3 (0,10%) -150 -100 -50 0 50 100 150 200 250 300 -80 -60 -40 -20 0 20 40 60 PC2 (1,26%) PC3 (0,10%) 3.3. Classification
After the exploratory analysis, it was found that the whole spectral region was the best to perform the discrimination between genuine and illegal samples. As a result, classification algorithms were applied on the 200-1800 cm-1 spectra dataset. For official control laboratories, it is very important to be able to classify correctly an unknown sample in the genuine or in the illegal classes. This is why classification algorithms were applied and their correct classification rate evaluated during both internal and external validation.
a. b.
c.
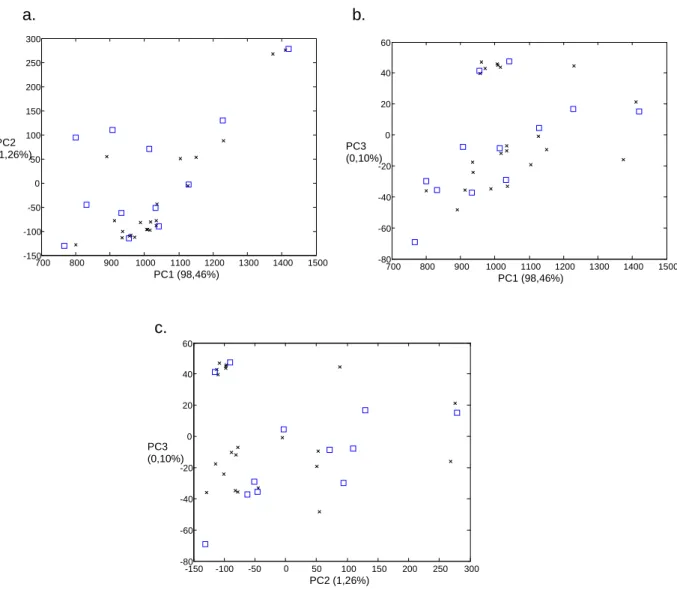
Figure 6: Homogenous distribution of the test set samples (squares) among the training set samples (crosses)
selected by the Kennard and Stone algorithm on the 200-1800cm-1 spectral range dataset. These datasets were used for the application of the prediction algorithms.
a. PC1-PC2 plot, a. PC1-PC3 plot, b. PC2-PC3 plot.
The dataset was split into a training set and a test set for the external validation. The samples of each dataset were chosen applying the Kennard and Stone algorithm on the matrix B. Test set size was set at 12 objects and included two reference samples. The training set is composed of the first 22 samples chosen by the algorithm.
Three classification algorithms were tested.
Application of the LDA algorithm gave good results even though not all samples were classified correctly. The correct classification rate was 95,5% for the leave-one-out cross-validation (LOOCV) and 91,2% for the external cross-validation. One illegal sample was misclassified in both internal and external validation.
The k-NN analysis has been performed on the training set using a LOOCV for the internal validation. Both internal and external validations returns 100% correct classification when considering the 3 nearest neighbours to the new sample. This confirms that the method can be used to detect illegal medicines since their spectral intensities are not the same as the ones of genuine samples.
As third a SIMCA analysis was performed. The SIMCA algorithm optimises of the number of principal components used to describe each class of samples by LOOCV. In this case, two and five principal components were respectively used to define a model for the genuine and the illegal samples. Each model separately was not able to classify all samples of the test set correctly, though using the nearest class principle SIMCA returned 100% correct classification in both the internal and external validation.
Comparison of the three algorithms showed that they could all be applied to model this type of data. For our dataset k-NN and SIMCA gave the best results. Based on the easiness of computation and interpretation the k-NN model was preferred and chosen as the best model for this dataset. Though it should be kept in mind that the preferred algorithm is case sensitive and can change in function of the data. For example when data is available for generic products, the model should deal with a multiclass problem. It is possible that in this case better results can be obtained with SIMCA or LDA compared to k-NN.
4. Conclusion
Raman microspectroscopy is a powerful tool allowing a complete mapping of a limited area of a tablet with a limited sample preparation. The analysis of these maps may provide a lot of information about the identification of chemical compounds present, their distribution and their amount [30]. In this study, the core of 26 counterfeit and imitation tablets of Viagra® and 8 genuine samples of Viagra® were analysed by Raman microspectroscopy over the spectral regions of 200-1800 cm-1, 830-880 cm-1 and 1200-1290 cm-1.
After a pre-processing step that made the data suitable for further analysis, a principal component analysis has been performed. The results in the spectral regions of 200-1800 cm
-1 allowed a clear discrimination between genuine and illegal samples. This discrimination is
mainly due to differences in spectral intensities between genuine and illegal samples. These differences may be explained by differences in chemical composition such as the presence of colored excipients in the core of the tablets.
A second PCA analysis of the dataset in the spectral region of 830-880 cm-1 allows a detection of illegal samples based on the presence of lactose. This common filler excipient is not present in the core of genuine Viagra tablets.
A third PCA analysis was performed on the spectral region of 1200-1290 cm-1 that is correlated with the presence of sildenafil in tablets. The aim of this analysis was to detect illegal samples based on the spatial distribution of sildenafil. No discrimination has been obtained revealing that the spatial distribution of sildenafil between illegal and genuine samples is not sufficiently different.
Three predictive models have been tested on the spectral regions of 200-1800 cm-1 dataset. The best results were obtained with k-NN and SIMCA, showing both a correct classification for all samples during internal and external validation steps. Based on its simplicity the k-NN algorithm was chosen as the most suited method for this two class classification.
This feasibility study shows that Raman microscpectroscopy is able to discriminate illegal samples from genuine ones using unsupervised chemometrics.
References
[1] PSI, Counterfeit situation: geographic distribution, http://www.psi-inc.org/index.cfm (last accessed 09/05/11)
[2] FAGG/AFMPS, Belgian participation in PANGEA III, an international operation fighting against the online sale of counterfeit and illegal medicines, October 2010, http://www.fagg-afmps.be/fr/news/news_pangea_III.jsp
[3] US FDA, Label and Approval History: Viagra®,
http://www.accessdata.fda.gov/scripts/cder/drugsatfda/index.cfm?fuseaction=Search.DrugDe tails (last accessed 09/05/11)
[4] EMA, Authorisation Details: Viagra®,
http://www.ema.europa.eu/ema/index.jsp?curl=pages/medicines/human/medicines/000202/h uman_med_001136.jsp&mid=WC0b01ac058001d124&murl=menus/medicines/medicines.jsp &jsenabled=true (last accessed 09/05/11)
[5] A.L. Rodomonte, M.C. Gaudiano, E. Antoniella, D. Lucente, V. Crusco, M. Bartolomei, P. Bertocchi, L. Manna, L. Valvo, N. Muleri, Counterfeit drugs detection by measurement of tablets and secondary packaging colour, J. Pharm. Biomed. Anal. 53 (2010) 215-220
[6] M.J. Vredenbregt, L. Blok-Tip, R. Hoogerbrugge, D.M. Barends, D. de Kaste, Screening suspected counterfeit Viagra® and imitations of Viagra® with near-infrared spectroscopy, J. Pharm. Biomed. Anal. 40 (2010) 840-849
[7] M. de Veij, A. Deneckere, P. Vandenabeele, D. de Kaste, L. Moens, Detection of counterfeit Viagra® with Raman spectroscopy, J. Pharm. Biomed. Anal. 46 (2008) 303-09 [8] P.-Y. Sacré, E. Deconinck, T. De Beer, P. Courselle, R. Vancauwenberghe, P. Chiap, J. Crommen, JO. De Beer, Comparison and combination of spectroscopic techniques for the detection of counterfeit medicines, J. Pharm. Biomed. Anal. 53 (2010) 445-53
[9] J.K. Maurin, F. Pluciński, A.P. Mazurek, Z. Fijałek, The usefulness of simple X-ray powder diffraction analysis for counterfeit control—The Viagra® example, J. Pharm. Biomed. Anal. 43 (2007) 1514-18
[10] I. Wawer, M. Pisklak, Z. Chilmonczyk, 1H, 13C, 15N NMR analysis of sildenafil base and citrate (Viagra) in solution, solid state and pharmaceutical dosage forms, J. Pharm. Biomed. Anal. 38 (2005) 865-70
[11] S. Trefi, V. Gilard, S. Balayssac, M. Malet-Martino, R. Martino, The usefulness of 2D DOSY and 3D DOSY-COSY 1H NMR for mixture analysis: application to genuine and fake formulations of sildenafil (Viagra), Magn. Reson. Chem. 47 (2009) 163–73
[12] H. Nawaz, F. Bonnier, P. Knief, O. Howe, F.M. Lyng, A.D. Meade, H.J. Byrne, Evaluation of the potential of Raman microspectroscopy for prediction of chemotherapeutic response to cisplatin in lung adenocarcinoma, Analyst, 135 (2010) 3070-3076
[13] A. Juillard, G. Falgayrac, B. Cortet, M.H. Vieillard, N. Azaroual, J.C. Hornez, G. Penel, Molecular interactions between zoledronic acid and bone: An in vitro Raman microspectroscopic study, Bone 47 (2010) 895-904
[14] T. Quinten, T. De Beer, C. Vervaet, J.P. Remon, Evaluation of injection moulding as a pharmaceutical technology to produce matrix tablets, Eur. J. Pharm. Biopharm. 71 (2009) 145-54
[15] N. Furuyama, S. Hasegawa, T. Hamaura, S. Yada, H. Nakagami, E. Yonemochi, K. Terada, Evaluation of solid dispersions on a molecular level by the Raman mapping technique, Int. J. Pharm. 361 (2008) 12-18
[16] E. Karavas, M. Georgarakis, A. Docoslis, D. Bikiaris, Combining SEM, TEM, and micro-Raman techniques to differentiate between the amorphous molecular level dispersions and nanodispersions of a poorly water-soluble drug within a polymer matrix, Int. J. Pharm. 340 (2007) 76-83
[17] B. Vajna, I. Farkas, A. Szabó, Z. Zsigmond, G. Marosi Raman microscopic evaluation of technology dependent structural differences in tablets containing imipramine model drug, J. Pharm. Biomed. Anal. 51 (2010) 30–38
[18] J. Burger, P. Geladi, Hyperspectral NIR imaging for calibration and prediction: a comparison between image and spectrometer data for studying organic and biological samples, Analyst 131 (2006) 1152-1160
[19] Y. Roggo, A. Edmond, P. Chalus, M. Ulmschneider, Infrared hyperspectral imaging for qualitative analysis of pharmaceutical solid forms, Anal. Chim. Acta 535 (2005) 79-87
[20] Y. Roggo, N. Jent, A. Edmond, P. Chalus, M. Ulmschneider, Characterizing process effects on pharmaceutical solid forms using near-infrared spectroscopy and infrared imaging, Eur. J. Pharm. Biopharm. 61 (2005) 100-110
[21] A.S. El-Hagrasy, H.R. Morris, F. D’Amico, R.A. Lodder, J.K. Drennen III, Near-infrared spectroscopy and imaging for the monitoring of powder blend homogeneity, J. Pharm. Sci. 90 (2001) 1298-1307
[22] M.B. Lopes, J.C. Wolff, Investigation into classification/sourcing of suspect counterfeit Heptodintrade mark tablets by near infrared chemical imaging, Anal. Chim. Acta 633 (2009) 149–155
[23] M.B. Lopes, J.C. Wolff, J.M. Bioucas-Dias, M.A. Figueiredo, Determination of the composition of counterfeit Heptodin tablets by near infrared chemical imaging and classical least squares estimation, Anal. Chim. Acta 641 (2009) 46–51.
[24] T. Puchert, D. Lochmann, J.C. Menezes, G. Reich, Near-infrared chemical imaging (NIR-CI) for counterfeit drug identification-a four-stage concept with a novel approach of data processing (Linear Image Signature), J. Pharm. Biomed. Anal. 51 (2010) 138–145.
[25] D.L. Massart, B.G.M. Vandeginste, L.M.C. Buydens, S. De Jong, P.J. Lewi, J. Smeyers-verbeke, Handbook of Chemometrics and Qualimetrics-Part A., Elsevier Science: Amsterdam, 1997
[26] R.W. Kennard, L.A. Stone, Computer Aided Design of Experiments, Technometrics 11 (1969) 137-148.
[27] D.L. Massart, B.G.M. Vandeginste, L.M.C. Buydens, S. De Jong, P.J. Lewi, J. Smeyers-verbeke, Handbook of Chemometrics and Qualimetrics-Part B., Elsevier Science: Amsterdam, 1997
[28] W. Wu, Y. Mallet, B. Walczak, W. Penninckx, D. L. Massart, S. Heuerding and F. Erni, Comparison of regularized discriminant analysis, linear discriminant analysis and quadratic discriminant analysis, applied to NIR data, Anal. Chim. Acta 329(1996) 257-265
[29] J. De Gelder, K. De Gussem, P. Vandenabeele, L. Moens, Reference database of Raman spectra of biological molecules, J. Raman Spectrosc. 38 (2007) 1133–1147.
[30] K.M. Balss, G. Llanos, G. Papandreou, C.A. Maryanoff, Quantitative spatial distribution of sirolimus and polymers in drug-eluting stents using confocal Raman microscopy, J. Biomed. Mater. Res. A 85 (2008), 258-270.