UNIVERSITÉ DE MONTRÉAL
OXYGEN REDUCTION REACTION (ORR)
ON MIXED OXY-NITRIDE NON-NOBLE CATALYST:
AB-INITIO SIMULATION, ELABORATION AND CHARACTERIZATION
ALI SEIFITOKALDANI
DÉPARTEMENT DE GÉNIE CHIMIQUE ÉCOLE POLYTECHNIQUE DE MONTRÉAL
THÈSE PRÉSENTÉE EN VUE DE L’OBTENTION DU DIPLÔME DE PHILOSOPHIAE DOCTOR
(GÉNIE CHIMIQUE) AVRIL 2014
UNIVERSITÉ DE MONTRÉAL
ÉCOLE POLYTECHNIQUE DE MONTRÉAL
Cette thèse intitulée:
OXYGEN REDUCTION REACTION (ORR)
ON MIXED OXY-NITRIDE NON-NOBLE CATALYST:
AB-INITIO SIMULATION, ELABORATION AND CHARACTERIZATION
présentée par : SEIFITOKALDANI Ali
en vue de l’obtention du diplôme de : Philosophiae Doctor a été dûment acceptée par le jury d’examen constitué de :
Mme. DESCHÊNES Louise, Ph.D. , président
M. SAVADOGO Oumarou, D. d’état, membre et directeur de recherche M. PERRIER Michel, Ph.D. , membre et codirecteur de recherche M. YAHIA L’Hocine, Ph.D. , membre
DEDICATION
This thesis is dedicated to my beloved wife, who is the best friend,
To my mother and my sister, who are the kindest,
And to my father, who was the best teacher, in my life.
ACKNOWLEDGEMENT
I would like to give my sincere gratitude to those who helped me during my PhD to complete this thesis. Undoubtedly the first and the most important is nobody but my supervisor, Professor Oumarou Savadogo, who gave me the chance of working in his group. I learned a lot. Thanks Oumarou for your kind guidance, encouragement and supports.
I would like to give million thanks to my co-supervisor, Professor Michel Perrier, whom I learned from to be supportive, kind and patient. Thanks Michel, I never forget your endless kindness.
I thank to my friends in our group: Eric Nguwuo Petuenju, Bintou Ouedraogo, Majid Talebi Esfandarani, Seyed Mohammad-Amin Shahrestani, Kentaro Oishi, Lina Kafrouni and Maryam Haddad. My special thanks to Madam Carole Massicotte, that working in laboratory without her was a real toil.
I would like to thank Dr. Huimin Tian, Dr. Wanli Wang and Mr. Ramon Martinez, who are not here, but helped me to start my work. Thank you so much for all your valuable helps.
And the last, but not least, I thank my wife, my mother and father, my sisters and brothers, all my friends especially Mohsen Keshavarz Khorasgani, and all my beloved nieces and nephews, who make my life full of love, excitement and energy. I always have a great time with your memories.
Thanks Montréal! Thanks Canada!
RÉSUMÉ
Dans ce projet, l’oxy-nitrure de titane (TiOxNy) a été étudié comme un nouvel électro-catalyseur
non noble pour la réaction de réduction de l'oxygène (RRO). Une comparaison détaillée entre quatre différentes méthodes de préparation sol-gel a été effectuée pour évaluer les propriétés physicochimiques et électrochimiques des électro-catalyseurs produits. Parmi ces méthodes, un nouveau procédé sol-gel à base d'urée (simplement appelée méthode U) a été introduit pour préparer du TiOxNy à une température relativement basse et une durée relativement faible de
recuit. Les matériaux fabriqués par cette nouvelle méthode donnent une activité électro-catalytique de la RRO plus élevée de celle des oxy-nitrures de titane préparés par les autres méthodes. Les électro-catalyseurs, préparés avec différents rapports de N/O, ont montré des propriétés différentes allant d'un comportement très peu conducteurs (faible rapport N/O) pour les matériaux riches en oxygène au comportement plus conducteur et stable chimiquement et électro-chimiquement pour les oxy-nitrures riches en azote (rapport élevé en N/O), respectivement. Généralement, les électro-catalyseurs préparés par la méthode U avaient plus de nitrure de titane dans leurs structures que les électro-catalyseurs préparés par les autres méthodes. Néanmoins, le traitement thermique a un rôle essentiel dans la composition de cette phase la faisant passer de phase ayant une composition en oxyde à celle ayant une composition élevée de nitrure. Selon l'analyse élémentaire effectuée par spectrométrie à dispersion d'énergie (EDS), le pourcentage d'azote dans le matériau est passé de 9 à 24 pour cent en augmentant la température de recuit de 700 à 1100 °C, tandis que le pourcentage d'oxygène diminuait inversement. En outre, sur la base des données de la diffraction des rayons X (XRD), dans le cas de la méthode de U, les pics caractéristiques de TiN ont été détectés, même à des températures de recuit plus basses. L'augmentation de cette température a également fait apparaître des pics beaucoup plus marqués indiquant la croissance de la taille des cristallites. La taille calculée des cristallites a montré que celle des échantillons préparés par la méthode de U (de 20 à 40 nm de diamètre) était presque dans la même gamme de valeurs que celle de la taille des cristallites de TiN pur. La taille des cristallites des échantillons préparés par les autres procédés sol-gel (de 40 à 60 nm de diamètre) était dans la même gamme de la taille des cristallites de TiO2 pur. La microscopie électronique à
balayage (MEB) et l’analyseur de surface B.E.T. ont été respectivement utilisés pour évaluer la taille des particules et la surface spécifique des différents échantillons. Ils ont indiqué une plus
petite taille de particules et donc une surface spécifique plus élevée pour les électro-catalyseurs produits par la méthode U.
Outre les caractérisations physicochimiques mentionnées ci-dessus, la voltammétrie cyclique (CV), la polarisation et la spectroscopie d'impédance électrochimique (SIE) ont été utilisées pour évaluer les propriétés électrochimiques des électro-catalyseurs. Les valeurs de la pente de Tafel, la densité de courant d’échange et le potentiel de départ ont révélé que l'électro-catalyseur préparé par le procédé de U et qui a été recuit à 1100 °C, a eu la meilleure activité électro-catalytique de tous les autres échantillons avec une pente de Tafel égale à -203 mV/décade, la densité du courant d’échange autour de 4E-04 mA/mg et le potentiel de départ proche de 0.8 volt par rapport à ENH (électrode normale à hydrogène). Les valeurs obtenues avec la SIE ont également montré que c’est le meilleur électro-catalyseur parce qu’il possède la plus grande capacité spécifique (~ 3.3 F/g). Ce fait est aussi en accord avec la plus grande valeur de sa surface BET et également sa plus faible résistance de transfert de charge.
La stabilité chimique et électrochimique est l'un des facteurs déterminants dans le choix d'un électro-catalyseur pour la RRO. À cet égard, l'ICP-TOF-MS a été utilisé pour évaluer la stabilité chimique et électrochimique, sous l'environnement d’acide corrosif, des électro-catalyseurs préparés, en mesurant la concentration du titane dissous après un certain temps. Jusqu'à présent, la mesure de la concentration des métaux dissous par ICP-TOF-MS a été la seule méthode utilisée dans la littérature pour évaluer sa stabilité chimique. Toutefois, dans ce projet, cette technique a été aussi utilisée après beaucoup de balayages de voltammétrie cyclique pour aussi évaluer la stabilité électrochimique de l'électro-catalyseur; ce qui est plus réaliste et plus proche de l'état de fonctionnement de la PEMFC (Polymer Electrolyte Membrane Fuel Cell). La stabilité du meilleur électro-catalyseur avec l'activité électro-catalytique la plus élevée (préparé par le procédé U) est meilleure que l’électro-catalyseur Pt/C utilisé dans le commerce, à la fois chimiquement et électro-chimiquement. La stabilité électrochimique des électro-catalyseurs préparés a également été étudiée à un potentiel oxydant élevé (plus de 2 volts vs NHE). La spectrométrie photoélectronique des rayons X (XPS) a montré que la quantité d'azote à la surface de l'électro-catalyseur a diminué de 11% avant l'oxydation à 5% après l'oxydation. Une diminution de l’activité électro l'activité électro-catalytique pour la RRO a diminué après l'oxydation. Ainsi, diminuer la quantité de nitrure de titane à la surface de l’oxy-nitrure de titane a réduit son activité électro-catalytique.
Dans la deuxième phase de ce projet, l'activité électro- catalytique du nitrure de titane pour la RRO a été étudiée par le calcul de la théorie de la fonctionnelle de la densité (DFT). Au meilleur de notre connaissance, il n'existe pas d'étude de la chimie quantique théorique et numériques de nitrure de métal de transition comme l'électro-catalyseur dans les piles à combustible PEM. La RRO a été considérée comme ayant lieu en trois différentes étapes séquentielles, à savoir l'adsorption de l'oxygène, la production d'hydroxyde et de désorption de l'eau. Sur la base des résultats de la diffraction des rayons X obtenus sur les meilleurs échantillons préparés qui montrent et qu’ils contiennent TiN(111) et TiN(200) comme les deux principales structures du TiN, la simulation a été sur la surface de ces deux structures. La simulation a été effectuée avec le logiciel «Vienna ab initio Simulation Package (VASP)» sur la base des ensembles de fonctions d'ondes planes aux conditions périodiques limites et qui intègre la description des interactions entre les électrons. La comparaison des énergies d'adsorption des espèces liées à la RRO a prouvé l’existence d'une forte adsorption dissociative de l'oxygène sur le TiN(111) quelles que soient les sites d'adsorption. Toutefois, en raison d'une adsorption de OH relativement forte sur TiN(111), cette surface a perdu les sites actifs pour procéder à la RRO, tandis que sur la surface du TiN(200), la production et la désorption d'eau s’effectuent presque facilement. La densité d'états électroniques (DEE) a été obtenue pour calculer le centre de la bande d et le remplissage fractionnaire dans des situations différentes. Considérant la possibilité d’adsorption sur des sites pont et de haut de la TiN(200), ces informations indiquent que la production d’hydroxyde et la désorption de l’eau sont les mesures déterminantes pour la RRO en site pont et sommet, respectivement. Par conséquent, il est révélé que le TiN, spécialement TiN(200) a une activité électro-catalytique pour la RRO. La perte de ce composant de la surface de l'oxy-nitrure de titane a provoqué la diminution de son activité électro-catalytique.
ABSTRACT
In this project, titanium oxy-nitride (TiOxNy) has been studied as a new non-noble
electro-catalyst for the oxygen reduction reaction (ORR). A comprehensive comparison between four different sol-gel methods was carried out to evaluate the physicochemical and electrochemical properties of the produced electro-catalysts. Among them, a new urea-based sol-gel method (simply called U method) is introduced to prepare TiOxNy at a fairly low temperature and
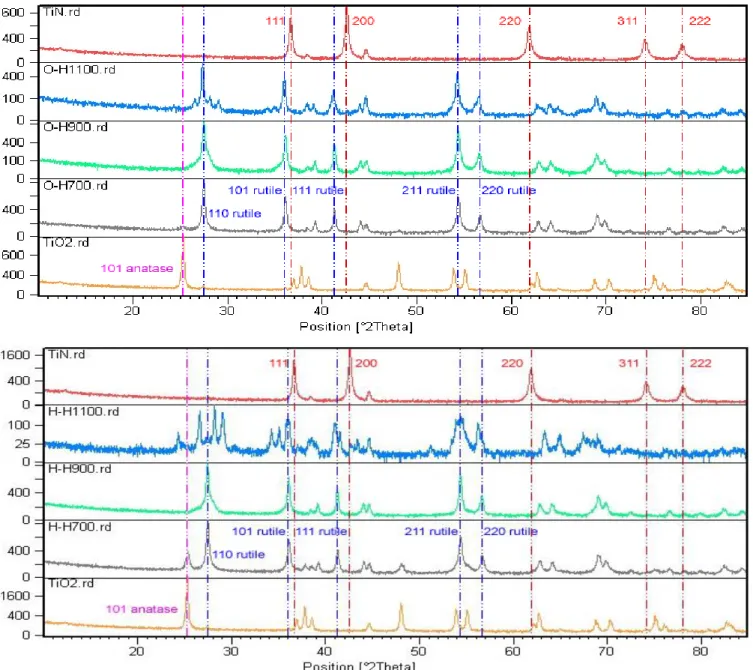
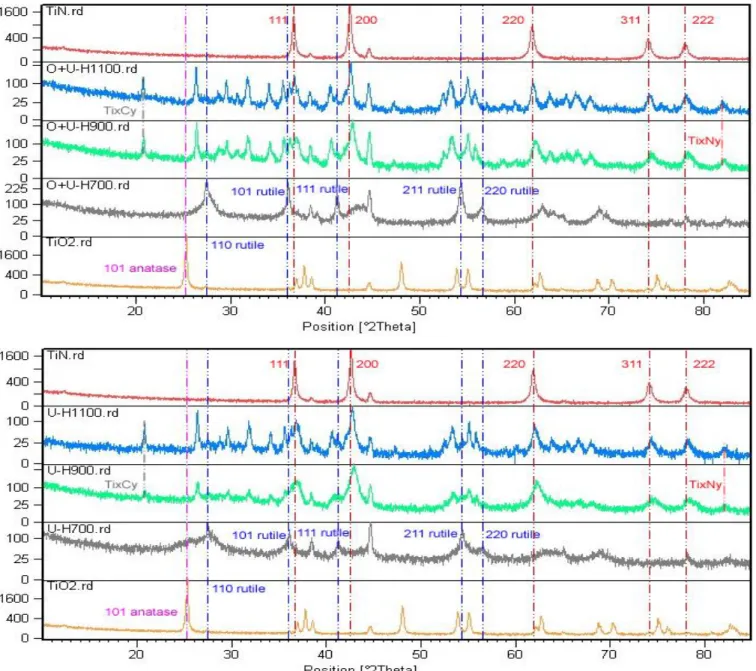
duration, with higher electro-catalytic activity for the ORR. The prepared electro-catalysts with different N/O ratios showed different properties from a less conductive behavior in oxygen-rich (low N/O ratio) materials to more conductive electro-catalyst behavior in nitrogen-rich (high N/O ratio) oxy-nitrides, respectively. Generally, electro-catalysts prepared by the U method had more titanium nitride in their structures than the electro-catalysts prepared by the other methods. Nevertheless, heat treatment had a key role in this phase transferring from having high oxide structure to high nitride structure. According to the elemental analysis done by energy dispersive spectroscopy (EDS), nitrogen percentage in the bulk material increased from 9 to 24 percent by increasing the temperature from 700 to 1100 °C, while the oxygen percentage was decreasing inversely. In addition, based on the X-ray diffraction (XRD) data, in the case of U method, the TiN characteristic peaks were obvious, even at lower temperatures. Increasing the temperature also made the peaks much sharper indicating the growth of the crystallite size. The calculated crystallite size showed the crystallite size of samples prepared by U method (20 to 40 nm) was almost in the same range of the TiN crystallite size, but the crystallite size of the samples prepared by the other sol-gel methods (40 to 60 nm) was in the same range of the TiO2 crystallite
size. Scanning electron microscopy (SEM) and B.E.T. surface area analyzer were used to evaluate the particle size and surface area of different samples, respectively. They indicated a smaller particle size and a higher surface area in the electro-catalysts produced by the U method. Besides the aforementioned physicochemical characterizations, cyclic voltammetry (CV), polarization, and electrochemical impedance spectroscopy (EIS) were used to evaluate the electrochemical properties of the electro-catalysts. Obtained Tafel slope, exchange current density and onset potential revealed that the electro-catalyst prepared by the U method which was annealed at 1100 °C, had the best electro-catalytic activity among all other samples with Tafel slope of -203 mV/decade, exchange current density around 4E-04 mA/mg and the onset potential
close to 0.8 volt vs. NHE (normal hydrogen electrode). EIS measurements also supported this assertion through revealing the highest specific capacitance (~ 3.3 F/g). This result was in agreement with the highest B.E.T. surface area and the lowest charge transfer resistance exhibited by this electro-catalyst among the other samples.
Stability is one of the determinant factors in selecting an electro-catalyst for the ORR. In this regard, ICP-TOF-MS was used to evaluate the chemical stability of the prepared electro-catalysts under corrosive acidic environment, by measuring the concentration of the dissolved titanium after a certain time. Heretofore, measuring the dissolved metal concentration by ICP-TOF-MS was done just to evaluate its chemical stability. However, in this project this technique was also used during the CV, to evaluate the electro-catalyst’s electrochemical stability as well, which is more realistic and similar to the PEMFC’s working condition. Stability of the best electro-catalyst with the highest catalytic activity (prepared by the U method) was better than the commercially used Pt/C electro-catalyst, both chemically and electrochemically. Electrochemical stability of the prepared electro-catalysts has also been studied at a high oxidizing potential (more than 2 volts vs. NHE). X-ray Photoelectron Spectroscopy (XPS) showed that the nitrogen amount on the surface of the electro-catalyst decreased from 11 % before the oxidation to 5 % after the oxidation, whereas the catalytic activity for the ORR decreased after the oxidation. Thus, decreasing the titanium nitride’s amount in the titanium oxy-nitride surface reduced its catalytic activity.
In the second phase of this project, electro-catalytic activity of the titanium nitride for the ORR was investigated via a density functional theory (DFT) computation. To the best of our knowledge, there is no theoretical and computational quantum chemistry study of the transition metal’s nitride as the electro-catalyst in PEM fuel cells. ORR was considered to take place in three different sequential steps namely oxygen adsorption, hydroxide production and water desorption. Based on the XRD results, TiN(111) and TiN(200) were considered as the two major facets of the TiN. Simulation was done by the Vienna ab initio Simulation Package (VASP) based on the Plane-Wave basis sets and periodic boundary condition, while the PBE exchange-correlational functional was used to describe the interactions among electrons. Comparing the adsorption energies proved existence of a strong dissociative adsorption of oxygen on the TiN(111) regardless of the adsorption sites. However, because of a relatively strong OH adsorption, TiN(111) loses the active sites to proceed the ORR, while on the TiN(200) surface,
water production and desorption came about easily. Electron density of states (DOS) was obtained to calculate the d-band center and fractional filling in different situations. Considering two possible bridge and top adsorption sites on the TiN(200), these information indicated the hydroxide production and water desorption as the rate determining steps for the ORR in bridge and top sites, respectively. Therefore, it was shown that the TiN, specially TiN(200) had exhibited good electro-catalytic activity for the ORR. Losing this TiN amount from the titanium oxy-nitride’s surface might be responsible for the decrease of the electro-catalytic activity of the titanium oxy-nitride for the ORR.
TABLE OF CONTENTS
DEDICATION ... III ACKNOWLEDGEMENT ... IV RÉSUMÉ ... V ABSTRACT ... VIII TABLE OF CONTENTS ... XI LIST OF TABLES ... XVI LIST OF FIGURES ... XVII LIST OF ABBREVIATIONS ... XIXINTRODUCTION ... 1
CHAPTER 1 LITERATURE REVIEW – PART A: PEM FUEL CELL ... 4
1.1 Fuel Cell General Application ... 4
1.2 Fuel Cell Types ... 5
1.3 PEM Fuel Cell ... 7
1.4 Membrane Electrode Assembly ... 9
1.4.1 Membrane ... 10
1.4.2 Gas Diffusion Layer ... 12
1.4.3 Catalyst Layer ... 13
1.5 Hydrogen Oxidation Reaction ... 14
1.6 Oxygen Reduction Reaction ... 16
1.7 Theoretical Background ... 18
1.8 Electrochemical Measuring Techniques ... 21
1.9 Pt-based Catalysts ... 29
1.11 Catalysts Preparation (Sol-Gel Method) ... 33
CHAPTER 2 LITERATURE REVIEW – PART B: AB INITIO SIMULATION ... 37
2.1 Schrödinger Equation ... 37
2.2 Born-Oppenheimer Approximation ... 40
2.3 Slater Determinants ... 42
2.4 Hartree-Fock (HF) Method ... 44
2.5 Density Functional Theory ... 48
2.5.1 Orbital-Free DFT Approach ... 49
2.5.2 Kohn-Sham Approach ... 51
2.6 Exchange-Correlation Functional ... 53
2.6.1 Local Density Approximation (LDA) ... 54
2.6.2 Generalized Gradient Approximation (GGA) ... 54
2.7 Basis Sets ... 55
2.7.1 Localized Basis Sets ... 56
2.7.2 Plane Wave Basis Sets ... 57
2.8 Pseudo-Potential (Effective Core Potential) ... 58
2.9 Cluster and Slab Models ... 59
2.10 Brillouin Zone ... 61
2.11 VASP ... 63
2.12 Adsorption Energy Calculation ... 66
2.13 Density of State (DOS) ... 66
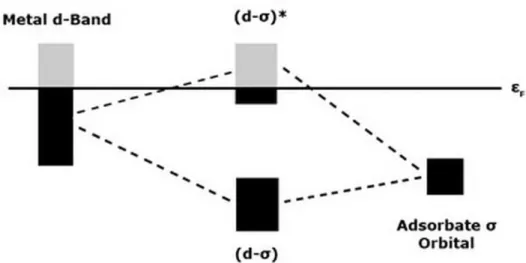
2.14 d-Band Theory ... 69
CHAPTER 3 OBJECTIVES ... 72
CHAPTER 4 ARTICLE 1: ELECTROCHEMICAL AND PHYSICOCHEMICAL
BY FOUR DIFFERENT SOL-GEL METHODS FOR THE OXYGEN REDUCTION
REACTION (ORR) IN ACID MEDIUM ... 73
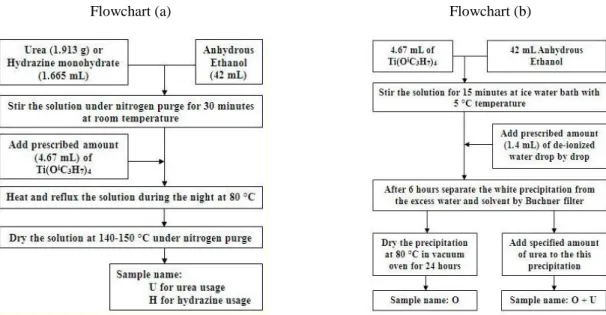
4.1 Introduction ... 74 4.2 Experimental Procedure ... 76 4.2.1 Materials ... 76 4.2.2 Sol-Gel Procedure ... 76 4.2.3 Heat-Treatment ... 78 4.2.4 Physicochemical Characterizations ... 78 4.2.5 Electrochemical Measurements ... 78 4.2.6 Chemical Stability ... 79
4.3 Results and Discussions ... 79
4.3.1 Physicochemical Characterizations ... 79
4.3.2 Chemical Stability ... 88
4.3.3 Electrochemical Stability ... 90
4.3.4 Catalytic Activity for the ORR... 92
4.4 Conclusion ... 96
4.5 References ... 97
CHAPTER 5 ARTICLE 2: STABILITY AND CATALYTIC ACTIVITY OF TITANIUM OXY-NITRIDE CATALYST PREPARED BY IN-SITU UREA-BASED SOL-GEL METHOD FOR THE OXYGEN REDUCTION REACTION (ORR) IN ACID MEDIUM... 104
5.1 Introduction ... 105
5.2 Experimental Procedure ... 106
5.2.1 Catalyst Preparation ... 106
5.2.2 Characterization ... 107
5.3 Results and Discussions ... 108
5.3.1 Physicochemical Characterizations ... 108
5.3.2 Chemical and electrochemical stability and catalytic activity ... 112
5.3.3 Electrochemical Impedance Spectroscopy (EIS) Analysis ... 117
5.4 Conclusion ... 121
5.5 References ... 122
CHAPTER 6 ARTICLE 3: OXYGEN REDUCTION REACTION (ORR) ON A MIXED TITANIUM AND TANTALUM OXY-NITRIDE CATALYST PREPARED BY THE UREA-BASED SOL-GEL METHOD ... 129
6.1 Introduction ... 130 6.2 Experimental Procedure ... 133 6.2.1 Materials ... 133 6.2.2 Sol-Gel Procedure ... 133 6.2.3 Heat Treatment ... 133 6.2.4 Physicochemical Characterizations ... 135 6.2.5 Electrochemical Measurements ... 135
6.3 Results and Discussions ... 136
6.3.1 Physicochemical Characterizations ... 136
6.3.2 Electrochemical Stability ... 139
6.3.3 Catalytic Activity for the ORR... 141
6.4 Conclusion ... 149
6.5 Acknowledgements: ... 150
CHAPTER 7 ARTICLE 4: DENSITY FUNCTIONAL THEORY (DFT) COMPUTATION OF THE OXYGEN REDUCTION REACTION (ORR) ON TITANIUM NITRIDE (TIN)
SURFACE... ... 154
7.1 Introduction ... 155
7.2 Computational Approach ... 156
7.3 Results and Discussions ... 159
7.4 Conclusion ... 168
7.5 References ... 169
CHAPTER 8 GENERAL DISCUSSION ... 175
CONCLUSIONS AND RECOMMENDATIONS... 179
LIST OF REFERENCES ... 181
LIST OF TABLES
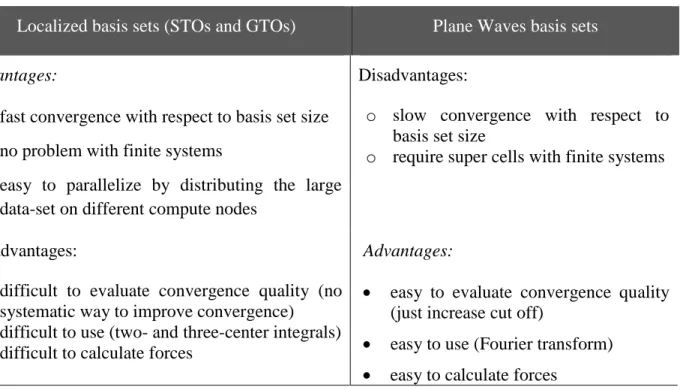
Table 1-1: Specifications of different types of fuel cells ([14-16]) ... 6 Table 1-2: Different types of hierarchically created polymer electrolyte membranes [27] ... 11 Table 2-1: Comparing advantages and disadvantages of localized and plane wave basis sets ... 59
LIST OF FIGURES
Figure 1-1: Schematic picture of PEMFC [2] ... 1 Figure 1-1: Different parts of a MEA ... 8 Figure 1-2: MEA preparation modes (a): separate electrode method and (b): catalyst coated
membrane method [27] ... 10 Figure 1-3: Structure of Nafion membrane [27] ... 12 Figure 1-4: Schematic mechanism for 4e- and 2e- pathways ... 16 Figure 1-5: Oxygen adsorption models: (a) the Griffiths model, (b) the Pauling model and (c) the
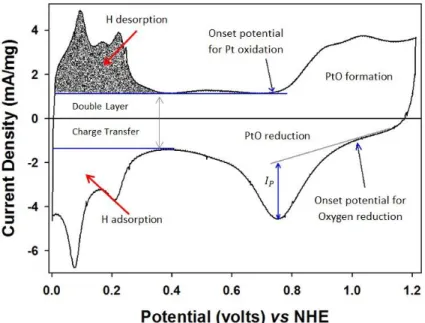
Yeager model[47] ... 18 Figure 1-6: Polarization curve of the ORR on Pt catalyst at 30 °C ... 22 Figure 1-7: CV of Pt/TiON 30 wt % in 0.5 M sulfuric acid saturated with O2 at room temperature
... 24 Figure 1-8: (left: a) Polarization curve with RDE at different speeds for commercial Pt/C 30 wt %
catalyst in a 0.5 M sulfuric acid saturated by 1 bar O2 at 25 °C and (right: b) related
Koutecky-Levich plot at different potentials. ... 25 Figure 1-9: Modified Randles–Ershler equivalent circuit model (Rs: uncompensated ohmic
resistance, Rct:charge transfer resistance, Ws: Warburg finite element with short terminal, CPE: constant phase element) ... 27 Figure 1-10: EIS in the Nyquist (left) and Bode (right) diagram for the titanium oxy-nitride
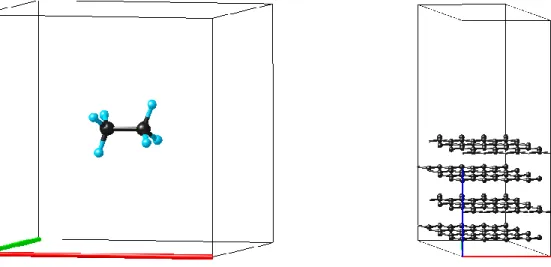
catalyst at three different bias DC potential: 0 V vs. OCV, -0.3 V vs. OCV and +1.5 V vs. SCE. AC perturbation had amplitude of 10 mV. ... 29 Figure 1-11: Heating schedule of heat treatment process ... 35 Figure 2-1: Ethane molecule (left) and graphite surface (right) both modeled by a periodic
boundary condition slab model. ... 60 Figure 2-2: Schematic of self-consistent iteration calculations in VASP ... 64 Figure 2-3: VASP user interface windows to select the desired options and adjust the parameters ... 65
Figure 2-4: DOS of two different atoms in TiN (200) in interaction with O2 molecule. ... 70 Figure 2-5: Schematic of the effect of d-band state position on the extent of anti-bonding filling ... 71
LIST OF ABBREVIATIONS
AFC Alkaline Fuel CellALD Atomic Layer Deposition AOs Atomic Orbitals
APUs Auxiliary Power Units
bcc Body Center Cubic
BZ Brillouin Zone
CCM Catalyst Coated Membrane CHP Combined Heat and Power
CL Catalyst Layer
CPE Constant Phase Element
CV Cyclic Voltammetry
CVD Chemical Vapor Deposition DFT Density Functional Theory DMFC Direct Methanol Fuel Cell DOS Density Of Electronic State
DSC Differential Scanning Calorimetry ECSA Electrochemical Active Surface Area EDS Energy Dispersive X-ray Spectroscopy EIS Electrochemical Impedance Spectroscopy fcc Face Center Cubic
GDL Gas Diffusion Layers
GGA Generalized Gradient Approximation GTO Gaussian Type Orbitals
HER Hydrogen Evolution Reaction
HF Hartree-Fock
HOR Hydrogen Oxidation Reaction
KS Kohn-Sham Approach
LDA Local Density Approximation MCFC Molten Carbonate Fuel Cell
MEA Membrane Electrode Assembly MOs Molecular Orbitals
OCV Open Circuit Voltage ORR Oxygen Reduction Reaction PAFC Phosphoric Acid Fuel Cell PAW Projected Augmented Wave
PEMFC Polymer Electrolyte Membrane Fuel Cell PES Potential Energy Surface
PFSA Perfluorosulfonic Acid PLD Pulsed Laser Deposition PTFE Polytetrafluoroethylene PW Plane Wave Basis Sets RDE Rotating Disk Electrode rds Rate Determining Step
RHE Reversible Hydrogen Electrode SCE Saturated Calomel Electrode SCF Self-Consistence-Field
SEM Scanning Electron Microscope SOFC Solid Oxide Fuel Cell
STO Slater Type Orbitals
TFD Thomas-Fermi-Dirac Model TGA Thermal Gravimetric Analysis TPB Three Phase Boundary
USP Ultra Soft Pseudo-Potential
VASP Vienna ab Initio Simulation Package XPS X-Ray Photoelectron Spectroscopy XRD X-Ray Diffraction
INTRODUCTION
Energy resources and their limitation are probably among the most concerning issues of the postmodern world in both scientific societies and political circles. Besides the limitation of fossil fuels as the main energy sources and rising trend of their price, environmental concerns, security and political sight push the scientists to look for an alternative energy resource. Although, since two decades ago, we see lots of progress in development of wind power, hydropower, solar energy, biomass, geothermal and fuel cells as renewable energy resources, some big challenges in the way of each of these technologies have led to this concern still remained unchanged.
Fuel cells, especially Polymer Electrolyte Membrane Fuel Cell (PEMFC), because of some of their exceptional properties, are among the most promising alternative energy sources. Like an internal combustion engine, a fuel cell uses some kind of chemical fuels; but like a battery, the chemical energy is directly converted to the electricity power, without a flame, combustion, noise or vibration and inefficient combusting step. There are different kinds of fuel cells but generally the mechanism to produce power is same except fuels, materials and operational conditions. Therefore, generally speaking, we can say that a fuel cell directly converts the chemical energy of a fuel into the electricity. Main components of a fuel cell are a cathode, an anode, and an ion conducting electrolyte. These parts are schematically shown for a PEMFC in figure 1-1. A fuel such as hydrogen is brought into the anode side and an oxidant, typically oxygen (and/or air), into the cathode side. The electrolyte assists as an obstacle to gas diffusion and electron, but will let ions transfer across it [1].
Therefore, two half-cell reactions occur at the anode and cathode, producing ions which can migrate across the electrolyte: the oxidation of hydrogen at the anode and the reduction of oxygen at the cathode for proton conducting electrolyte like PEMFC:
Cathode: ½ O2 + 2H+ + 2e- → H2O (1-1)
Anode: H2→2H+ + 2e- (1-2)
The flow of ionic charge through the electrolyte must be balanced by the flow of electronic charge through an external circuit, and this balance produces electrical power.
The Hydrogen Oxidation Reaction (HOR) in anode is relatively simple involving a single electron transfer process. While, in comparison, at the cathode side, Oxygen Reduction Reaction (ORR) is a complex four-electron transfer process. Therefore the HOR has lower oxidation over potential and a higher kinetic rate than the ORR, so that the ORR rates as measured by the standard state (298K, 1 bar) exchange current density on the cathode catalyst, is 6 orders of magnitude slower than that of its anodic part [3].
Presently, platinum (Pt) nanoparticle on carbon support (Pt/C) is conventional commercial electro-catalyst used in PEMFCs due to its high specific area. The carbon support spaces the Pt particles to prevent agglomeration and also because of high electrical conductivity it is a good current collector. However, the catalytic activity for the ORR is insufficient to obtain the required efficiency even with platinum (specifically in the potential range between 0.75 and 1.0 V ) and the cathodic over potential losses amount to 0.3 – 0.4 V [4, 5].
Therefore, to compensate this high over potential, a large amount of platinum should be used. But, on the other hand, low abundance of Pt natural resources and its high cost is a big obstacle in the future commercialization of PEMFCs. For this reason reducing the utilization of Pt catalyst by a greater dispersion of Pt particles and/or alloying with transition metals may be an appropriate way out. However, because the dissolution and deposition of extremely dispersed Pt particles in the electrolyte decrease the cell performance, the drastic reduction of Pt usage is impossible. But some researchers [6] have revealed that Pt-based alloys with transition metals exhibited higher activity than pure Pt for the ORR as they believed that the presence of the transition metal species changes the electronic structure of Pt, leading to a weaker interaction between the Pt surface and the unwanted Pt-OH intermediate. In this regard, Pt-M (M = Pd, Co,
Ni, Cr, Mn, and Fe) alloys has become attractive to ameliorate the catalytic activity and reduce the cost [4]. However, poor long-term stability due to the dissolution of these transition metals in acidic condition obstructs the practical application. Moreover, the leaching out of metal ions would contaminate the membrane and invalidate the fuel cell. In addition, oxidation of the carbon support during long-term operation brings the stability issue in general to the forefront of the research in this area. All these problems have encouraged the scientists to look for a non-noble catalyst and also a new support with high activity and durability in acidic condition, for more than two decades.
Transition metal nitrides which are well known as valve metals are used as anticorrosion and coating materials, and the group 4 and 5 metal oxides, like Ti, V, Nb and Ta oxides, have high chemical stabilities in acids [7-9]. Therefore, group 4 and 5 metal nitrides, oxides and oxy-nitrides are expected to be stable under an acidic and oxidative atmosphere. In addition it has been reported these compounds have some catalytic activity for the ORR [10-12]. Among them, titanium oxide (TiO2) is cost effective and has high stability in corrosive medium. Especially
compared to the presently being used carbon-supports, it has superior stability [13]. However, low electronic conductivity and small catalytic activity of TiO2 are its big drawbacks which
should be solved to make it an acceptable electro-catalyst or support of catalysts for PEMFCs. Considering the transition metal nitride’s more appropriate electrical conductivity properties, it seems that by producing a special composition of oxy-nitride of these metals, the best catalytic properties might be obtained. Finding the best composition of the transition metal oxide and its nitride, definitely in our case TiO2 and TiN, to achieve the best electrocatalytic activity of the
titanium oxy-nitride (TiON) for the ORR is the main topic of this thesis.
Undeniably having a fundamental insight into the reactions taking place on the electro-catalyst surface would help us to have a profound understanding of the phenomena, which in turn leads to design a more active electro-catalyst with our desired functionality. In this regard, first principal simulation (ab initio simulation) is a powerful tool to understand the ORR mechanism on the surface of these catalysts. Following the ORR steps on the catalyst surface proves that the surface electronic structure plays an important role in specifying reaction mechanism. Therefore, different catalyst facets of TiN, were analyzed from some basic parameters point of view such as: electronic structure, density of state (DOS), band structure, d-band width, work function and energy of the system.
CHAPTER 1
LITERATURE REVIEW – PART A: PEM FUEL CELL
The principal of the fuel cell goes back to 1839 when Sir William Grove, a British physical scientist, discovered the possibility of generating electricity from hydrogen and oxygen by reversing water electrolysis process. This principal remains unchanged today and generally speaking, a fuel cell is an electrochemical devise that continuously converts the free energy of the chemical fuels directly to the electricity, as long as fuel and oxidant are supplied. Therefore, a fuel cell has similarities to both batteries, because of their similar electrochemical nature of the power generation process, and to combustion engines which — unlike batteries — will work continuously so long as they consume a kind of fuels. Fuel cells are efficient and non-polluting electrical power generators. They have high theoretical performance and energy conversion efficiency, and therefore high power density, operational flexibility, in some case low operating temperature and low environmental impacts.
1.1 Fuel Cell General Application
It was after the early stages of space travel that fuel cells were used practically for the first time to generate electricity (and also drinking water) in the Gemini and Apollo programs (1950 ~ 1970). Afterward, nowadays, we imagine that fuel cells will finally come into extensive commercial use through three main applications:
1- Transportation applications
As mentioned above, a fuel cell directly converts the chemical energy of a fuel to the electrical energy. Hence, it has high energy conversion efficiency. In this way, it can help to decrease the consumption of primary energy and the emission of CO2. In addition, sulfur is
poison to all type of fuel cells and it must be separated from any fuel before feeding to the system; hence, no SOx are generated. On the other hand, because there is no combustion, no
NOx are generated as well. Therefore, the fact that fuel cells are almost zero emission,
inspired automotive companies to start (since 1980s) developing fuel cell powered cars and in particular buses. Among all types of fuel cells, PEM fuel cell is the most promising one for automotive applications because it has the highest volumetric power densities of all types and it is easily turned on and off. However, cost issue remains unsolved yet.
2- Stationary power generation applications
Automotive cost targets, led the other applications including stationary power, benefit from this development and the cheaper multipurpose power source — like Combined Heat and Power (CHP) system — become available. Also, maximizing the amount of electrical power made out of a certain plant and a certain quantity of fuel is the most important consideration for a commercial power generator. Fuel cell technology offers improvements with regard to the hours of operation per year — by reducing the need for maintenance — and the efficiency. Now, a larger number of companies produce fuel cells with possibility of the electricity generation for domestic or small commercial use (1–20 kW range). For instance, in the U.S. or many other developing countries, this type of applications of fuel cells as a remote power generator has found its place in the market, certainly in the location where grid connections are too expensive.
3- Portable applications
Portable fuel cells regularly include grid-independent applications such as traffic monitoring, demonstrators and toys, camping, yachting, auxiliary power units (APUs) for cars, backup solutions, battery replacements and so forth. Actually because the main motivation behind the past decades of fuel cell research and development (R&D) was the striving for the clean cars, portable application was always in the shadow of transportation application and was considered as a by-product of that technology. It is why this market is less well defined. However, looking at the automotive cost targets at $50 per kW, stationary targets at approximately $1000 per kW and portable targets beyond this amount, it seems that it is not reasonable that developers wait until the actual cost reaches the rock-bottom $50 per kW. So, presently, portable applications are most likely the fastest-growing commerce section for fuel cells.
1.2 Fuel Cell Types
Mainly based on the difference in the electrolyte type it is conventional to sort fuel cells in five different categories namely: Polymer Electrolyte Membrane (PEM) fuel cells, Alkaline Fuel Cell (AFC), Phosphoric Acid Fuel Cell (PAFC), Molten Carbonate Fuel Cell (MCFC) and Solid
Oxide Fuel Cell (SOFC). In addition to the different electrolyte, in each case we encounter different operating temperatures and pressures, different mobile ions, different fuels and consequently different applications. Sometimes somebody add also Direct Methanol Fuel Cell (DMFC) to this list, however from the electrolyte type point of view we can consider this one as a PEM fuel cell as well. The only difference between the conventional well-known PEM fuel cell (Hydrogen Fuel Cell) and DMFC is the feeding fuel to the anode side that is methanol in the later one instead of hydrogen in the earlier one. Table 1 shows all these fuel cell types with some of their important specifications.
Table 1-1: Specifications of different types of fuel cells ([14-16]) Fuel Cell
type
PEM FC
AFC
DMFC Hydrogen FC
Electrolyte Solid polymer membrane (Nafion®) Solid polymer membrane (Nafion®) Liquid KOH (30~50 % in H2O) immobilized Anode Reaction Cathode Reaction Mobile Ion Operating Temperature 0 ~ 60 °C 50 ~ 100 °C 50 ~ 200 °C Catalyst Pt – Pt/Ru Pt Pt Cell
Component Carbon-Based Carbon-Based Carbon-Based
Primary Fuel Methanol
Start-up Time Sec ~ min Sec ~ min ---
Power Density (kW/m3) ~ 0.6 3.8 ~ 6.5 ~ 1 Main Applications Portable Automotive, small CHP systems
Space vehicles, e.g. Apollo, Shuttle
Table 1-2(more): Specifications of different types of fuel cells
Fuel Cell type PAFC MCFC SOFC
Electrolyte
Liquid concentrated H3PO4 (100 %)
immobilized
Molten carbonate ( ) retained in a ceramic matrix
of LiAlO2 Yttrium-doped zirconium oxide (YSZ) ceramic Anode Reaction Cathode Reaction Mobile Ion Operating Temperature 150 ~ 220 °C 600 ~ 700 °C 700 ~ 1000 °C
Catalyst Pt Nickel Perovskites
(Ceramic)
Cell Component Graphite-Based Stainless based Ceramic based
Primary Fuel , , CO , , CO
Start-up Time Hours Hours Hours
Power Density (kW/m3) 0.8 ~ 1.9 1.5 ~ 2.6 0.1 ~ 1.5 Main Applications Large CHP systems (200 kW)
Medium to large scale CHP systems (up to MW)
Vehicle auxiliary power, all sizes of CHP systems (2 kW
to MW)
1.3 PEM Fuel Cell
Polymer Electrolyte Membrane fuel cell (PEMFC) — also called Proton Exchange Membrane fuel cell — differentiate itself from the other types of fuel cells in that PEMFC benefits use of a solid phase polymer film as the electrolyte (instead of corrosive aqueous acids or bases), which makes its assembly, usage and handling more easier than the other types, certainly for automotive and portable applications. Generally similar to all electrochemical systems, PEMFC contains two
cathode and anode electrodes and a separating electrolyte between them. Two electron conductive electrodes are porous gas diffusion layers with a thin catalyst layer on their interface with the membrane. These components which compose the heart of a PEMFC are called all together a Membrane Electrode Assembly (MEA) (figure (1-1)).
Figure 1-1: Different parts of a MEA
When a PEMFC contains only one cathode and one anode (consequently only one MEA), is called single PEMFC. According to the related half reactions, in a single PEMFC the operating voltage is less than 1 volt, which under a given current this voltage is even less. For a state of the art single PEMFC a current density of 1 Amp/cm2 should be obtained at 0.6 volt. This voltage is far from enough to power a vehicle. Therefore, couple of these single PEMFCs should be assembled into a stack PEMFC. In this case, current collectors are bipolar plates where they contain almost 90 % of the volume and 80 % of the mass of a fuel cell stack. Bipolar plates are designed to be anode for one cell in one side and at the same time cathode for the adjacent cell on the other side. They should be very good electrical conductor and impermeable for the reactant gases. Their complex design and these specific properties make the bipolar plate as the most expensive part of the stack fuel cell. There are some challenging discussions related to the distribution of the reactant gases (flow field design in different manner such as: serpentine, parallel or interdigitated models), having a uniform pressure of the reactant gases and stack temperature controlling which are out of the scope of this thesis. In the following section, we talk a little bit more about the most important parts of a PEMFC, the MEA and its components.
1.4 Membrane Electrode Assembly
As already mentioned, MEA as the heart of PEMFCs is formed of an ion conducting electrolyte (which is in fact a solid membrane), two gas diffusion layers (GDL) in both sides and a cathode and an anode thin catalyst layer (CL) in interface of the membrane and gas diffusion layers. These components are sandwiched together under a certain temperature, pressure and hot pressing time. These operating conditions play an important role in achieving high-performance MEA. For instance in the case of using the Nafion polymer as the membrane and the Nafion ionomer as the binder in catalyst layer, it is necessary to increase the temperature to recast the ionomer by melting and let it to contact with both the catalyst and the membrane to increase the catalyst utilization and to decrease the ionic resistance. On the other hand, increasing the temperature to more than 125 °C (which is the glassy point of Nafion polymer) decomposes the membrane and dramatically reduces the PEMFC’s efficiency. High pressing time also leads to lose the membrane water retention properties. Usually there is an optimum time to have the highest ionic conductivity and three phase reaction area, which after that these properties reduce again. Applied pressure normally depends on the mechanical strength of the gas diffusion layer and its thickness and porosity. One has to measure the total resistance of the MEA while increasing the pressure; the best pressure is at the point that the lowest resistance is achieved [17]. In this thesis operating condition to prepare MEAs was 1~1.5 Kg/cm2 pressure and the temperature of 110 °C for 4 minutes.
In general there are two modes to make MEA which are depicted schematically in figure (1-2). The first mode is that the catalyst layer is printed to the gas diffusion layer, followed by pressing on the membrane (figure (1-2-a)) [18]. This method is also called separate electrode method. In the second way, at first we prepare the catalyst coated membrane (CCM) so that the catalyst layer is directly applied to the membrane followed by adding the gas diffusion layers to both sides (figure (1-2-b)) [19, 20]. In this method pressing is not as crucial as the first method. In this thesis the first mode is the method of choice to prepare the MEA.
To printing the CL on the GDL or membrane there are different methods which are precisely explained in the literature. Here in this part we just address some of those methods in each mode. For the first mode depicted in figure (3-a) we have: Spreading, Spraying [21], Catalyst powder deposition [22], Ionomer impregnation and Electro-deposition methods [23]. We followed the
spreading method in which the catalyst ink was spread on a carbon cloth or carbon paper and then exposed to room temperature to evaporate the solvent. In the second mode depicted in figure (1-2-b) we have: Impregnation reduction [24], Catalyst decal transfer [19, 20], Evaporative deposition [24], Dry spraying [25] and Painting [26] methods.
(a) (b)
Figure 1-2: MEA preparation modes (a): separate electrode method and (b): catalyst coated membrane method [27]
1.4.1 Membrane
The main function of a membrane as the electrolyte in PEMFCs is proton conducting from the anode side to the cathode side. In addition it must separate the fuel and oxidant to prevent the mixture of the gases; it must have a high resistivity for electron transferring, flexibility, strength, chemical and thermal stability, availability and low cost [27]. Although different companies produce different membranes with their own special tricks, which historically we see some important of them in table 2, a common theme in all of them is the use of perfluorosulfonic acid (PFSA) [14]. These hydrophilic ionic groups (sulfonic) are the key for allowing proton passage across the membrane. Ion transport is highly dependent on the free water associated with those groups. So that the ion conductivity increases with the water content up to a point and after that due to diminish of the concentration of protons it decreases. Therefore, moisturizing the membrane is a key to allow ion transport; however on the other hand it limits the operating temperature of the PEMFC. So, systems for thermal and water managements in the cells and
MEAs play an important role to have an efficient operation of the PEMFC [16]. The conductivity of a well-humidified PFSA membrane can be as high as 0.2 S.cm–2.
Table 1-2: Different types of hierarchically created polymer electrolyte membranes [27]
Name or structure Description about life time
1 Phenol-formaldehyde sulfonic acids Extremely week and hydrolyzed easily
2 Membranes with a partially sulfonated polystyrene backbone
Short life time (200 hours)
3 “D” membranes, manufactured by grafting
styrene-divinylbenzene into a fluorocarbon matrix, followed by sulfonation
500 hours
4 αββ-trifluoro styrene sulfonic acid Better chemical and thermal stability, but poor physical properties
5 Triethyl phosphate plasticizer to combine polyvinylidene fluoride with the trifluorostyrene sulfonic acid polymer
5000 h
6 Fluorocarbon matrix grafted with trifluorostyrene 10000 h
7 membrane composed of trifluorostyrene and substituted trifluorostyrene copolymers
15000 h
8 Nafion® created by the DuPont® company The most widely used one (high stability and long life time)
9 Membrane created by the Dow® Chemical Company
Similar to the Nafion with shorter side chains (better performance but higher price)
Although, due to a smaller thickness (down to 50 µm), the membrane manufactured by Dow® Chemical Company shows better performance, because of the lower cost and ease of fabrication, Nafion® is presently the most widely used membrane, even though it is still quite expensive to allow commercialization [28]. Nafion resembles Teflon structure. It is a copolymer of
tetrafluoroethylene and sulfonyl fluoride vinyl ether. This structure gives a long-term chemical and thermal stability. Figure (1-3) shows the general structure of the Nafion membrane.
Figure 1-3: Structure of Nafion membrane [27]
In general, the life time of the PEMFC is determined by the life time of its membrane. Although, a thinner membrane improves the performance efficiency by increasing the ion conductivity, due to higher gas permeability and more gas crossover and consequently more degradation, life time of the membrane decreases dramatically. In addition, a thickness smaller than 50 µm (which is the rock-bottom), leads to have lower physical strength [27]. In practice, one needs to treat the membrane before using that. In this regard we followed the standard procedure of treating in H2O2 3% and then in H2SO4 1 M for 1 hour each at 80 °C, followed by washing with boiling
deionized water for 1 hour after each step. Hydrogen peroxide is normally used to remove all organic contaminant, while sulfuric acid is used to sulfonate the membrane.
1.4.2 Gas Diffusion Layer
Gas diffusion layer (GDL) is typically carbon based material such as carbon cloth or carbon paper. This layer is in fact a mechanical support for the catalyst layer sandwiched between itself and the membrane. It should also provide an electrical pathway for the electrons and a porous pathway for the reactant and product gases. Having all these properties together is a characteristic of carbon which makes it the best candidate for this mission. As already mentioned existence of the water in membrane and feeding gases is crucial to keep the MEA’s efficiency at the highest value, but GDL should be able to facilitate the excess water removal ― especially in the cathode side ― to avoid the gas channel blockage and catalyst occupation. In this regard utilized carbon cloth or carbon paper must be treated by a hydrophobic material such as Polytetrafluoroethylene (PTFE) [28]. Thickness of GDL is almost around 1 mm. It is obvious that the smaller thickness, the smaller ohmic drop.
1.4.3 Catalyst Layer
Catalyst Layer (CL) is a very thin layer (ca. micro meter) where the reactions take place on. Based on the heterogeneous electrochemical reactions explained in equations (1-1) and (1-2) it seems clear that there is a need to a three phase boundary (TPB) that brings electrons by an electrical conductive material, reacting gases through a porous volume and reacting ion through a ionic conductive material. Therefore, this layer mainly includes a catalyst — in which the molecular bond in the diatomic gaseous reactant molecules break down — and ionic conductive binder and hydrophobic material that are typically mixed together by a solvent. This mixture that is called in general catalyst ink should be printed on the GDL or the membrane by different methods explained in the previous sections. Because of the low temperature operating condition of PEMFCs it is necessary to use a catalyst to overcome the activation energy of the reaction. To avoid the catalyst agglomeration and consequently loss of a big portion of active surface area, it is necessary to disperse the catalyst on a big surface area material. The early use of platinum as the most conventional catalyst was around 28 mg/cm2 but now dispersing very small Pt particles on a big surface area carbon powder reduces its utilization down to 0.1 mg/cm2. Carbon powders such as Vulcan XC-72 are among the well-known commercial supports which provide the uniform dispersion of catalyst particles; however, homemade titanium oxy-nitride also was used in this thesis as the catalyst support.
Besides having a big surface area and being electrically conductive, chemical and electrochemical stability of the catalyst support is very important. Although carbon powders provide both high surface area and conductivity, at potentials greater than 1 volt vs. RHE1 it starts to oxidize. Oxidation of carbon support leads to catalyst agglomeration and losing the catalyst utilization. In this regard, one part of this project was devoted to stability study of the titanium oxy-nitride as an alternative catalyst support compared to the conventional carbon supports. Catalyst location in interface of the GDL and the membrane is also an affecting parameter which determines the rate limiting factor regarding to the ohmic drop or ionic drop. For instance, for non-porous catalyst layer gas diffusion is a limiting factor and results a big ohmic drop, so the
catalyst must be as close as possible to the GDL. Inversely, whit porous catalyst layer, it is the ionic drop which limits the reaction rate and to improve the performance catalyst should be close to the membrane. Therefore, having a thin and porous catalyst layer with preferential location of catalyst close to the membrane, one achieves the optimal catalyst utilization.
Existence of ionic conductive binder is essential to let the arriving protons from the anode to the interface of cathode and membrane reach the reaction site on the catalyst surface. However, unlike the membrane this material should be permeable for the reacting gas [29-31]. Perfluorosulfonate acid (PFSA) ionomer is normally added to the catalyst ink to provide the media of proton and reactant passage. To repel the condensed water from the catalyst surface at the cathode side and avoiding the catalyst surface occupation and also blockage of the gas transport channels, usually a hydrophobic material such as Polytetrafluoroethylene (PTFE) is also added to the catalyst ink [32, 33].
The ratio of the catalyst, binder, solvent and etc. in the catalyst ink affects the gas permeability, catalytic activity and ionic conductivity which is investigated by Sasikumar [34] and Song [35]. Therefore, to summarize, to achieve a high performance of a PEMFC it is essential to prepare a CL which provides: large three phase interface, easy proton transportation, efficient gas diffusion, easy removal of water and continuous electron passage [27].
1.5 Hydrogen Oxidation Reaction
The Hydrogen Oxidation Reaction (HOR) also called Hydrogen Evolution Reaction (HER) is a simple reaction which takes place at the anode side of the PEMFC to generate electrons. This reaction is widely studied and according to the acidic or alkaline medium in which it occurs there are different mechanisms, however, because of our working condition here just those related to the acidic medium are explained. The general form of the HOR is mentioned in equation (2-1) followed by the suggested sequential mechanism in equations (2-2) to (2-4):
Anode general reaction: (2-1)
Atomization step (Tafel reaction): (2-3)
Desorption step (Volmer reaction): (2-4)
First of all the hydrogen molecule should diffuse through the ionic conductive ionomer (for example PFSA) to the catalyst surface, then it must adsorb on the catalyst surface to form adsorbed hydrogen molecule. The hydrogen-hydrogen bond will be broken to have adsorbed atomic hydrogen on the catalyst surface. This step is well known as the Tafel reaction. Later, via the Volmer reaction this adsorbed atomic hydrogen turns to the proton by releasing an electron. At desorption step this proton starts to migrate through the ion conductive materials to the other side of the membrane. The step that is the slowest one is the rate determining step (rds). There are also other suggested mechanisms such as that offered by Heyrovsky which we address you to study them in the literature [27].
Platinum is the most common used catalyst in the anode side to accelerate the HOR. Although, it constraints the feeding hydrogen purity because of its low tolerance to carbon monoxide. Carbon monoxide which acts as a toxic for platinum may exist in hydrogen (generated by steam reforming of hydrocarbon, certainly natural gas CH4). It makes a strong bond with platinum
through a bridge-bonding and drastically decreases the number of platinum active sites for the HOR. Also, because of electron capturing by CO and dipole interaction it lowers the activity of the remaining uncovered sites. To overcome this problem and increase the catalyst tolerance to CO, alloying platinum with other transition metals seams a good way out. In this regard different Pt-M binary alloys (M = Ru [36-38], Sn [39], Rh [40], Mo, Ni [41], Re [42], etc.) were investigated. The second metal either by lowering the adsorption of CO or by catalyzing the CO oxidation at lower potential — both because of the electronic structure modification — improves the catalyst tolerance to CO and consequently its performance. Among them Pt-Ru is the most well known to be used as the anode electrocatalyst [27].
1.6 Oxygen Reduction Reaction
Oxygen reduction reaction (ORR) is a multi-electron reaction taking place in the cathode side with two main possible pathways in acidic aqueous solution: one pathway involves the transfer of 2e− to produce hydrogen peroxide (H2O2), and the other is production of water via a direct
4e− transfer. In acid media which is operating condition of PEMFCs, these two pathways are mentioned in equations (2-5) to (2-7) and also is depicted schematically in figure (1-4) [43]:
Direct 4-electron pathway: (2-5)
2-electron pathway:
(2-6)
(2-7) The ORR kinetic is very slow and needs a catalyst to facilitate the reaction by changing the mechanism. A desired catalyst would reduce oxygen molecules to water via the 4-electrons pathway, because an incomplete reduction of oxygen to hydrogen peroxide through 2-electrons route leads to low energy conversion efficiency. In addition hydrogen peroxide further decomposes to harmful free radical species which degrades the ionic conductive materials [44]. The 2-electron pathway is usually used to produce hydrogen peroxide in industry.
Figure 1-4: Schematic mechanism for 4e- and 2e- pathways
Presently, platinum based materials are the most practical catalysts and certainly, platinum nanoparticle supported on carbon (Pt/C) is accepted commercial electro-catalyst used for the
ORR in PEMFCs. According to the experimental and also theoretical study [45-47] of the electronic structure of platinum — using the Density Functional Theory (DFT) — the ORR on platinum is typically explained by two dissociative and associative mechanisms including electron transfer steps and chemical steps. Dissociative mechanism which is more probable at a low current density leads to a 4e− pathway; while associative mechanism which is more plausible at a high current density causes a 2e− pathway. Each process may contain a few individual steps which are explained separately in the following sequential equations.
Dissociative mechanism: (2-8) (2-9) (2-10) Associative mechanism: (2-11) (2-12) (2-13) (2-14) (2-15)
Platinum active sites are denoted by star . In these two suggested mechanisms which are implicitly explaining the figure (1-4) there is no H2O2 product. However, in the associative
mechanism, if the O-O bond not be broken in equation (2-13) this step might be turned to produce H2O2, although the H2O2 could be further reduced to water.
In each of these mechanisms, because of surface geometry and also molecule configuration, one may encounter different possibilities of molecular adsorption. For instance, there are three adsorption models for molecular oxygen adsorption depicted in figure (1-5) [47]:
Griffiths model: O2 interacts with two bonds on a single surface atom
Pauling model: end-on adsorption of O2 through a single bond
Yeager model: bridge-like adsorption with two bonds interacting with two sites
Figure 1-5: Oxygen adsorption models: (a) the Griffiths model, (b) the Pauling model and (c) the Yeager model[47]
These different states have been considered during the calculation; however, the Yeager model approached us to a more stable condition in adsorption than the two other models. Before going through this issue more deeply and unfolding the catalyst effect, types and related problems, it is necessary to explain some theoretical background in electrochemistry and measuring techniques in brief. Following sections are devoted to this matter.
1.7 Theoretical Background
As it is obvious from the explained dissociative or associative mechanisms there are different chemical and electron transfer steps in the way of reaction progress. In both cases the rate of each step is of importance because it determines the rate determining step (rds). Chemical reaction kinetic is well defined in all reaction engineering textbooks, in which the rate of the reaction corresponds to the concentration of the reactants. But, in electrochemical reaction this is a little complex in which one has to consider the electrode potential as well. It seems clear that there is a straightforward relation between the reaction rate and the current in electrochemical reactions. However, it is important to find the relation of the current and the applied potential to complete
this puzzle. A simple form of this relation, when there is no mass transfer effects (well stirred solution and low current density), is well known as the Butler-Volmer equation, which describes the current-potential relationship in each sides (cathode and anode) of a typical electrochemical cell [48]:
(2-16)
where, , , , n, F, R and T are the over potential, the exchange current density, transfer coefficient, electron transfer number, Faraday’s constant, universal gas constant and temperature, respectively.
The exchange current density ( ) is defined as the current while the reaction is in equilibrium; so that the forward and backward reaction rates are similar and there is no net current [48]. Therefore, this value is an indication of reaction rate in one direction at equilibrium and apparently the higher exchange current density, the higher reaction rate. This value mostly depends on the type of the reaction and catalyst (electrode surface), in addition to the reactant concentration, electrode surface area and temperature. For instance, exchange current density of the HOR is 6 orders of magnitude faster than the ORR. As well, this value for the ORR is higher on a platinum electrode than that on a gold electrode. Furthermore, increasing the electrode surface area, temperature and also species concentration at the catalyst surface, increases the value of exchange current density. Exchange current density of the ORR on Pt surface (interface with Nafion) at 30 ºC is approximately 2.8 [49]. To achieve these optimum conditions there are different techniques in selecting and producing catalyst which will come in the next upcoming sections.
Over potential ( ) is the deviation of the equilibrium potential (which is obtained by the Nernst equation). Therefore, the Butler-Volmer equation describes the relation between the obtainable current while an over potential is applied to the electrode. In the case that the value of this over potential is very high (could be either negative for cathode or positive for anode) one of the two
terms in the equation (2-16) will be negligible. For the cathode side reaction it could be simplified to the equation (2-17):
(2-17)
Rearranging this equation gives us:
(2-18)
Assuming
(2-19)
(2-20)
Then equation (2-18) will be simplified to:
(2-21)
This equation is the well-known Tafel equation [48], which tells us that in a certain current density range, over potential is linearly dependent on the logarithm of the current density. The exchange current density can be obtained from the intercept at the current density axis. The slope of the line is called the Tafel slope. The higher the Tafel slope, the slower the reaction kinetics. Relatively same equations might be derived for the anode side reactions; just the Tafel slope for cathode side is negative, when it is positive for the anode side. For the ORR, mostly two Tafel slopes have been reported in literatures: 60 mV/dec and 120 mV/dec, depending on the electrode materials used and on the potential range. It reveals the dependency of the reaction mechanism on both the properties of the catalyst and also working potential.
At a small over potential, the Butler-Volmer equation can be simplified as:
(2-22)
Therefore, we have:
(2-23)
Where is the charge transfer resistance (or polarization resistance), which refers to the barrier across which the electrons passes from the electrode surface to the adsorbed species or vice versa. The resistance is related to the electrode potential, or more precisely, to the over potential. It is a very important kinetic parameter, describing the speed of the electrode reaction. It can be obtained by AC electrochemical impedance method.
1.8 Electrochemical Measuring Techniques
Cyclic Voltammetry (CV), Polarization, Rotating Disk Electrode (RDE) and Electrochemical Impedance Spectroscopy (EIS) are the most frequently used techniques to study the ORR, which were widely used in this thesis.
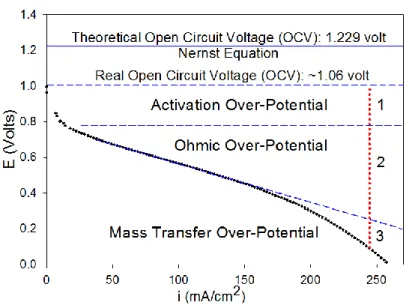
In polarization test, in fact we acquire the responding current density at different potentials from the open circuit voltage to zero. This can be obtained by holding potential of electrode at a certain point and recording the stable current response (steady state polarization) or by slowly sweeping the potential and recording the corresponding currents. The obtained curve (I-V curve) is a characteristic curve to compare the efficiency of different catalysts for the ORR under different circumstances. We can get the Tafel Slope and exchange current density from this curve. Figure (1-6) shows a typical polarization curve of a PEMFC with Pt catalyst at 30 °C.
Figure 1-6: Polarization curve of the ORR on Pt catalyst at 30 °C
Theoretically the open circuit voltage (OCV) of a fuel cell should be around 1.229 volt vs. RHE. However, in reality, as depicted in figure (2-6), the OCV is less than this amount (~ 1.06 volt vs. RHE in the case of Pt). This is because of mixed potential. In fact, the ORR voltage (1.229 volt vs. RHE) is high enough to oxidize the catalyst surface. In the case of platinum, this oxidation takes place at 0.88 volt vs. RHE. Equation (2-24) shows this oxidation reaction:
(2-24)
Therefore, the real OCV comes from a mixture of this reaction with 0.88 volt and the ORR with 1.229 volt (average ~ 1.06 volt). So, the surface of catalyst is exposed to change with potential changing and an important point inherent in this surface change is that the reaction, for example ORR, will show different behavior at different potential because of this surface change. In preceding sections we mentioned different Tafel slope for the ORR at different potential ranges. Now, it is clearer that because of existence of PtO at a high potential, reaction mechanism is different from that at a low potential, when the reaction takes place on a pure Pt surface. Figure (1-6) also demonstrates voltage lose areas: activation over-potential, ohmic over-potential and mass-transfer over-potential.
Undoubtedly, Cyclic Voltammetry (CV) is the most convenient and useful technique in all electrochemical experiments to study the system qualitatively and quantitatively. In this technique, potential is swept linearly between two points and simultaneously the corresponding