INTERACTIONS ENTRE LE PEUPLIER FAUX-TREMBLE ET L'ÉPINETIE NOIRE EN FORÊT BORÉALE DE L'OUEST DU QUÉBEC
MÉMOIRE PRÉSENTÉ
COMME EXIGENCE PARTIELLE DE LA MAÎTRISE EN BIOLOGIE
PAR
GUILLAUME SAINTE-MARIE
Service des bibliothèques
Avertissement
La diffusion de ce mémoire se fait dans le respect des droits de son auteur, qui a signé le formulaire
Autorisation de reproduire et de diffuser un travail de recherche
de cycles supérieurs
(SDU-522 - Rév.01-2006). Cette autorisation stipule que «conformémentà
l'article 11 du Règlement noa des études de cycles supérieurs, [l'auteur] concèdeà
l'Université du Québecà
Montréal une licence non exclusive d'utilisation et de publication de la totalité ou d'une partie importante de [son] travail de recherche pour des fins pédagogiques et non commerciales. Plus précisément, [l'auteur] autorise l'Université du Québecà
Montréalà
reproduire, diffuser, prêter, distribuer ou vendre des copies de [son] travail de rechercheà
des fins non commerciales sur quelque support que ce soit, y compris l'Internet. Cette licence et cette autorisation n'entrainent pas une renonciation de [la] part [de l'auteur]à
[ses] droits moraux nià
[ses] droits de propriété intellectuelle. Sauf entente contraire, [l'auteur] conserve la liberté de diffuser et de commercialiser ou non ce travail dont [il] possède un exemplaire.»Ce mémoire de maîtrise est formé d'un chapitre rédigé en anglais sous forme d'article scientifique. Je suis l'auteur principal de cet article et j'ai réalisé la récolte et la compilation des données, de même que les analyses statistiques et la rédaction de l'article. Alain Leduc et Yves Bergeron ont conçu le projet initial et ont élaboré avec moi le design expérimental alors que Michael J. Papaik a collaboré avec moi aux analyses statistiques. L'unique article de ce mémoire, intitulé «Tree growth response to trembling aspen proximity in eastem canada black spruce-feathermoss forest», est en préparation pour soumission à Ecological Applications.
Je souhaite d'abord remercier mes directeurs Alain Leduc, pour sa disponibilité, son expertise et le temps qu'il m'a toujours accordé de bon cœur et Yves Bergeron, qui mérite toute mon admiration pour son efficacité et sa grande vision. Je n'oublie pas la générosité et l'aide de mon collaborateur Mike Papaik, sans qui ce projet n'aurait véritablement jamais eu lieu. Merci aux professionnels de la chaire AFD et du CEF: Mélanie Desrochers, Danielle Charron et Daniel Lesieur pour tous les services rendus sur le terrain et
à
Montréal. Merci Mélanie pour ta présence qui a su faire une différence pour moi et plusieurs autres étudiants. J'aimerais également remercier ma famille: mon frère Maxime, avec qui j'ai partagé de nombreuses heures de travail dans les cafés de Montréal et mes parents, qui m'ont toujours supporté. Ensuite, mes collègues et amis qui m'ont épaulé pendant ces dernières années: Simon, Éric, Dave, Maryse, Nicolas, Jean-Philippe, Élizabeth, Sara et Conny. Je remercie mes aides de terrain Jacinthe et Josée-Anne qui m'ont permis de vivre une expérience pour le moins enrichissante. Merci aux organismes subventionnaires, en particulierà
la chaire AFD et ses partenaires pour ses initiatives et son dynamisme. Finalement, j'accorde le dernier remerciement mais non le moindreà
Guillaume qui m'a accueilli à bras ouverts et qui a été là pour moi à chaque fois que j'en avais besoin.LISTE DES FIGURES vii
LISTE DES TABLEAUX ix
LISTE DES ÉQUATIONS xi
RÉSUMÉ xiii
INTRODUCTION GÉNÉRALE 1
Rôle du peuplier faux-tremble en pessière 2
Coexistence et complémentarité en forêt mixte 3
Analyse de voisinage 5 Objectif et hypothèses 6 Chapitre 1 9 1.1 RÉSUMÉ 11 1.2 Abstract 12 1.3 Introduction 13 1.4 Methodology 15 1.4.1 Study area 15 1.4.2 Sampling design 16
1.4.3 Tree growth and competition models 18
1.4.3.1 Potential growth estimation 20
1.4.3.2 Spatially-explicit analysis of tree competition 20
1.4.3.2.1 Shading effect modeling 21
1.4.3.2.2 Crowding effect modeling 22
1.4.4 Model selection and evaluation 24
1.4.5 Stand-Ievel considerations 25
1.5 Results 26
1.5.1 Range of conditions covered by sample set 26
1.5.2 Spatial analysis of tree growth 30
1.5.2.1.1 Shading effects 34 1.5.2.1.2 Effects of neighbouring tree size and distance 35 1.5.2.1.3 Relative magnitude of interspecific and intraspecific crowding 36 1.5.2.1.4 Competitive response of target trees to crowding 37
1.5.2.2 Hypothetical average neighbourhoods 37
1.5.2.3 Stand-Ievel inference 41
1.6 DISCUSSION 43
1.6.1 Competitive vs. positive effects of trembling aspen presence 43
1.6.2 Stand-Ievel considerations 44
1.6.3 Spatially-explicit interactions 46
1.6.4 Management implications 47
CONCLUSION GÉNÉRALE 51
Contexte spatial 52
Répercussions pour l'aménagement forestier 53
APPENDICE 55
Model performance and evaluation 55
Use of best and multi model inference 56
Growth and environmental gradients 57
Black spruce allometry calculation 62
Target tree size impact on potential growth 65
Figure 1.1 : Figure 1.2 : Figure 1.3 : Figure 1.4 : Figure 1.5 : Figure 1.6 : Figure 1.7 : Figure A.l : Figure A.2 : Figure A.3 : Figure A.4 : Figure A.5 : Figure A.6 :
Model structure and hypotheses 19
Soil organic matter depth distribution along neighbourhood mixture
gradient 30
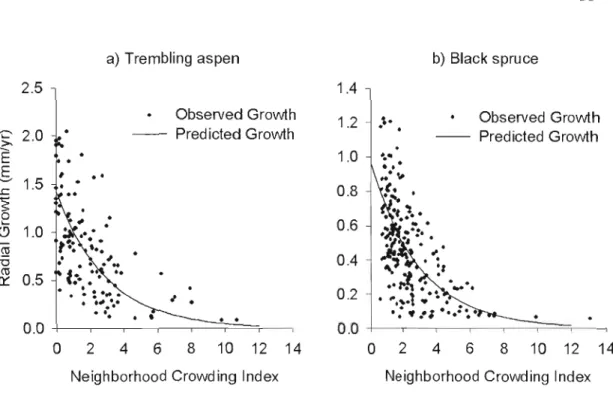
Distribution of observed growth with neighbourhood competition index (Nel) using a) trembling aspen best model and b) black spruce
best crowding only model 35
Tree species and abundance effect on growth of trembling aspen (a) and black spruce (b) according to averaged parameter estimates
(MMI) 39
Black spruce potential growth variation with neighbour species according to averaged parameter estimates (MMI)
size and 40 Predicted black spruce and trembling aspen radial
mixture gradient within an average neighbourhood
growth along 41 Total neighbourhood standing volume variation along species mixture
gradient 42
Observedjpredicted slope for trembling aspen (a) and black spruce (b)
selected best models 55
Effect of best influence
vs. multi-model inference on neighbour abundance 56 Neighbourhood shade percentage as a function of targetjneighbour height ratio for trembling aspen (a) and black spruce (b) 57 Tree size distribution for (a) trembling aspe n, (b) black spruce, (c) ail trees and (d) tree abundance distribution with trembling aspen
percentage 59
Mean annual radial growth distribution and standard errors for the
1996-2005 period 60
Mean radial growth evolution for 1996-2006 period in relation with local drought code. Gray zone represents growth years used in study ... 61 Figure A.7 : Allometry relationships for black spruce height, crown length and
crown radius {data from Lambert et al. 2005 and Ouellet 1983) 64 Figure A.8 : Observed radial growth distribution as a function of target tree DBH 65 Figure A.9 : Radial growth distribution along tree size gradient using permanent
plots data 66
Table 1.1 : Summary statistics of inventory plots 16
Table 1.2 : Summary statistics of sampled neighbourhoods 28
Table 1.3 : Trembling aspen statistics for asymmetric crowding model 29
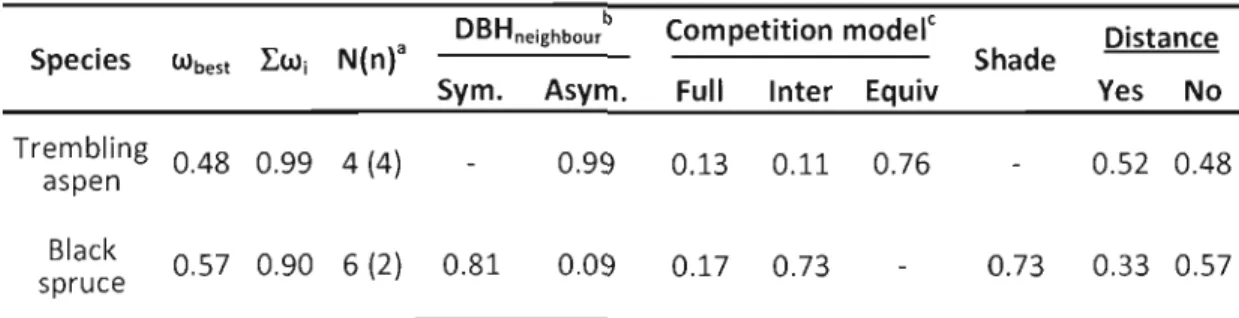
Table 1.4 : Comparison of alternate models using AICc 31
Table 1.5 : Models included in the prediction set (support based on the relative
weight of evidence) 32
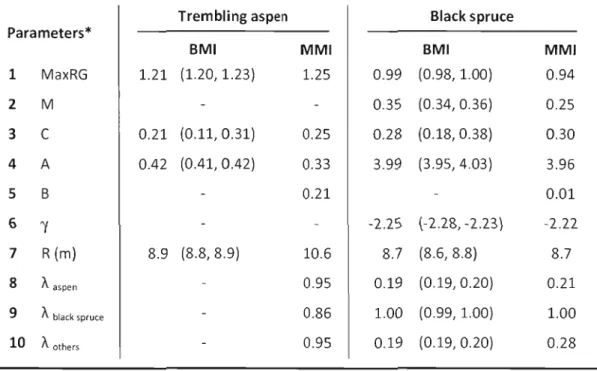
Table 1.6 : Parameter estimates and support intervals from the AICc best model
inference (BMI) and multi-model inference (MMI) 33
Table A.l : Parameter estimates for trembling aspen and black spruce allometric
Équation 1.1: Full model. 20
Équation 1.2: Shading effect 2l
Équation 1.3: Full crowding (Nel) model 22
Équation 1.4: Asymmetric crowding model 24
Équation 1.5: Parameter averaging using Akaike weight 25
Equation A.1: Tree height (in meters) 62
Equation A.2: Tree crown radius (in meters) 62
En forêt boréale de l'est du Canada, les pessières à mousses sont souvent pourvues de peupliers faux-trembles qui s'y retrouvent parsemés en petits 'j'lots. Ces pessières sont alors aménagées de manière à confirmer leur vocation principale, en tentant de réduire du mieux possible la présence de tremble lors des pratiques d'éclaircies précommerciales. Bien que des études suggèrent qu'à long terme, le peuplier faux-tremble pourrait augmenter le rendement de ces pessières en limitant l'accumulation de matière organique au sol, des inquiétudes persistent quant à son effet compétitif sur la croissance des épinettes à court et moyen termes.
Cette étude cherche donc à quantifier et préciser les interactions compétitives entre le peuplier faux-tremble et l'épinette noire en mesurant leurs effets sur la croissance radiale. Ces interactions sont étudiées à l'échelle de l'arbre, de manière à évaluer plus spécifiquement l'importance de l'espèce, la taille, la distance, la position et l'abondance des voisins sur la croissance. Plus précisément on cherche à déterminer si (1) la croissance radiale d'une épinette noire mature serait meilleure en présence d'un peuplier faux-tremble que d'une épinette noire voisine, (2) la croissance radiale d'un peuplier faux-tremble mature serait meilleure en présence d'un peuplier faux-tremble que d'une épinette noire voisine, (3) la présence de peupliers faux-tremble en pessière dite « pure» ne diminuerait pas le volume total d'épinette noire dans un voisinage et (4) ni la distance, ni la position des voisins n'influenceraient la croissance radiale des arbres matures dans ces forêts.
Une analyse de compétition est effectuée à partir de la croissance radiale de 373 arbres témoins, répartis sur 122 placettes. Le modèle estime la croissance radiale potentielle maximale et distingue les effets de la compétition pour la lumière de ceux découlant de situations de surnombre. Les hypothèses sont représentées sous forme de modèles alternatifs, créés en retirant certains paramètres du modèle complet. La sélection de modèle, qui utilise les techniques de vraisemblance maximale combinées à la théorie de l'information permet de tester plusieurs hypothèses simultanément et de les comparer entre-elles.
Le meilleur modèle pour l'épinette noire inclut un effet d'ombrage spatialement explicite, mais également un effet de densité indépendant des distances. Celui du tremble exclut quant à lui toutes composantes spatiales mis à part le rayon de voisinage. Les résultats montrent qu'une épinette noire est jusqu'à 4 fois moins affectée par le voisinage d'un tremble que celui d'un congénère de même taille. La dominance des trembles sur les épinettes entraîne cependant certains effets négatifs sur la croissance de ces dernières, particulièrement en tremblaie dite pure. Donc la croissance radiale optimale de l'épinette noire est atteinte en milieu mixte, où les proportions de tremble et d'épinette noire sont équivalentes et où la dominance des trembles est réduite.
La croissance des trembles est quant à elle favorisée en tremblaie pure, où les faibles densités lui sont favorables. Les analyses laissent présager la présence d'un certain effet améliorant du tremble sur la croissance des arbres en pessière. En termes de rendement, on observe un effet additif de ces deux essences; c'est-à-dire qu'on peut ajouter jusqu'à 3D % de tremble dans le peuplement sans diminuer le volume total d'épinette noire.
MOTS-CLÉS: Compétition, épinette noire, peuplier faux-tremble, forêt boréale, ana lyse de voisinage.
En forêt boréale de l'ouest du Québec, les pessières
à
mousses sont souvent pourvues de peupliers faux-trembles (Populus tremuloides (Michx.)) qui s'y retrouvent parsemés enpetits îlots. Ces pessières sont alors aménagées de manière à confirmer leur vocation principale, en tentant d'éliminer du mieux possible la présence de tremble. De même, la valeur économique associée au tremble reste inférieure
à
celles d'autres espèces boréales telles que l'épinette noire (Picea mariana (Mill) B.S.P.) (Pearce 1989). Cette situation donnelieu
à
des pratiques sylvicoles simplifiant les structures et compositions naturelles des peuplements forestiers (McDougaIl1988; Nichols et al. 2006; O'Hara et al. 1994), telles que les éclaircies précommerciales qui éliminent une importante proportion de tremble dans les jeunes peuplements résineux. Pourtant, des recherches tendent à démontrer qu'il existerait un gain en productivité associéà
l'aménagement mixte de certaines espèces (Kelty 1992; Légaré et al. 200Sa; Loreau et al. 2001; Paré and Bergeron 1996) et encouragent, dans certains cas, le maintien d'espèces de début de succession dans l'aménagement (Connell and Slatyer 1977).L'industrie forestière priorise traditionnellement les peuplements équiennes et monospécifiques pour une question de simplicité opérationnelle (Kelty 2006; MacPherson et al. 2001; Nichols et al. 2006; O'Hara et al. 1994; Rothe and Binkley 2001). Or, les avantages potentiels reliés à la présence de feuillus en forêt résineuse ne manquent pas: amélioration des conditions de sol, abris pour la régénération, réduction des risq ues d'attaque d'insectes, amélioration de la stabilité au vent (Kelty 1992; Man and Lieffers 1999; Nichols et al. 2006) et amélioration de la productivité et de la rentabilité. Cette simplification de la composition des pessières affecterait également la biodiversité végétale et faunique (Cannell 1999; DeByle 1989a, b; O'Hara et al. 1994). Le maintien de la composante feuillue en forêt boréale rendrait plus complexe la structure du couvert par rapport
à
une monoculture résineuse et permettrait d'éviter une perte importante de biodiversité, particulièrement pour ce qui est de la faune ailée (Hobson and Bayne 2000).Rôle du peuplier faux-tremble en pessière
Il est bien connu que la productivité des pessières diminue de façon importante avec le temps (Gower et al. 1996; Ryan et al. 2004). L'une des causes de cette diminution de productivité est l'accumulation de matière organique, qui engendre une hausse de la nappe phréatique, une baisse de la température des sols et une séquestration des nutriments dans l'épaisse couche de matière organique ainsi formée (Dioumaeva et al. 2002; Fenton and Bergeron 2006; Glebov and Korzukhin 1992; Prescott et al. 2000). L'accumulation de matière organique serait plus accentuée dans les régions sensibles à la paludificiation, comme la ceinture d'argile du Québec et de l'Ontario (Fenton et al. 2005; Taylor et al. 1987). Ce phénomène serait d'autant plus important alors que la fréquence des feux diminuerait dans la région depuis la fin du 19° siècle, où le cycle de feu serait passé de 141
à
326 ans depuis 1920 (Bergeron et al. 2001). Les feux ont, en effet, plusieurs rôles écologiques dont celui de diminuer l'épaisseur de la matière organique en surface (Bergeron et al. 1999).Dans cette région, le peuplier faux-tremble se retrouve naturellement regroupé en îlots tant dans les pessières de première que de deuxième cohorte (Bergeron and Dubuc 1989; Heinselman 1981; Paré and Bergeron 1995). Ce dernier créerait plusieurs effets positifs sur la productivité des pessières. D'abord, le tremble utiliserait des nutriments que les racines d'épinette situées plus en surface ne peuvent atteindre; le tremble agirait ainsi comme une « pompe nutritive» en les rendant ensuite disponibles en surface par la décomposition de sa litière (Jones and DeByle 1985; Stoekeler 1961). De plus la litière de tremble serait plus facilement décomposable compte tenu de la faible teneur en lignine des feuilles (Kelty 2006; Scott and Binkley 1997), de l'humus alcalin qu'elle génère comparativement aux résineux (CanneIl1999; Paré and Bergeron 1996) et de son caractère nuisible
à
la croissance des mousses et des sphaignes (Van Cleve and Viereck 1981). Plusieurs études suggèrent que la décomposition de la litière des feuillus en général, par leur composition élevée en nutriments, améliorerait la disponibilité des nutriments dans les sols (Hattenschwiler et al. 2005; Hobbie 1992; Kelty 1992; MacPherson et al. 2001; Man and Lieffers 1999; Wardle2002) et abriterait une pédofaune plus abondante et diversifiée (Blair et al. 1990; Hattenschwiler et al. 2005; Jones and DeByle 1985). Certains mélanges de litière provenant d'espèces différentes pourraient également par l'intermédiaire de cette pédofaune, libérer davantage de nutriments que chacune des litières prises séparément (Blair et al. 1990; Hattenschwiler et al. 2005). Finalement, en laissant passer davantage de lumière au sol, le tremble réchaufferait la température du sol, améliorant ainsi son activité microbienne et la décomposition et permettant le maintien d'une strate herbacée plus diversifiée. Ainsi, la présence de trembles pourrait freiner le processus de paludification des pessières de la ceinture d'argile et, par le fait même, faciliter la croissance des épinettes noires et en améliorer la productivité
à
long terme (Fenton et al. 2005).Coexistence et complémentarité en forêt mixte
À court et moyen termes, les effets de la paludification sur la productivité se feraient moins sentir (Simard et al. 2007) et on pourrait croire de même pour les effets positifs du peuplier faux-tremble, mais ce dernier ne nuirait pas pour autant à la croissance de l'épinette noire. Le concept de niche écologique est
à
la base des hypothèses émises dans notre étude quantà
la coexistence du peuplier faux-tremble et de l'épinette noire. La niche écologique représente la position d'une espèce par rapport aux autres au sein d'une même communauté (Whittaker 1975). Cette position dépendrait de la tolérance de l'espèce au milieu physique et de la façon dont elle utilise les composantes de son habitat (Chase and Leibold 2003). Pour qu'il y ait coexistence stable, une certaine compatibilité est nécessaire en ce qui a traità
l'adaptation des espècesà
leur environnement (fitness) età
leur utilisation des ressources (niche écologique) (Aarssen 1983; Bengtsson et al. 1994; Hutchinson 1957); on parle alors d'habileté d'association écologique (Ecological combining ability) (Harper 1977). Les différences de niches (ou FND pour Fundamental Niche Differentiation (Whittaker 1975)) augmentent la compétition intraspécifique par rapport àl'interspécifique et permettent ainsi la coexistence (Harper 1977; Jose et al. 2006; Kelty 1992; Vandermeer 1989; Whittaker 1975).
Au-delà de la coexistence, des espèces peuvent être complémentaires et permettre une utilisation plus efficace des ressources du milieu (Loreau et al. 2001). En milieu forestier, la complémentarité prend souvent source dans la stratification au niveau des cimes (Menalled et al. 1998) et des systèmes racina ires entre les espèces coexistantes (Berendse 1979; Jose et al. 2006; Kelty 1992; Larson 1992; Parrish and Bazzaz 1976; Rothe and Binkley 2001). Autant l'épinette noire (tolérante à l'ombre) atteint une hauteur de cime moindre que celle du peuplier (intolérant à l'ombre) autant son système racina ire reste plutôt superficiel comparativement à celui de ce dernier (Gale and Griga11987; Perala 1990; Strong and La Roi 1983; Viereck and Johnston 1990). Ces différences s'accentueraient lorsqu'ils se retrouvent en milieu mixte, selon leur plasticité devant la compétition interspécifique (Jose et al. 2006; Rothe and Binkley 2001). Des différences existent également quant à la captation de lumière tant au niveau qualitatif que temporel. L'épinette noire conserve son feuillage toute l'année, lui permettant d'amorcer sa photosynthèse plus tôt que le tremble au printemps (Constabel and Lieffers 1996). De plus, le tremble utilise plus efficacement la lumière directe alors que les espèces de fin de succession, telle que l'épinette, excellent plutôt à capter la lumière diffuse (Kelty 1992; Perala 1990; Viereck and Johnston 1990).
Quoiqu'il en soit, le bilan des interactions positives et négatives entre ces deux espèces dans un contexte de paludification est encore mal connu. Des études se sont déjà penchées sur l'effet de la présence du tre:nble sur la croissance des épinettes noires (Fenton et al. 2005; Légaré et al. 200sa; Légaré et al. 200sb) et on observe que la présence de tremble pourrait apporter une certaine stabilité aux pessières, qui seraient autrement plus susceptibles à des pertes de productivité. Toutefois, des doutes persistent encore par rapport au bilan net des interactions entre le tremble et l'épinette, à savoir si la présence de tremble nuirait plus qu'elle n'aiderait la cause des épinettes noires.
Analyse de voisinage
L'observation des interactions entre le tremble et l'épinette noire à plus petite échelle permettrait de déterminer plus précisément le rôle de chaque facteur sur la croissance d'un arbre, tout en évaluant le bilan global des interactions. L'analyse de voisinage est l'une de ces approches qui permettent d'analyser les interactions spatialement et à l'échelle où elles se produisent, soit à J'échelle des individus (Canham and Uriarte 2006; Klausmeier and Tilman 2002). Il s'agit une forme relativement récente d'analyse de compétition n'ayant jamais été employée pour étudier spécifiquement la relation épinette noire/tremble. Cette app roche, déjà utilisée en agriculture, a ensuite été appliquée aux communautés végétales par plusieurs études avec une efficacité remarquée (Mack and Harper 1977; Pacala and Silander 1985; Silander and Pacala 1985; Waller 1981; Weiner 1982). L'échelle fine alloue une précision supérieure dans la détermination des effets de compétition restés indécelables à l'échelle du peuplement (Puettmann et al. 1992). Étant donné le grand nombre de calculs nécessaires, cette approche était inimaginable avant les récents progrès informatiques. Ces derniers nous permettent maintenant d'utiliser la modélisation couramment et d'obtenir des résultats dans des délais raisonnables (Latimer et al. 2006; Wang et al. 1995). Le recours à la modélisation se substitue donc aux essais sylvicoles, une méthode reconnue, mais qui requiert plusieurs années d'attente (MacPherson et al. 2001).
Certaines études précédentes ont abordé la relation de compétition du tremble avec l'épinette noire (Légaré et al. 200Sa; Légaré et al. 2004, 2005b) ou l'épinette blanche (MacPherson et al. 2001; Man and Lieffers 1999; Wang et al. 1995), mais à l'échelle du peuplement, donc avec moins de précision qu'à l'échelle de l'individu. La cartographie des sites est l'une des variables-clés de l'analyse de voisinage puisqu'elle permet de considérer tous les individus dans ses calculs (Canham et al. 2004; Canham et al. 2006; Latimer et al. 2006; Uriarte et al. 2004). D'abord, du fait de leur immobilité, les arbres interagissent principalement avec leurs proches voisins (Harper 1977; Silander and Pacala 1985; Stoll and Weiner 2000) et la compétition demeure un phénomène agissant directement à l'échelle du
voisinage (Bengtsson et al. 1994; Mack and Harper 1977), particulièrement pour ce qui est de la compétition pour la lumière (Stoll and Weiner 2000). De même, l'importance des aspects spatiaux et locaux reliés à la compétition est ignorée par la majorité des analyses de compétition qui utilise de simples indices de compétition, ce qui limite considérablement leur pouvoir (Stoll and Weiner 2000). Aussi, puisque l'influence d'un arbre sur les propriétés du sol se limiterait généralement à la projection de sa cime au sol (Zinke 1962) et que sa litière influencerait les processus nutritionnels des sols forestiers dans un rayon équivalent à la hauteur de l'arbre (Ferrari and Sugita 1996; Staelens et al. 2003), nous avons tout avantage à examiner ces interactions à l'échelle de l'arbre (Rothe and Binkley 2001).
Objectif et hypothèses
L'objectif principal de l'étude est de quantifier et préciser les interactions nettes entre le peuplier faux-tremble et l'épinette noire en mesurant leurs effets sur la croissance radiale des tiges en pessière à mousse de l'ouest du Québec. Bien que l'emphase soit mise sur l'épinette noire, l'espèce commerciale la plus prisée de ces forêts, le peuplier faux-tremble est également considéré vu l'intérêt grandissant qu'on lui accorde. Plus spécifiquement, cette étude cherche
à
spécifier l'importance de l'espèce, la taille, la distance, la position et l'abondance des voisins sur la croissance du peuplier faux-tremble et de l'épinette noire. Ces précisions permettent de distinguer les effets compétitifs de surabondance (crowding) de ceux liés à l'ombrage. Les effets de surabondance apparaissent lorsque les tiges environnantes sont en densité suffisantes pour causer des réductions de croissance sur un arbre donné (Whittaker 1975).En tenant compte de tous les facteurs mentionnés ci-haut, les analyses seront en mesure d'évaluer certaines hypothèses en ce qui a trait à la composition forestière et la configuration spatiale des îlots de trembles en pessière. D'abord, le principe de complémentarité et un possible effet améliorant du tremble dans ces forêts de 90 ans nous poussent à croire que (1) la croissance radiale d'une épinette noire mature serait meilleure
en présence d'un peuplier faux-tremble voisin que d'une épinette noire voisine. Toutefois, pour ce qui est du peuplier faux-tremble, le principe de complémentarité agirait
à
l'opposé de l'effet améliorant du tremble et l'effet détériorant de l'épinette noire sur la qualité des sols. Considérant également le regroupement des trembles en îlots dans ces pessières, nous croyons que (2) la croissance radiale d'un peuplier faux-tremble mature serait meilleure en présence d'un peuplier faux-tremble voisin que d'une épinette noire voisine. En intégrant également les gradients de taille et de densité observées dans des voisinages représentatifs des forêts de cette région, il nous est possible de spéculer que (3) la présence de peupliers faux-tremble en pessière dite « pure» ne diminuerait pas le volume total d'épinette noire dans un voisinage. Finalement, pour des voisinages tirés de peuplements équiens matures et bien établis comme ici, nous estimons que (4) ni la distance, ni la position des voisins n'influenceraient la croissance radiale des arbres matures dans ces forêts.L'estimation des paramètres impliqués dans ces relations est effectuée selon les méthodes de vraisemblance maximale (maximum likelihood methods), jugées mieux adaptées
à
ce type d'analyse (Canham and Uriarte 2006; Uriarte et al. 2004). Ces méthodes, combinées à la théorie de l'information (information theory), permettent de tester plusieurs hypothèses simultanément et de les comparer entre-elles (Hobbs and Hilborn 2006; Johnson and Omland 2004). Les hypothèses y sont représentées sous forme de modèles et leurs structures et paramètres ont été choisis de façon à représenter explicitement des processus écologiques reconnus (Hobbs and Hilborn 2006; Hobbs et al. 2006). Ici, cette étape est intégrée, à l'intérieur d'une application informatique,à
un algorithme d'optimisation par approximations successives ou « recuit simulé» (Simulated annealing), pouvant effectuer un nombre élevé d'itérations et permettant des estimations de paramètres plus précises (Gaffe et al. 1994; Kirkpatrick et al. 1983). Cette forme d'optimisation a été choisie parce qu'elle est mieux adaptéeà
la sélection de modèle telle qu'utilisée ici.TREE GROWTH RESPONSE TO TREMBLING ASPEN PROXIMITY IN EASTERN CANADA BLACK SPRUCE-FEATHERMOSS FOREST
Article écrit par Guillaume Sainte-Marie1)
et révisé par Alain Leducl,2, Michael J. Papaik3, et Yves Bergeron2,4.
l Chaire industrielle CRSNG-UQAT-UQAM en Aménagement Forestier Durable, UQAM, c.P. 8888 Suce. Centre-ville, Montréal, Que, Canada, H3C 3P8.
2 Centre d'étude de la forêt, UQAM, c.P. 8888, Suce. Centre-Ville, Montréal, QC, Canada,
H3C 3P8,
3 Dao Ying Ecosystems Group, 11135 Cherry Ridge Road, Sebastopol, CA, U.S.A., 95472.
4 Chaire industrielle CRSNG·UQAT-UQAM en Aménagement Forestier Durable, UQAT,
1.1 RÉSUMÉ
En forêt boréale de l'est du Canada, les pessières à mousses sont souvent pourvues de peupliers faux-trembles qui s'y retrouvent parsemés en petits Îlots. Ces pessières sont alors aménagées de manière
à
confirmer leur vocation principale, en tentant de réduire du mieux possible la présence de tremble lors des pratiques d'éclaircies précommerciales. Bien que des études suggèrent qu'à long terme, le peuplier faux-tremble pourrait augmenter le rendement de ces pessières en limitant l'accumulation de matière organique au sol, des inquiétudes persistent quant à son effet compétitif sur la croissance des épinettes à court et moyen termes. Cette étude cherche donc à quantifier et préciser les interactions compétitives entre le peuplier faux-tremble et l'épinette noire en mesurant leurs effets sur la croissance radiale. Ces interactions sont étudiées à l'échelle de l'arbre, de manière à évaluer plus spécifiquement l'importance de l'espèce, la taille, la distance, la position et l'abondance des voisins sur la croissance. Une analyse de compétition est effectuée à partir de la croissance radiale de 373 arbres témoins, répartis sur 122 placettes. Le modèle estime la croissance radiale potentielle maximale et distingue les effets de la compétition pour la lumière de ceux découlant de situations de surnombre. Le meilleur modèle pour l'épinette noire inclut un effet d'ombrage spatialement explicite, mais également un effet de densité indépendant des distances. Celui du tremble exclut quant à lui toutes composantes spatiales mis à part le rayon de voisinage. Les résultats montrent qu'une épinette noire est jusqu'à 4 fois moins affectée par le voisinage d'un tremble que celui d'un congénère de même taille. La dominance des trembles sur les épinettes entraîne cependant certains effets négatifs sur la croissance de ces dernières, particulièrement en tremblaie dite pure. Donc la croissance radiale optimale de l'épinette noire est atteinte en milieu mixte, où les proportions de tremble et d'épinette noire sont équivalentes et où la dominance des trembles est réduite. La croissance des trembles est quant à elle favorisée en tremblaie pure, où les faibles densités lui sont favorables. Les analyses laissent présager la présence d'un certain effet améliorant du tremble sur la croissance des arbres en pessière. En termes de rendement, on observe un effet additif de ces deux essences; c'est-à-dire qu'on peut ajouter jusqu'à 30 % de tremble dans le peuplement sans diminuer le volume total d'épinette noire.MOTS-CLÉS: Compétition, épinette noire, peuplier faux-tremble, forêt boréale, analyse de voisinage.
1.2 ABSTRACT
ln North-Eastern Canada, black spruce-feathermoss forests often include trembling aspens grouped in small patches. These forests are usually managed as to confirm their main vocation by thinning trembling aspen in premature stands. However the presence of trembling aspen in black spruce stands could increase their yield through ecological niche separation (i.e. lower interspecific competition) and by improving soil conditions. The objective of this study is to define and quantify black spruce and trembling aspen competitive interactions and their effect on tree growth in mature stands. Their interactions are evaluated at tree-scale in order to determine the role of species, size, distance, position and neighbour abundance on tree growth. The neighbourhood analysis uses radial growth of 373 target trees located over 122 plots. The model estimates maximum potential growth and distinguishes shading effects fram those due to crowding. While the best black spruce model includes spatially explicit shading effects, crowding effects appear independent of neighbour distance. In contrast, the best trembling aspen model excludes ail spatial components other than neighbourhood radius. Results reveal that a black spruce tree is four times less affected by aspen neighbours than conspecifics of similar size. However trembling aspen dominance over spruce trees has negative effects on black spruce growth, especially within "pure" trembling aspen stands. Thus, optimal black spruce growth is reached in mixed environments with equivalent aspen and black spruce basal area. Conversely, trembling aspen growth is best in pure trembling aspen environments where low tree abundance suits it best. Analyses also suggest the possibility of a positive effect of trembling aspen on tree growth in black spruce forests. In terms of praductivity an additive pattern is observed between these species: including up to 30 % trembling aspen in black spruce stands does not reduce total black spruce volume.
KEY WüRDS: Competition, black spruce, trembling aspen, boreal forest, neighbourhood analysis
1.3 INTRODUCTION
Traditional forestry tends to simplify forest composition by favouring regeneration of the most valuable species (Kelty 2006; Nichols et al. 2006; O'Hara et al. 1994). In North-Eastern Canada, black spruce stands often include trembling aspen stems grouped in small patches. Despite the fact that these species naturally coexist in this region (Chen and Popadiouk 2002; Lecomte and Bergeron 2005), These forests are generally managed to favour spruce by removing the aspen component as much as possible in precommercial stands. However aspen could play an important ecological role in these stands and its decline could reduce black spruce yield (Légaré et al. 2004) and long-term forest productivity (Fenton et al. 2005; Légaré et al. 2005b; Simard et al. 2007).
Considering architectural differences between aspen and black spruce in crown height & length and root system depth (Gale and Grigal 1987; Perala 1990; Strong and La Roi 1983; Viereck and Johnston 1990), such variations in species' traits might lead to resource-use complementarity and improved yield compared to monospecific stands (Kelty 1992; Loreau 1998). In the boreal forest, black spruce litter is relatively resistant to decomposition (Prescott et al. 2000) and over the long term, forested peatlands can develop on fiat topography (Crawford et al. 2003; Payette and Rochefort 2001), reducing stand productivity (Simard et al. 2007; Van Cleve and Viereck 1981). In su ch conditions, the presence of trembling aspen could inerease soil organic matter (SOM) decomposition and nutrient cycling (Connell and Slatyer 1977; Paré and Bergeron 1996) and reduce or delay deterioration of growth conditions by sphagnum (Payette and Rochefort 2001). It has been suggested that this potential effect of trembling aspen could increase both black spruce and trembling aspen growth.
Both resource-use complementarity and improvement of soil condition could influence black spruce/aspen interactions but previous growth analysis on this subject were blurred by the great variability of abiotic factors and neighbourhood context between sites within
mixed stands (Burton 1993; Légaré et al. 200Sa; Loreau 1998; Newton and Jolliffe 1998; Rothe and Binkley 2001). Since competition occurs among individual trees, integrating local variables could considerably reduce uncertainty and more accurately illustrate competition dynamics (Grimm and Railsback 2005; Stoll and Weiner 2000). The use of individual-scale analysis has increased considerably with improvements in computing power (Grimm and Railsback 2005). It allows greater precision in measures of local phenomena such as competitive interactions.
The objective of this study is to explore the effects of competitive interactions between black spruce and trembling aspen on tree growth in unmanaged, mature black spruce feathermoss forests of Western Quebec. In studying mature forests, we are interested in the cumulative interaction effect between these species, not its development over time. This study focuses on black spruce, the most valuable commercial species in this region. However, interest in trembling aspen has risen over recent years and its dynamics were also considered. Analyses explore several hypotheses concerning different characteristics of these stands, i.e. forest composition and spatial heterogeneity issues. Considering complementarity between the two species and a possible improvement effect of trembling aspen in these 90 years-old forests, we speculate that (1) black spruce radial growth improves in the presence of a trembling aspen neighbour compared to a black spruce neighbour. For trembling aspen however, complementarity effects act oppositely to black spruce soil deterioration effect and aspen improvement effect. This situation, coupled with the fact that aspen trees gather in small groups, raises the hypothesis that (2) trembling aspen radial growth improves in the presence of an aspen neighbour relatively to a black spruce neighbour. At stand level, only the consideration of different densities and tree sizes observed in representative neighbourhoods of these forests allows to draw conclusions regarding the yield of the BS/TA mixture. Using this approach, we expect that (3) the presence of trembling aspen in near pure black spruce stands does not reduce total black spruce volume in a neighbourhood. Finally, in a context of even-aged, mature stands as
those sampled here, we anticipate that within neighbourhood limits (4) neither distance between trees and neighbour position influence the radial growth of mature trees.
1.4 METHODOLOGY
1.4.1 Studyarea
The area is situated in North-Western Quebec, in the North-Eastern Canadian boreal forest. Sites were located between 78°41'W and 79°9'W longitude and 48°57'N and 49°15'N latitude, covering an area of 1160 km2
. This region lies within western Quebec black spruce
feathermoss forest domain and extends over the clay belt of North-Eastern Ontario and North-Western Quebec. This deposit was created by clay and silt sedimentation in lakes Barlow and Ojibway during the last glaciation (Vincent and Hardy 1977) and is known for its relatively rich but often poorly drained soils. In the absence of disturbance, SOM accumulates with time, creating favourable conditions for sphagnum growth and paludification (Fenton et al. 2005).
The study region has one of the driest climate in the commercial forest of Quebec (Robitaille and Saucier 1998) and is characterized by total annual precipitation of about 857 mm and a mean annual temperature of 0.8 oC based on the meteorological station of La Sarre (Environnement-Canada 1993). Mean stand age in the region, based on time since fire studies, is 139 years and local fire regime was characterized by large wildfires and a fire cycle of 146 years between 1850 and 1920 and bya longer fire cycle since then (326 years) (Bergeron et al. 2001).
1.4.2 Sampling design
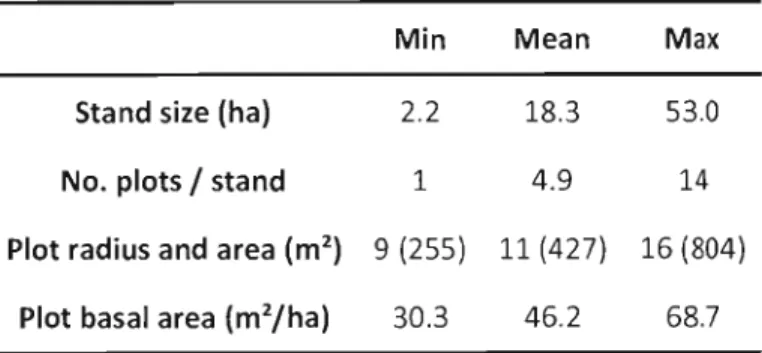
A total of 122 neighbourhoods were selected and distributed among 49 forest stands. From those, 23 were conifer-dominated stands (more than 75 % of forest cover in coniferous species), 21 were mixed stands (from 25% to 75% of forest cover in coniferous species), and 5 were hardwood-dominated (more than 75 % of forest cover in hardwood species). Hardwood-dominated stands are scarce in this region characterized by black spruce feathermoss forests, but near-pure trembling aspen patches also occur withi n mixed stands, where most of the hardwood-dominated neighbourhoods in this study were sampled. Average stand size is 18.3 ha and plots were separated bya minimum of 50 meters (center to center). This distance was sufficient to set plots in separate trembling aspen c1usters within the black spruce forest matrix. Mean plot radius was 11 m (area = 427 m2
) and plot
size decreased with forest density to reduce sampling effort (Table 1.1). Plot radius was set higher than Lorimer's influence radius calculation, which is equal to 3.5 times a target tree crown radius in hardwood forests (Lorimer 1983), in order to test for this value. According to this calculation, mean influence radius would be 10.0 m for trembling aspen and 4.8 m for black spruce. Finally, DBH was measured on ail merchantable size stems (9 cm dbh or more), species were identified and coordinates from plot center were taken for ail trees within plot radius. l\IIeasures of crown geometry were extrapolated from DBH using allometric relationships (Lambert et al. 2005; Poulin and Messier 2006).
Table 1.1 : Summary statistics of inventory plots
Min Mean
Max
Stand size (ha) 2.2 18.3 53.0
No. plots / stand 1 4.9 14
Plot radius and area (m2
) 9 (255) 11 (427) 16 (804)
Plots contained an average 3 target trees located at a mean distance of 1.4 m from plot center. Targets (n=373) were mostly black spruce (n=239) to focus on the most valuable species, but aspen targets (n=134) were also selected. Attention was given ta enlarge target size gradient as much as possible over merchantable size (9 cm). For each target tree, 2 cores were extracted in order to assess current growth. Radial Increment was measured for the last S years (2001 through 2006). Going back further in time increased the risks of having different neighbourhood configurations than what was actually measured. As sampling was restrained to these mature stands, it overlooks competitive interactions occurring during active self-thinning phase, which essentially occurs at younger development stages; however, the main objective was to assess cumulative effects of trembling aspen and black spruce interactions in unmanaged forests, not necessarily stand development over time.
Soil organic matter (SOM) is both a cause and an effect in terms of productivity (Grigal and Vance 2000; Prescott et al. 2000; Simard et al. 2007; Van Cleve et al. 1983) and in this region, the presence of trembling aspen has often been associated with low SOM depth (Fenton et al. 200S; Légaré et al. 200Sb; Paré and Bergeron 1996). Sampled forest patches are located on productive sites of 90-100 years old originating from wildfires (Bergeron et al. 2004), with generally low SOM levels. SOM depth varies from 3 to 12 cm in selected neighbourhoods. To insure uniformity in initial site conditions, other abiotic soil properties were maintained similar between sites: soil type and texture (heavy clay deposit), slope « 10 %), and drainage (moderately ta near imperfectly drained). The fact that pure black spruce plots remain close to mixed-species plots also helped homogenize site condition. Hence, no site quality variables were included in the growth models.
Since the different hypotheses are concerned with merchantable, mature farests, sampling was restricted ta specifie forest patch characteristics concerning age, composition, origin, and stem abundance. Sampled stands were 90-100 years old and originated from wildfires that occurred around 1910 (Bergeron et al. 2004). Neighbourhaod canopy was generally
c10sed (> 60% of c1osure) and basal area ranged from 30.3 to 68.7 m2/ha (1.1). In terms of
species composition, representation of species other than black spruce or trembling aspen was minimized (max. 25 % of total basal area). Moreover, sampling was conducted along a canopy composition gradient from pure black spruce to pure trembling aspen forest patch es (0 to 94 % of total plot basal area in trembling aspen). Target trees were distributed throughout various contexts: vertical dominance (suppressed to dominant) and proximity to c10sest aspen (0.5 m to 9 ml. To limit external effects, a 10 m buffer zone of similar forest conditions was respected outside plot limit. Forest patches that had been disturbed locally in the last two or more years were avoided for sampling. This relative uniformity in stand conditions also reduced the risk of influence by site quality differences (Harper 1977; Légaré et al. 2005a; Légaré et al. 2004).
1.4.3 Tree growth and competition models
The simple set of models presented here is derived from previous studies that have shown its efficacy, parsimony and ecological relevance for different forest ecosystems (Canham et al. 2004; Papaik and Canham 2006). This spatially-explicit individual-based model analyzes competition effects of neighbouring trees on trembling aspen and black spruce radial growth. Specifically, the roles of neighbour abundance, species, tree size, distance, and location as weil as their interplay are evaluated in terms of overall competitive effects. While a tree-scale approach has never been used in these forests, it should improve the evaluation of the effect of local factors (vertical dominance, tree location and size) on tree growth.
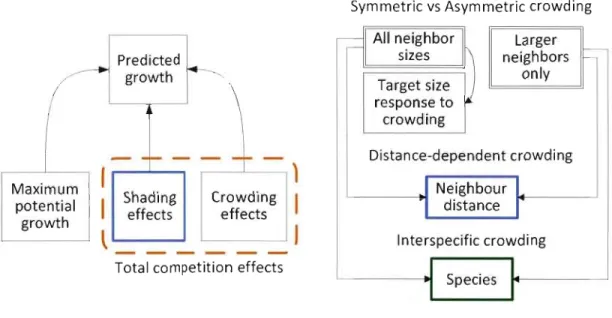
The full model is partitioned in two distinct parts: non-spatial and spatial components (Figure 1.1). The non-spatial component estimates growth for individual trees as a function of maximum potential growth estimation of a free-standing tree (without neighbours). The spatially-explicit component partition competition effects into the shading effect related to sunlight interception by surrounding canopy and the residual effect of crowding from
neighbouring trees. The crowding model reflects both below-ground competition and above-ground inhibition of crown development. Though it addresses specifically tree abundance-related effects, the crowding model may also indirectly include some shading effects, since large and close trees will inevitably cast more shade than small or distant ones. However, the shading model being the only one using specific X,y,l coordinates of tree crowns, shading effects should mostly be dealt through that mode!. Hypotheses are essentially addressed through specific parameters (which are indicated in figure 1.1), but the whole model's behaviour also provides insights to discuss on the different hypotheses.
Symmetric vs Asymmetric crowding
ij=jl
Alin~ighbor
Larger1 - slzes
...
Predicted neighbors ~r-I
growth only Target size response to ~ crowding-
-
~- Distance-dependent crowding Maximum1
1
Neighbour1
Shading Jpotential
1
crOWdi~g
]l
distancer
effects effects growth
1
Interspecific crowdingTotal competition effects
J
Species
1
"1
1
Hypotheses 1 and 2 (Inter vs intraspecific interactions)r ..)
Hypothesis 3 (stand-Ievel inference)1
1
Hypothesis 4 (spatially-explicit interactions)The full model is expressed in equation 1-1. Predicted radial growth (RG) and MaxRG (average maximum potential radial growth of target species) are expressed in mmjyear whereas other effects are simply expressed as inflation factors varying between 0 and 1. An effect with a value of 1 does not affect growth at ail, whereas a value inferior to 1 indicates a decrease in tree growth due to competition.
RG(mmjyr)
=
maxRG(mmjyr) x shading effect x crowding effectÉquation 1.1 : Full model
1.4.3.1 Potential growth estimation
The average maximum potential radial growth (parameter MaxRG) refers to the growth capacity of a tree as a function of its size and species. It is estimated through a method that extrapolates growth of the best growing trees in a competition-free situation using competitive effects estimation.
1.4.3.2 Spatially-explicit analysis of tree competition
Major determinants of neighbourhood competition are usually neighbour abundance, species, distance, position and size (dbh, height, crown shape) (Larson 1992). Neighbourhood effective radius, the maximum distance at which a neighbour influences growth of a focal tree, is also important in neighbourhood analyses (Burton 1993) and is estimated simultaneously with other parameters. A decay parameter (R) estimates competitive effects decay over that radius. First used by Canham et al. (2004), this method represents an advance over previous neighbourhood studies where effective radius was fixed arbitrarily or decay rate assumed (Burton 1993; Canham and Uriarte 2006; Silander and Pacala 1985; Simard and Sachs 2004).
1.4.3.2.1 Shading effect modeling
As part of hypothesis 4, the shading model integrates over the specifie location of neighbours in order to address the spatial dynamics between black spruce and trembling aspen. Shading is distinguished from crowding in the sense that its competition effect is anisotropie around the target tree, conferring ail effects to trees located between the target and direct sunlight. Crowding effects are isotropie and remain constant independently of neighbour's angle. The x,y,z tree crown coordinates distinguish the shading model from the crowding model, though both models incorporate common information. The shading model also incorporates size and species of target and neighbour trees through tree crowns representation. Shading effect modeling relies on data sampled in previous studies describing light availability in the canopy (Canham et al. 1999; Canham et al. 2004) and on tree allometry (tree height, crown height and crown width for each species) (Lambert et al. 2005; Poulin and Messier 2006). Aspen and black spruce allometry parameters were previously estimated for the Duparquet area (Poulin and Messier 2006) and from external data (Lambert et al. 2005; Ouellet 1983), respectivelv.
Shading effect
=
exp[ -m·%
shade]Équation 1.2 : Shading effect
Where m is a scaling parameter and % shade is the proportion of sky area blocked by neighbouring crowns. Shading effect calculated here depends solely on target crown exposition, which is itself determined by neighbouring crowns interference, sun declination at this latitude, amount of growing days and by a c10udiness index. Crown exposition depends on sky area blocked by neighbouring crowns. Sky is represented as an array of 360 cells wide and 90 cells high, each of which is considered either open or blocked to incident light. The simple model represents crowns as two-dimensional opaque panels which avoid the use of expansive and time-consuming GU (Gap Light Index) data collection which determines species-specific light transmission coefficients (Canham et al. 2004). There is
evidence that understory light availability may be better determined by canopy structure and the neighbourhood spatial context than interspecific differences in light transmission through the canopy (Canham et al. 1999). A neighbour crown is considered to be shading a target tree if it is higher than its mid-crown and if it is located between the target and direct sunlight. Vertical dominance is therefore indirectly considered in the shading model.
1.4.3.2.2 Crowding effect modeling
Variables tested within the full crowding model are neighbour species, size, distance and abundance as weil as target tree size and species (Equation 1-5). Crowding effect is modulated by a scaling parameter (C) that determines the response of a target tree to the level of neighbourhood competition (Equation 1-4). This index is computed for ail trees in a plot, but the optimization algorithm estimates the average distance at which neighbours no longer influence a target tree. This influence radius (R) is not represented in the crowding equation, but it is included in the parameter set for each crowding model run. For; = 1,..., s species and j = 1,..., n neighbors within a radius R, neighborhood crowding index (NCI) on a target tree becomes:
s n
(dbh ..
t )]
Crowding effect
=
exp -C' (DBHt)Y
~ ~
itij(diS:)f3
[ (
Équation 1.3 : Full crowding (NCI) model
The roles of neighbour size and distance are estimated here through their exponent, parameters
a
and ~, which may vary from 0 (no effect) to 4 in order to adjust to field conditions. Parametera
determines how crowding scales to neighbour DBH and ~ evaluates the decay in the effect of neighbour distance up until neighbourhood radius is reached. As part of hypothesis 4, ~ addresses the role of neighbour distance in black spruce and trembling aspen interactions. Parametersa,
and Rare assumed constant for ail species ofneighbours to limit total number of parameters. Hypotheses 1 and 2 are addressed through parameter 11., which scales competitive effects depending on neighbour species or functional group. In its complex form, À. is estimated for each neighbour species, but it can also be simplified and estimated for each functional groups or intra/interspecific groups. This parameter is allowed to vary from 0 (no crowding effect generated by a species i) to 1
(maximum crowding effect). Target tree dominance has an important role on tree growth, and aJthough this issue is addressed by the shading model in terms of light availability, there are also advantages to tree dominance in terms of soil resources. Most studies have observed an inversely proportional relationship between target tree size and competitive effects (Canham et al. 2006; Hegyi 1974; Papaik and Canham 2006; Thomas and Weiner 1989). However, as density of black spruce stems can be high, neighbouring aspens may be sensitive to such abundance, regardless of their size advantage. The full model is flexible in this respect and allows both patterns to be tested; by adding an exponent ('Y) to the DBH of
the target tree, we allow target tree sensitivity ta adjust to species and field conditions (Canham et al. 2004; Canham et al. 2006; Papaik and Canham 2006). This parameter ranges from -2 to 2, determining whether bigger trees are more sensitive to crowding (y > 0), Jess sensitive (y < 0) or equally sensitive than smaller trees (y :::; 0).
Asymmetric competition
As opposed to the full crowding model where competition is symmetric and trees smaller than the target tree may still generate competitive effects, the asymmetric model only considers neighbour trees larger than the target. The magnitude of the effect is not proportional ta absolute neighbour size but to the difference in size between the target and its neighbour. This nested submodel also anaJyzes target tree dominance indirectJy through target tree and neighbour size difference. Neighbourhood abundance is thus significantly reduced since many neighbouring trees can be smaller than the target tree. Consequently, parameters C (Equation 1-4) and a adjust to this different context.
s n (
)a
dbhij - dbhtNCI
=
À .. """"'---''---::;---'-. . Il (dist)fJ
LL
1=1 J=lÉquation 1.4 : Asymmetric crowding model
Alternate models were formed by using either eq. 1-4 or 1-6 structures that represent non nested models (different NCI calculations), by eliminating models or by forming nested models by dropping variables and/or parameters whose presence did not provide any additional information to the model.
1.4.4 Model selection and evaluation
ln order to determine the best mode l, alternate models were compared using model selection procedure as a form of hypothesis testing, based on information theory and the use of the Akaike Information Criterion (Ale). AIC determines the best model based on maximum Iikelihood and parsimony (Burnham and Anderson 2002; Johnson and Omland 2004). Likelihood methods are a more comprehensive and flexible approach that allows comparison of multiple hypothesis (Burnham and Anderson 2002; Canham and Uriarte 2006). Parameter values were chosen according to their maximum likelihood using simulated annealing, a global optimization algorithm (Goffe et al. 1994). This was do ne using an application created with Delphi version 6 for Windows (Borland Software 2000).
The fit of alternate models was assessed using two metrics. Bias was measured using the slope of the regression of observed radial growth on predicted radial growth, an unbiased model having a slope of 1. Pseudo R2 calculated regression between the observed and predicted values as a measure of goodness-of-fit. Alternate models were compared using the corrected Akaike information eriterion (AICc) for small sample size (Burnham and Anderson 2002). Even if sample size is large enough, it is recommended to use AICc systematically (Anderson 2008). The best model and most parsimonious is the one with the
lowest AICc score. Strength of evidence for individual parameter estimates is measured with
asymptotic two-unit support intervals (Edwards 1992). It is similar to a 95% support limit defined using a likelihood ratio test (Hilborn and MangeI1997).
To reduce parameter estimate bias, we used multi-model inference (MMI) instead of best model inference (BMI) (Burnham and Anderson 2002). It uses Akaike weights (Wj), derived from the differences between AICc values to evaluate strength of empirical support for the
competing models:
Équation 1.5 : Parameter averaging using Akaike weight
Where b.j is b.AICc between the best model and the ith model, R is the number of models
used in the analysis, E(y) is the averaged parameter estimate, and E(Yi) is the best model
parameter estimate (Burnham and Anderson 2002). Akaike weight represents the expected probability of model i being selected best with repeated sampling of the same population. MMI is especially recommended when support for the best model (Wbest) < 0.9, which means
it has less than 90 % chance of actually being the best model and that there is clearly no model superior to others (Burnham and Anderson 2002). When a parameter is absent in some models of a prediction set, they are attributed a neutral value (often 0), which is then included in the averaging computation.
1.4.5 Stand-Ievel considerations
ln order to address hypothesis 3 which deals with black spruce yield at stand scale, parameter estimates obtained at tree scale were used to model tree growth along a forest composition gradient. Average tree growth predictions were made using regression models
that describe the distribution of average tree size and abundance according to neighbourhood species composition gradient. Based on allometric equations, tree height was estimated from DBH data (Poulin and Messier 2006) and volume of trembling aspen, black spruce and total neighbourhood could also be estimated for different forest composition using Smalian's formula. Since these analyses rely on field measurements, it provides interesting insights into growth dynamics between trembling aspen and black spruce in these stands.
1.5 RESULTS
1.5.1 Range of conditions covered by sample set
The data set covers a variety of neighbourhood contexts in terms of tree abundance, tree size, species composition and spatial configuration that allow estimating growth throughout a wide range of conditions (Table 1.2). An important characteristic of sampled trembling aspen patches is that tree abundance decreases and mean tree size increases for both species as proportion of trembling aspen increases (Figure A.4). This variation makes competitive conditions vary greatly between trembling aspen patch es, but the different gradients are covered by the data set (Table 1.2).
Mean radial growth for trembling aspen is 0.79 ± 0.02 mm/year and 0.48 ± 0.01 mm/year for black spruce (with 95 % confidence interval). Trembling aspen trees within the study area experienced a severe forest tent caterpillar outbreak in 2001 (Cooke and Lorenzetti 2006), with a possible aftereffect during the following summer (2002) (F. Lorenzetti, personal communication) (Figure A.6). The bias induced by the outbreak made it difficult to use the last 5 years of growth. Both aspen and black spruce growth were modified since their dynamics are related in these mixed forest patches. As a result, only the last 3 years of growth were used (2003-2005) for modeling.
The entire gradients of vertical dominance and shade conditions were covered within the data set, as calculated by the light mode!. Mean shade % (with 95 % confidence interval) for trembling aspen ranges from 12.9 ± 6.4 % to 39.4 ± 6.7 % in black spruce and in aspen dominated neighbourhoods, respectively. For black spruce target trees, mean shade %
ranges from 37.8 ± 4.4 % to 66.4 ± 4.7 % in black spruce and in aspen dominated neighbourhoods, respectively.
Table 1.2: Summary statistics of sampled neighbourhoods
Trembling aspen neighbourhoods
Neighbour Closest neighbour
DBH (cm) abundance dist. (m) Neighbour TA BS Ali TA BS Ali TA BS species Min 1 3 16.0 7.5 7.0 7.0 0.3 0.2
mean
15.9 34.7 52.9 24.4 15.2 19.5 2.2 2.1 Max 39 130 133.0 54.0 30.6 54 10.0 8.0 Spruce stands* 8.6 77.8 88.1 16.2 13.8 14.1 3.2 1.1 Mixed Stands* 16.7 33.9 53.6 24.1 15.5 18.7 2.1 1.7 Aspen stands* 18.6 10.2 30.7 29.5 15.4 24.1 1.9 3.2 Average 52.9 19.5 2.1Black spruce neighbourhoods
Neighbour Closest neighbour
DBH (cm) abundance dist. (m) Neighbour TA BS Ali TA BS Ali TA BS species Min 1.0 1.0 10.0 7.1 6.8 6.8 0.2 0.1
mean
9.0 37.6 48.1 21.9 14.8 17.1 3.1 1.6 Max 29.0 103.0 106.0 52.0 30.6 30.6 8.5 7.5 Spruce stands* 5.1 52.5 59.4 19.2 14.5 14.9 4.0 1.2 lVIixed stands* 12.1 27.0 40.8 23.1 15.2 17.9 2.3 1.7 Aspen stands* 14.4 7.8 23.1 28.9 14.9 23.9 2.1 3.5 Average 48.1 17.1 2.3Notes: These numbers were computed for mean neighbourhood radius of 8.7 m for black spruce and 10.6 m for trembling aspen (see table 1.6). TA stands for trembling aspen and BS for black spruce. *For a stand to be classified as pure black spruce, provincial forest regulation (and the present study) allows a presence of trembling aspen < 25 % of total stand basal, between 25 and 75 % of aspen for mixed BS/TA stands, and ~ 75 % in aspen for trembling aspen stands.
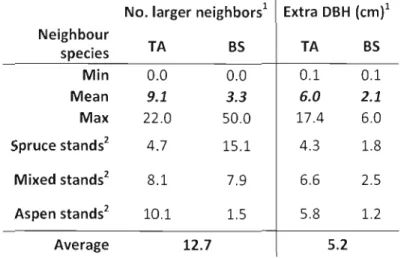
Table 1.3 : Trembling aspen statistics for asymmetric crowding model
No. larger neighbors1 Extra DBH (cm}l
Neighbour TA BS TA BS species Min 0.0 0.0 0.1 0.1 Mean 9.1 3.3 6.0 2.1 Max 22.0 50.0 17.4 6.0 Spruce stands2 4.7 15.1 4.3 1.8 Mixed stands2 8.1 7.9 6.6 2.5 Aspen stands2 10.1 1.5 5.8 1.2 Average 12.7 5.2
Notes: These numbers were computed for mean neighbourhood radius of 10.6 m for trembling aspen (see table 1.6). TA stands for trembling aspen and BS for black spruce neighbours. 1 Number of larger neighbours and extra DBH refer to the asymmetric crowding model which ignores sa me size and smaller trees to consider only neighbours larger than the target tree (in DBH terms). According to the analyses, this model works only for trembling aspen so these data for black spruce are not presented here. 2 For a stand to be
classified as pure black spruce, provincial forest regulation (and the present study) allows a presence of trembling aspen < 25 % of total stand basal, between 25 and 75 % of aspen for mixed BSjTA stands, and ~ 75 % in aspen for trembling aspen stands.
Soil organic matter (SOM) depth was not intended to form a gradient in this study, but rather a constant, in order to put a focus on the effects of forest composition on tree growth. SOM depth for these productive sites remains relatively low for boreal forest soils (3-12 cm in this sample set). However, despite similar origin and abiotic site conditions, there is still a negative correlation between SOM depth and trembling aspen presence in the canopy for these productive sites (Figure 1.2). This has been observed before in the same area (Fenton et al. 2005; Légaré et al. 2005b).
14
,.-..,E
12
0 ü ... 0 0 ~...
Q..10
Q) -0 L Q) ~ cu8
E
.~ c cu6
Ol La
a
(J)4
0 0 0 0 0 0 0 0 02
0
20
40
60
80
100
%
of total neighborhood basal area in trembling aspen
Figure 1.2 : Soil organic matter depth distribution along neighbourhood mixture gradient
Notes: Regression is significant (P
<
0.0001), equation is y=
8.44 - 0.04x, and R2=
0.41.
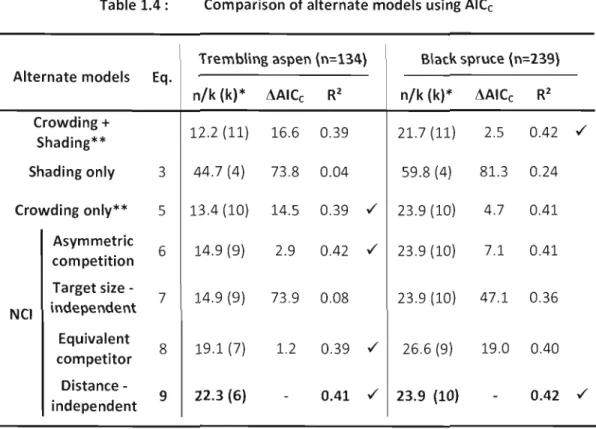
1.5.2 Spatial analysis oftree growth
Ail models give unbiased estimates of growth with a 1:1 relationship of observed over predicted radial growth with intercepts of 0 and best models R2 were 0.41 for trembling aspen and 0.42 for black spruce (Table 1.4).