UNIVERSITÉ DE SHERBROOKE Faculté de génie
Département de génie civil et génie du bâtiment
ÉVALUATION ENVIRONNEMENTALE
DES CONSÉQUENCES DE LA
DÉCARBONISATION DES SERVICES
ÉNERGÉTIQUES
EVALUATING ENVIRONMENTAL
CONSEQUENCES OF DECARBONISING
ENERGY SERVICES
Thèse de doctorat Spécialité: génie civil
Miguel FERNANDEZ ASTUDILLO
Sherbrooke (Québec) Canada Janvier 2019
Membres du jury Pr. Ben Amor Directeur Pr. Pierre-Olivier Pineau Codirecteur Pr. Dahai Qi Rapporteur Dr. Christopher Mutel Évaluateur externe Dr. Kathleen Vaillancourt Évaluateur
i
RESUME
Les services énergétiques sont essentiels au bien-être humain, mais l’utilisation de combustibles fossiles pour répondre à la demande énergétique compromet les moyens de subsistance des générations futures et des écosystèmes, par le réchauffement climatique et d’autres menaces. Il est donc urgent de transformer le système énergétique existant. Cependant, cette transformation peut créer des problèmes imprévus si elle n’est pas planifiée de manière cohérente et complète. Plusieurs plans de transition énergétique reposent sur des modèles d'optimisation des systèmes énergétiques (MOSE), mais ces modèles sont peu adaptés pour évaluer les facteurs de stress environnementaux et leurs effets, et ils adoptent des représentations trop simplistes des systèmes de production. L’hypothèse de base de cette thèse est qu’une approche combinant les MOSE et l’analyse du cycle de vie (ACV) peut permettre de surmonter les limites des MOSE, en aidant à éviter des imprévus dans les politiques de réduction de gaz à effet de serre.
Cette thèse donne un aperçu des limites des approches existantes reliant MOSE et ACV et met en œuvre une méthodologie possible pour les surmonter. Plusieurs questions liées à la transition énergétique au Québec sont évaluées à l'aide d’un modèle TIMES (NATEM) pour la province de Québec. Le scénario de modélisation des conséquences des objectifs de réduction des gaz à effet de serre (GES) est ensuite évalué selon une perspective de cycle de vie. Pour relier les deux modèles, un ensemble de fonctions et de procédures est codé dans un langage open source (Python), qui peut être réutilisé dans d'autres évaluations.
Les résultats montrent que seul un nombre relativement restreint de processus est à l'origine des changements dans la quantité de GES. Cette observation est utilisée pour simplifier la liaison entre les modèles TIMES et ACV. L'évaluation intégrée MOSE-ACV appliquée au Québec indique que les politiques de réduction de GES peuvent réduire les impacts sur la santé humaine et la biodiversité. Cette réduction d’impacts est due à la mitigation du changement climatique, mais également à d'autres mécanismes de cause à effet tels que la réduction de la pénurie d'eau et de la contamination par les métaux. De plus, la liaison des MOSE avec des modèles de simulation énergétique de bâtiments suggère que des bâtiments mieux isolés réduiraient les coûts totaux de réduction de GES. L'introduction de technologies à faibles émissions de carbone pourrait augmenter les coûts des services énergétiques de 20%, mais ces coûts pourraient être considérablement réduits grâce à des mesures axées sur la demande énergétique.
Les MOSE offrent une perspective intéressante, mais limitée, pour planifier les transitions énergétiques. La liaison des MOSE avec ACV est une approche viable pour donner une vue plus complète de l’importance relative des mécanismes qui affectent la santé humaine et la biodiversité. L'évaluation intégrée est un outil puissant pour analyser une large gamme de problèmes liés aux transitions énergétiques. Comprendre les hypothèses et principes sous-jacents des modèles est également important pour interpréter les résultats.
Pour faciliter ce type d'analyse, les chercheurs doivent faciliter la réutilisation de leurs travaux, en convenant des formats de sortie, en documentant le code sous-jacent aux analyses et en fournissant des outils pour intégrer les modèles. À cette fin, les outils open-source scriptables sont extrêmement utiles. Cette thèse tente de faire un pas en avant dans cette direction.
iii
SUMMARY
The services provided by energy commodities are essential for human wellbeing but the reliance on fossil-fuels is jeopardising the livelihood of future generations and ecosystems, through global warming and other cause-effect pathways. There is an urgent need to transform the energy system, but this transformation may create unforeseen problems if not planned comprehensively. Many energy transitions plans rely on energy system optimisation models (ESOM), but these models are ill-prepared to evaluate the range of environmental stressors and their effects, and have oversimplified representations of production systems. An integrative approach combining ESOMs with life cycle assessment (LCA) can overcome the limitations of ESOMs, helping to avoid the ‘backfire’ of mitigation policies.
This thesis gives an overview of the limitations of existing approaches linking ESOMs and LCA and implements a novel approach to overcome them. Several questions related to the energy transition in the province of Quebec (Canada) are assessed with the North American TIMES Energy Model (NATEM). The main scenario investigated, modelling the consequences of greenhouse gas (GHG) mitigation targets, is assessed from a life cycle perspective. To link both the optimization and the LCA models, a set of functions and procedures are encoded in an open-source software, that can be reused in other assessments.
Results show that just a relatively narrow number of processes drive the changes in GHG, and this feature can be used to simplify the linking between TIMES and LCA models. The integrated ESOM-LCA assessment applied to Quebec indicates that global warming (GW) mitigation policies would reduce impacts on human health and biodiversity. This reduced impact is driven by reduced climate change but also other cause-effect mechanisms such as reduced water scarcity and metal contamination. Additionally, full-year building simulations of Quebec detached houses introduced as new technological options in NATEM suggest that better insulated buildings would reduce the total costs of GW mitigation. The introduction of low-carbon technologies could raise the costs of energy services by 20% but these costs could be substantially lowered with demand-side measures. ESOMs provide an interesting but limited perspective to plan energy transitions. The softlink of ESOMs with LCA is a viable approach to give a more comprehensive view of relative importance of cause-effect pathways affecting human health and biodiversity. The integrated assessment is a powerful tool to analyse a wide range of issues related to the needed energy transitions. Understanding the underlying assumptions and principles of models is also important to interpret and design assessments.
To facilitate this kind of analysis, researchers should facilitate the reusability of their works, agreeing on output formats, documenting the code underlying the analyses, and providing tools to integrate models. To this end, scriptable open-source software tools are extremely useful. This thesis attempts to put a step forward in this direction.
“[…] open your eyes and look unblinkingly at the world as it really is; be astonished by the beauty and horrified at the unnecessary suffering all around; dive into the wreckage and swim as hard as possible toward a distant and indistinct shore; doubt that your efforts made enough difference, and rethink, recalibrate, look again, link arms with others across the globe, and dive in once more." William Ayers,
v AKNOWLEDGEMENT
I than I am grateful to Prof. Ben Amor and Pierre Olivier-Pineau for trusting me to do this PhD. Both have given me academic freedom to explore whatever I thought it could be interesting and have always been welcoming to discuss the way forward. Ben and Pierre-Olivier also provided the funding for the PhD and, together with the Fonds de recherche du Quebec – Nature et technologies scholarship, made this research possible.
I thank Dr Kathleen Vaillancourt for helping me to learn how to use TIMES models. It should not go without mention the help of Prof. Adrian Williams from which I am deeply grateful. Adrian introduced me to the field of life cycle assessment when I was a master student and helped me to build a career in the field.
I would also like to thank my colleagues from the LIRIDE lab for their support. It has always been a pleasure to work by your side. I am particularly grateful to Joris, who hosted me in innumerable occasions and Marianne who helped me with the building energy simulations.
Special thanks for my friends, here and abroad, whose presence gives me so much joy, and without joy, this path would have been much harder.
Finally, I would like to thank my parents and my brother, for their support, education and love. Without them, none of this would have been possible.
1
TABLE OF CONTENTS
RESUME ... I SUMMARY ... III TABLE OF CONTENTS ... 1 LIST OF FIGURES ... 4 LIST OF TABLES ... 6 LIST OF ACRONYMS ... 7LIST OF SCIENTIFIC COMMUNICATIONS ... 8
CHAPTER 1 INTRODUCTION ... 9
1.1 Energy and environmental damage ... 9
1.2 The energy transition in Quebec ... 10
1.3 Thesis structure ... 11
CHAPTER 2 STATE OF THE ART AND RESEARCH QUESTION ... 12
2.1 Basic concepts of life cycle assessment and energy system models ... 12
2.1.1 Introduction to Life cycle assessment ... 12
2.2.2 Introduction to energy system models ... 13
2.2 Limitations of life cycle assessment and energy system models ... 15
2.3 Common vocabulary between models ... 17
2.4 Research question and objectives ... 19
2.5 Original contributions ... 20
CHAPTER 3 CHALLENGES AND OPPORTUNITIES TO IMPROVE DATA QUALITY OF ELECTRICITY PRODUCTION MODELS. A LITERATURE REVIEW. ... 21
Abstract ... 23
3.1 Introduction ... 23
3.2 Data quality issues of LCI of electricity supply ... 24
3.2.1 Geographical coverage ... 25
3.2.2 Time-related coverage ... 27
3.2.3 Technology coverage ... 29
3.2.4 Completeness ... 31
3.2.5 Consistency and reproducibility ... 31
3.2.6 Precision, uncertainty and data sources ... 32
3.3 Key research opportunities ... 32
3.3.1 Modelling changes in electricity supply ... 33
3.3.2 Filling technology data gaps ... 35
3.3.3 Structural changes in LCI ... 36
3.4 Conclusions ... 37
CHAPTER 4 : METHODOLOGICAL PROBLEMS LINKING TIMES AND LCA MODELS, A REVIEW OF THE LITERATURE... 39
Abstract ... 41
4.1 Introduction ... 41
4.1.1 Energy system models: origin and strengths ... 41
4.1.2 Advantages of integrating ESOM and LCA ... 42
2
4.2 LCA-TIMES Integration Challenges ... 44
4.3 Existing approaches to address the integration challenges ... 45
4.3.1 Mapping TIMES-LCA processes ... 45
4.3.2 Double counting ... 46
4.3.3 Integrating life cycle emissions in the optimisation problem ... 46
4.3.4 Technological representativeness ... 47
4.3.5 Dealing with multifunctional processes ... 47
4.4 Discussion and conclusions ... 47
CHAPTER 5: EXPLORING GLOBAL WARMING MITIGATION OPTIONS IN QUEBEC WITH A TIMES MODEL ... 49
Abstract ... 51
5.1. Introduction ... 51
5.1.1. Assessments based on housing stock models ... 52
5.1.2. Assessments based on energy system models ... 53
5.2. Material and methods ... 55
5.2.1. Goal and scope ... 55
5.2.2. NATEM-Quebec – general characteristics ... 57
5.2.3. Demand for energy services ... 57
5.2.4. Residential sector ... 58
5.2.5. Electricity sector ... 60
5.2.6. Scenarios ... 62
5.3. Results ... 63
5.3.1. Household heating technologies ... 63
6.3.2. Conservation measures ... 64
5.3.3. Contribution to peak demand ... 65
5.3.4. Electricity supply ... 66
5.3.5. Cost comparison ... 67
5.4. Discussion ... 68
5.4.1. Residential sector ... 68
5.4.2. Electricity supply ... 71
5.4.3. Limitations and perspectives ... 72
5.5 Conclusions ... 73
CHAPITRE 6: LIFE-CYCLE IMPACTS OF A CLIMATE CHANGE MITIGATION STRATEGY ... 75
6.1 The need for integrated approaches ... 77
6.2 Present state of ESOM and LCA integration ... 78
6.3 Goal and scope ... 78
6.4 Potential consequences of GW mitigation ... 79
6.4.1 Global warming emissions ... 79
6.4.2 Human health and ecosystem quality ... 80
6.4.3 Transition costs ... 81
6.5 Discussion ... 83
6.6 Methods: ... 84
6.6.1 Study design ... 84
6.6.2 ESOM – LCA integration ... 84
6.6.3 Impact assessment ... 85
CHAPTER 7: CONCLUSIONS AND FUTURE WORKS ... 87
7.1 Conclusions (Français) ... 87
7.1.1 Conclusions spécifiques pour le Québec ... 87
3
7.2 Conclusions (English)... 89
7.2.1 Quebec-related conclusions ... 89
7.2.2 Conclusions related to LCA and energy system models ... 91
7.3 Future works ... 91
REFERENCES ... 95
ANNEX A SUPPLEMENTARY MATERIAL CHAPTER 5 ...115
A.1 Datasets ... 115
A.2 NATEM-Quebec model ... 116
A.2.1 Transport ... 116
A.2.2 Industry ... 116
A.2.3 Agriculture ... 117
A.2.4 Commercial ... 117
A.2.5 Residential ... 117
A.2.5.1 Heating technologies and conservation measures ... 117
A.2.5.2 Comparison of recommended building envelopes for new houses and those of the existing stock ... 121
A.2.5.3 Influence of heating on electricity demand. ... 122
A.2.6 Electricity supply ... 124
A.2.6.1 Availability factors of renewable energy ... 124
A.2.6.2 Hydropower availability factors ... 125
A.2.6.3 Wind availability factors ... 126
A.2.6.4 Solar availability factors ... 127
A.2.6.5 Electricity trade ... 127
A.3 Additional results ... 128
ANNEX B: SUPPLEMENTARY MATERIAL CHAPTER 6 ...131
B.1 Review of the literature on the integration of LCA and ESOM. ... 131
B.2 Methods ... 133
B.2.1 NATEM – Quebec ... 133
B.2.1.1 Energy balance ... 133
B.2.1.2 Greenhouse gas emissions balance ... 134
B.2.1.3 Main scenarios ... 135
B.2.1.4 Update of the transport sector ... 135
B.2.1.5 Existing technologies ... 136
B.2.1.6 New technologies ... 136
B.2.1.7 Optimisation constraints ... 140
B.2.2 Goal and scope ... 141
4
LIST OF FIGURES
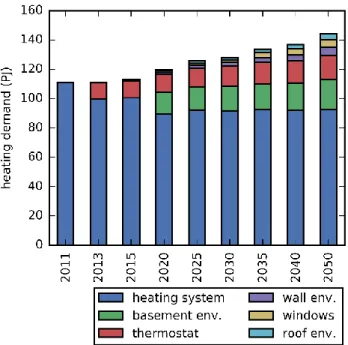
Figure 3.1: Different models comprising electricity supply: examples potential applications ... 34 Figure 5.1: cost-optimal technology mix of household heating technologies in Quebec (2011-2050) (GHG50 scenario). (Aggregated demand of the four housing types) ... 64 Figure 5.2: cost-optimal technology mix of heat supply in detached households in Quebec (2011-2050) (conservation scenario) ... 65 Figure 5.3: Cost-optimal electricity peak demand in Quebec, by sector (winters 2011, 2030 and 2050) for the BAU, GHG50 and conservation scenario ... 66 Figure 5.4: cost-optimal electricity supply mix in Quebec (2011-2050) by scenario. ... 67 Figure 5.5: additional system costs of energy supply in Quebec relative to the BAU scenario. ... 68 Figure 6.1 Potential effects of GW mitigation on global warming emissions, ecosystem quality and human health (direct and ‘indirect’ (supply chain) components). ... 80 Figure 6.2 Ecosystem quality and human health impacts disaggregated by cause-effect pathway. LT: long-term, ST: short-term ... 81 Figure 6.3: Cumulative environmental burden vs the number of processes considered in the assessment. ... 82 Figure A1: Thermal resistance of above ground walls of existing detached houses versus year of construction. ... 121 Figure A2: Normalised histogram of air tightness measurements (ACH50) of Quebec detached houses. ... 122 Figure A3: Projection of electricity demand by type of client in Quebec (2014). ... 123 Figure A4: Hourly electricity demand in Quebec vs. average temperature (seasonal averages) (2008-2015). ... 123 Figure A5: Electricity consumption per hour of the day (average for years 2008-2015). Dashed vertical lines mark the time slice divisions in NATEM-QUEBEC. Based on dataset B. ... 124 Figure A6: Boxplot of the proxy of power generation in run-of-river power plants in Quebec – grouped by season and normalised by annual generation ... 125 Figure A7: % of capacity utilisation of hydro power in Quebec (2011-2015) (monthly rolling average) ... 126 Figure A8: Boxplot of Simulated electricity production from representative wind power plants in Quebec grouped by time slice. ... 127 Figure A9: % of electricity supply in Quebec coming from imports (daily averages and
maximums) 2009-2015. ... 128 Figure A10: Contribution of imports to electricity supply in Quebec, disaggregated by exporting region. (Weekly rolling average of 2015). ... 129 Derived from Dataset C. ... 129 Figure A11: Cost-optimal technology mix of household heating technologies in Quebec (2011-2050) (GHG50 vs additional sensitivity scenarios). ... 129 Figure A12: Geographical variability of heat demand. Monthly heating degree-days in the four biggest cities in Quebec (2012-2015) ... 129
5
Figure A13: Main changes in demand of energy services in the Impr.Urban scenario with respect to GHG50 scenario (2011-2050) ... 130 Figure B1: Energy consumption per transport mode in Quebec (1990-2015). The category “other” groups all the modes that contributed less than 2% to the total energy consumption. ... 136 Figure B2: Efficiency of road vehicles per powertrain and year. ... 138 Figure B3: linear extrapolation of fuel consumption per powertrain as a function of weight. .... 139 Figure B4: Combustion emission factors of fuels per unit of energy in CO2eq units. Emission
factors are averaged per sector. Some fuels are just present in specific sectors. ... 143 Figure B5: Average market shares in personal road transport (2011-2050) by scenario. ... 145 Figure B6: Effects of LCI adaptations on CO2eq score (fuel efficiency, emission factors and fuel
switching). ... 146 Figure B7: NATEM CO2eq emissions per scenario ... 146
Figure B8 Use-phase CO2eq emissions per process: comparison of NATEM and integrated model.
... 147 Figure B9: Comparison of combustion emission factors in the LCA database and NATEM. .... 147 Figure B10: Environmental impact by sector. Grouped according to the divisions of the
6
LIST OF TABLES
Table 2.1: Vocabulary differences between LCA and ESOMs ... 18
Table 3.1 Methodological challenges in LCI of electricity supply categorized by data quality indicator. ... 24
Table 3.2: Summary of research opportunities in LCI of electricity supply, including potential uses and concerned quality indicators ... 32
Table 3.3: Key parameters of electricity production technologies required in meta-analyses... 36
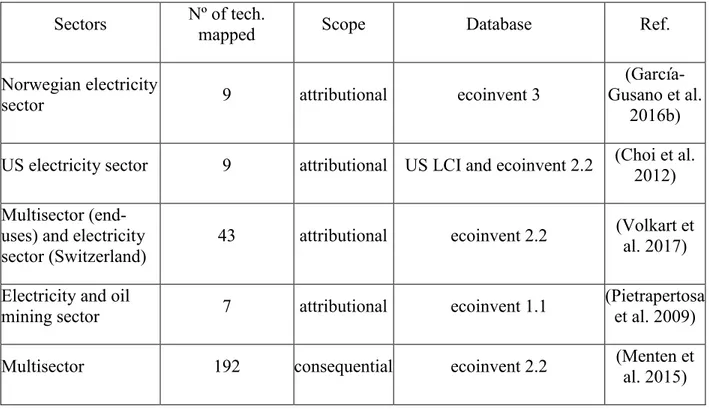
Table 4.1: Scope and number of technologies mapped in studies integrating TIMES models and LCA ... 43
Table 5.1: Characteristics of the scenarios ... 63
Table A1 Characteristics of heating technologies (2011-2050) ... 118
Table A2: Main parameters of the conservation measures. ... 119
Table A3 Tested and recommended total thermal resistance values (m2 K / W) of different components of the building envelope. ... 120
Table A4: New power plant technologies ... 124
Table A5: availability factors of different renewable energy sources ... 125
Table A6: Main contributors to GHGe in 2050 (GHG50 scenario) ... 128
Table B1: Summary of studies integrating LCA with energy system optimisation models ... 132
Table B2: Sources of CH4 and N2O EF of biofuel combustion by sector ... 134
7
LIST OF ACRONYMS
ALCA: attributional life cycle assessment CF : characterisation factor
CLCA: consequential life cycle assessment ESOM: energy system optimisation model GHG : greenhouse gas
GW : global warming
IAM: integrated assessment model IEA: international energy agency LCA: life cycle assessment LCI: life cycle inventory
NATEM: North America TIMES Energy Model RES: reference energy system
8
LIST OF SCIENTIFIC COMMUNICATIONS
The research during the thesis has resulted in a number of publications and oral presentations. It has also facilitated several publications where either I am not the first author, or they are part of related but adjacent research.
Type Reference
Submitted article
Astudillo MF, Vaillancourt K, Pineau P-O, Amor M Ben (under review) Environmental impact of deep decarbonisation of energy services. Nature Sustainability
Published article
Astudillo MF, Vaillancourt K, Pineau P-O, Amor B (2017) Can the household sector reduce global warming mitigation costs? sensitivity to key parameters in a TIMES techno-economic energy model. Appl Energy 205:486–498.
Published article
Astudillo, MF, Treyer, K., Bauer, C., Pineau, P.-O., Amor, M. Ben, 2017. Life cycle inventories of electricity supply through the lens of data quality: exploring challenges and opportunities. Int. J. Life Cycle Assess. 3, 374–386.
https://doi.org/10.1007/s11367-016-1163-0 Published
book chapter
Astudillo MF, Vaillancourt K, Pineau P-O, Amor B (2018) Integrating energy system models in life cycle management. In: Benetto E (ed) Designing
sustainable technologies, products and policies. Springer Nature, Published
book chapter
Astudillo MF, Treyer K, Bauer C, Amor M Ben (2015) Exploring Challenges and Opportunities of Life Cycle Management in the Electricity Sector. In: Sonnemann G, Margni M (eds) Life cycle management, Springer, Heildelberg, pp 295–306
Oral
presentation
Astudillo MF, Vaillancourt K, Pineau P, Amor B (2017) Integrating energy system models into consequential LCA. In: Setac Brussels 2017. Brussels, Oral
presentation
Astudillo MF, Vaillancourt K, Pineau P-O, Amor B (2017) Simplifying the integration of energy system models and LCA. In: LCM 2017. Luxembourg, Oral
presentation
Astudillo MF, Vaillancourt K, Pineau P-O, Amor B (2017) Rethinking the integration of energy system and life cycle assessment models. In: LCA XVII conference. Portsmouth, NH, October 2-6,
Published article
Astudillo MF, Azarijafari H (2018) Estimating the global warming emissions of the LCAXVII conference : connecting flights matter. Int J Life Cycle Assess 23:1512–1516.
Published article
Kuczenski B, Marvuglia A, Astudillo MF, et al (2018) LCA capability roadmap product system model description and revision. Int J Life Cycle Assess.
Published article
Pedinotti-castelle M, Astudillo MF, Pineau P-O, Amor M Ben (2019) Is the environmental opportunity of retrofitting the residential sector worth the life cycle cost? A consequential assessment of a typical house in Quebec. Renew Sustain Energy Rev 101:428–439.
9
CHAPTER 1 INTRODUCTION
1.1 Energy and environmental damage
Societies rely on energy commodities to fulfil their day to day needs, from transport and heating to the variety of services provided by electricity. During the last century, humankind has sharply increased their consumption of energy, improving living conditions for many, but also leading to large environmental damage (Smil 2004). For instance, nearly two-thirds of global greenhouse gas (GHG) emissions come from the energy sector.
Profound changes in the energy system are required to limit the harmful effects of global warming, and energy system optimisation models (ESOM) are at the core of global warming (GW) mitigation planning efforts (Pauliuk et al. 2017). These models help to design cost-optimal mitigation strategies, comparing technologies that deliver similar services. Well-known examples include global integrated assessment models (IAMs), but ESOMs are also used to design national or provincial energy transitions. Strategies often rely on higher levels of electrification and “decarbonisation” of electricity supply. However, the provision of energy services1 is also
associated with other harmful consequences like water scarcity or ocean acidification, that have the potential to jeopardise human wellbeing further and are not consistently addressed in ESOM. Life cycle assessment (LCA) methods have gained traction in recent years to evaluate the potential effects on the environment of goods and services comprehensively. Life cycle inventories (LCI) include thousands of substances which are aggregated into indicators using impact assessment methods. These methods include many cause-effect pathways, from ocean acidification to particulate matter formation, and they can quantify potential effects on human health or ecosystems. LCA helps to analyse production systems systematically and find ways to reduce their impact. LCA has been instrumental to detect burden shifting, for example, in the case of first-generation biofuels (Hellweg and Milà i Canals 2014). Biofuels were at first considered as a benign option, but this technological approach “backfired” when other environmental mechanisms were considered (Hellweg and Milà i Canals 2014). “Indirect” land use change illustrates the importance of considering market-mediated mechanisms in decision making (Lapola et al. 2010; Creutzig et al. 2012). In LCA market-mediated effects are assessed using the consequential LCA approach (CLCA), which attempts to model the effects of changes in a production system. CLCA differs from the more common Attributional LCA (ALCA), which attempts to characterise the impact of a given product system. However, to date, the attempts to combine ESOM and LCA have focused on ALCA (Astudillo et al. 2018).
Models can be hard-linked (i.e. model interaction is controlled by software) or soft-linked (passing of information is controlled by users) (Wene 1996). Softlinking has the advantage of practicality, transparency and learning, and it is the starting point for linking models based on different
1 Energy services are the ends for which the energy system provides its means. Examples include the transport,
household thermal comfort, or lighting. The energy system encompasses all the components related to the production, conversion, and use of energy.
10
approaches (Wene 1996). The field is not mature enough for hard-linked models and this thesis opts for soft-linking TIMES and LCA models.
1.2 The energy transition in Quebec
This thesis analyses the energy transition of Quebec as a case study of how and why to integrate ESOM and LCA. Quebec is the second most populated province of Canada. Sparsely populated and with vast hydropower resources, most of its citizens live in humid continental climatic zone. Quebec aims to reduce GHG by 80% by 2050, which would mean emissions per capita in line with the Paris agreement. However, with 195 GJ of energy per capita in 2016 (Whitmore and Pineau 2018), it nearly quadruples the average per-capita energy consumption in the world, which strongly suggests there are opportunities for energy efficiency (Whitmore and Pineau 2018). The energy consumption is roughly equally divided between industry, transport and buildings (Whitmore and Pineau 2018).
On the supply side, the most relevant sector is electricity production, since it is vital in GW mitigation efforts (Astudillo et al. 2017a), and Quebec is a powerhouse of renewable electricity and historically a net exporter. Most of the electricity is produced in hydropower plants of the state-owned utility Hydro-Quebec, while all hydrocarbons are imported. However, building new hydropower plants is increasingly expensive, and their life-cycle GHG are rarely considered. Wind or solar are increasingly used around the world, but their intermittency may be an issue. The local government subsidises electricity from biomass residues, but there may be better ways to use this abundant local resource. Which approach would be the cheapest way to expand low-carbon electricity in Quebec remains unclear.
The household sector has clear potential for improvement. Around half of the total electricity production is consumed in buildings, mostly for heating purposes. Heating is also responsible for up to 50% of the peak electricity demand in winter. Most of the houses are heated using resistive heating systems, which transform a very versatile energy vector into low-temperature heat, the most ‘degraded’ one2. The use of resistive heating systems is affordable because households pay
do not pay electricity at its marginal costs3. The pricing policy incentivises an ‘inefficient’ use of
resources, incentivising household electricity consumption at the expense of other uses (Pineau 2009). Considering the marginal costs of energy supply would clarify which technologies help to bring down societal costs.
Another sector of interest is road transport. It is the largest consumer of fossil fuel products, and the largest emitter of GHG (Whitmore and Pineau 2018). Road freight and passenger transport are the largest consumers, followed by air transport (Whitmore and Pineau 2018). Regional energy policies foresee the use of natural gas powertrains in trucks as the strategy to reduce GHG (Govt. of Quebec 2016), although reference reports highlight that when life-cycle emissions are
2 In thermodynamic terms, using electricity to generate heat would be a net loss of ‘capacity to do work’ (exergy). 3 According to microeconomic principles goods should be priced at their marginal cost (i.e. the cost of producing the
last unit of a good to be efficient. Efficient in this context means that society is operating in the ‘utility’ possibility frontier (Dorman 2014).
11
considered, emission reductions of gas-conversion are minor (IEA 2017). International organisms highlight natural gas is only an intermediate solution for freight transport (IEA 2017) and policies not looking in the long-term could result in stranded assets that difficult energy transitions (Moultak et al. 2017). The regional energy policy considers also taking energy consumption into
consideration in urban planning, although it is unclear how. At national level, studies considering
alternative urban developments have shown substantially lower transition costs (Trottier energy futures project 2016), which may also apply to Quebec. In sum, bringing a long-term, economic approach, combined with a life-cycle assessment could be very useful for local energy policies.
1.3 Thesis structure
Chapter 2 summarises the state of the art on the integration of ESOM’s and LCA, starting by a brief description of both fields. It is built substantially on chapters 3 and 4 and some elements of chapter 6. The chapter ends with the research questions and outlines the expected original contributions of the research.
Chapter 3 reviews challenges and opportunities to improve LCIs of electricity supply from a data quality perspective. Electricity warrants special attention to energy transitions because it is pivotal in decarbonisation scenarios. It also has special features, such as our limited capacity to store it, that requires particular modelling. The chapter was published as an article in The International
Journal of Life Cycle Assessment.
Chapter 4 reviews the challenges of integrating ESOM and LCA. It focuses on past attempts to combine models from the TIMES framework, among the most widely used ESOM (Pfenninger et al. 2014). It identifies the mapping of technologies (i.e. the identification of equivalent processes between two models) as a critical problem to link large ESOM and LCA. The chapter was published in the book Designing sustainable technologies products and policies. Both chapter 3 and 4 are a review of the state of the art of the integration of ESOM and LCA.
Chapter 5 uses a version of NATEM (North America TIMES Energy Model) to create scenarios of the energy transition in Quebec. The study concentrates on the opportunities of technological and demand transformations in the household sector. The study was published in the journal
Applied Energy.
Chapter 6 improves the scenarios of chapter 5 updating the modelling of the transport sector, The most significant contributor to GHG in Quebec. The updated NATEM model is used to assess the potential consequences of global warming mitigation strategy compatible with the 1.5°C target. The chapter details the software created to integrate both modelling approaches. The manuscript was submitted for publication to the journal Nature Sustainability.
Chapter 7 summarises the conclusions of the integration exercise and proposes new potential methodological developments.
Annexes A an B include the supplementary information of the publications associated with chapters 6 and 7.
12
CHAPTER 2 STATE OF THE ART AND RESEARCH
QUESTION
This chapter starts with a brief introduction to LCA and ESOMs, introducing some concepts and vocabulary that are needed to understand the thesis. Both ESOM and LCA use different terms to refer to very similar concepts, and the differences in nomenclature are needed to “navigate” the linking between both models. The first part of the chapter is largely based on two published articles (chapters 3 and 4), which document the state of the art in the modelling of the electricity sector and on the integration a particular strand of energy models with LCA. The chapter ends with the statement of the research question and the research objectives.
2.1 Basic concepts of life cycle assessment and energy system models
2.1.1 Introduction to Life cycle assessment
LCA is a widely used methodology to quantify the environmental impact of goods and services “from cradle to grave” (Hellweg and Milà i Canals 2014). LCA methods are standardised by ISO (ISO 2006a, b). LCAs are usually conducted in four steps: formulation of the goal and scope definition, a compilation of the inventory of flows, impact assessment phase and interpretation. It usually requires an iterative process, whereby the model is improved until it can respond to the goal of the assessment.
The goal and scope define the purpose of the assessment and establish details about the product system under study. Among the essential elements to define is the “functional unit”, which quantifies the functions of the system under study. In an energy system this function is quantified by several flows such as “x petajoule (PJ) of heat for residential houses” or “y million passenger-kilometers (MPkm) of road transport”. In LCA there are two broad assessment types. Attributional LCA (ALCA) analyses the impact of a given production system and consequential LCA (CLCA) studies the consequences of changes in production systems. Market forces often mediate these changes, Therefore, an analysis of market-mediated changes is required (Weidema et al. 1999; Creutzig et al. 2012). The market analysis in LCA traditionally relies on a step-wise procedure, used to systematically identify which technology will respond to a change in demand, referred in the literature as marginal technology (Weidema et al. 1999). The LCI should include all the processes that have been affected by the intervention and this has special implications for processes that produce multiple products. In the case of joint production of co-products, the displaced production by co-products is considered in the inventory, on what is known as substitution approach (Majeau-Bettez et al. 2017).
During the inventory phase the mass, energy flows and services provided by a given activity are quantified in a life cycle inventory (LCI). An activity generates products or services that can be then used by other activities. Therefore, activities can be connected to describe the production systems that fulfil the functional unit. Production systems can go from simple processes to global supply chains. This “bottom-up’ description of production systems is called process-based LCA. Products can be produced by different technologies, and often (like in this thesis) the terms activity, process and technology refer to “things that happen” (Kuczenski et al. 2016). LCA traditionally
13
differentiate two types of flows: elementary flows and intermediate flows. “Elementary flows”, are either released or extracted from the environment without previous or subsequent transformation (ISO 2006b). Elementary flows, also known as biosphere exchanges are what is broadly understood as “emissions” to the environment on ESOM (Huppmann et al. 2018). Intermediate flows are also named ‘technosphere flows’. Here the terms exchange and flow are also used indistinguishably. These flows have associated metadata, notably their quality. The better the quality of an inventory is, the more reliable it is and the lower its epistemic uncertainty is. LCAs rely on databases compiling generic production systems, as building blocks of product systems, being ecoinvent (Wernet et al. 2015) the most commonly used for research purposes. Usually, the modeller adapts and creates a limited number of processes on what is known as the ‘foreground’, and relies on existing databases for the rest (the background) (Wernet et al. 2015). LCI only account for a limited number of flows associated to processes or product systems. For example, an insurance is required to drive a car, but burdens from operating insurance companies are rarely included in LCIs of cars. ISO recommends to define specifications of which flows will be omitted, known as “cut-off” criteria (ISO 2006b). ISO norms recommend to use mass, energy and environmental contribution as criteria (ISO 2006b), although research articles rarely specify them.
During the impact assessment phase, elementary flows are aggregated into indicators of environmental impact via the modelling of multiple cause-effect chains. These cause-effect chains are quantified in characterisation factors (CF), which enclose information about effects, exposure and fate (Hauschild and Huijbregts 2015) of substances. A well-known example of CFs are the global warming potentials of GHG, used to aggregate them into CO2eq emissions. LCA distinguish
between “midpoint” and “endpoint” indicators. Midpoint indicators quantify impact in an intermediary point of the impact pathway, while “endpoints” model all the way to the “areas of protection” (i.e. things we care about). Common areas of protection include human health, the natural environment and natural resources. The advantage of midpoint indicators is that they are more robust (i.e. less uncertain), the disadvantage is that they are less meaningful for decision making (Hauschild and Huijbregts 2015).
2.2.2 Introduction to energy system models
The energy system has been defined as “combined processes of acquiring and using energy in a given society” (Pfenninger et al. 2014). To understand what modellers in this domain mean by “energy commodities” it is useful to know that they were initially developed during the oil crisis (Pfenninger et al. 2014) and that the guiding principle to measure energy was the replacement of fossil fuels (Frischknecht et al. 1998). Therefore, energy system models analyse the supply and use of services supplied by fossil fuels and their potential substitutes. The demand for end-use services is the LCA equivalent to reference flows needed to fulfil the functional unit. These services may include transport, heating, but also the wide variety of services provided by electricity, depending on the scope of the assessment.
There are many varieties of energy system models, but this thesis focuses on bottom-up optimisation partial-equilibrium multisector models, the most adequate to study decarbonisation of multiple sectors (Astudillo et al. 2017a) and the backbone of energy system models (Pfenninger et al. 2014). More precisely, this thesis works with models of the TIMES framework, probably the most widely used ESOM (Pfenninger et al. 2014). The same approaches would be applicable to other similar models such as the open-source OSeMOSYS or MESSAGE.
14
Bottom-up models have detailed descriptions of the components of the energy system, with a technological resolution similar to process-based LCA. Processes (also referred as technologies (Huppmann et al. 2018)) produce energy commodities (technosphere flows in LCA) or emissions (biosphere flows in LCA) and the ensemble of the production system is known as reference energy system (RES). The RES is what in LCA is called “product system”. Bottom-up models are also called “technology-rich models” because of the variety of technologies described in the system. Models can easily have more than 4,000 technologies defined (chapter 5). The partial-equilibrium assumption means that markets outside the system under study are assumed not to be affected by changes within the system. For example, changes in the demand for oil from Quebec are assumed not to affect global oil markets. This notion is similar to the concept of “background” and “foreground” in LCA, where the foreground is the RES under study, and the background is not affected by changes within the system.
The purpose of ESOMs is to help planning future infrastructures, using economic optimisation to identify desirable futures (hence its normative nature). Cost-optimal systems maximise the ‘utility’ of the system, measured as the total surplus, an indicator of total social welfare (Loulou et al. 2005; DeCarolis et al. 2017), therefore optimised solutions are considered desirable. To simplify the optimisation problem, perfect competition is a common assumption in these models. However, many models start to incorporate consumer preferences to better reflect “real-world transitions”. Therefore, ESOMs are not purely normative and also aim to have some explanatory power of how the future may unfold. ESOMs can have constraints to the optimisation problem. These can be used to restrict the space of desirable futures (e.g. limiting the total greenhouse gas emissions). Constraints can represent technical impossibilities (e.g. range limitations of battery-based vehicles) and are also used to model more realistic technological uptakes.
One of the limitations of ESOMs is their oversimplified modelling of human behaviour, which is known to deviate from cost-optimisation (Tversky and Kahneman 1974; Creutzig et al. 2018). This limitation is more relevant when models are used to explain what can happen than when used for normative assessment (i.e. to determine what choices should be made). It has long been argued that, argued that normative and descriptive analysis of choice should be separated, because of the limitations of rational-choice models to represent real-world situations (Tversky and Kahneman 1986). Still, retrospective analyses of the UK electricity sector show that real-world transitions deviated from cost-optimal scenarios, but cost were still one of the key drivers of transition (Trutnevyte 2014). The real transition fell within the region of near-optimal solutions and the author conceded that “cost optimization may not be a completely inadequate proxy for the real-world transition” (Trutnevyte 2014). Yang and Heijungs have argued that when using economic models for CLCA, assumptions on rationality should be relaxed and insights from behavioural (empirical) economics should be included (2017). The field of behavioural economics has shown how that humans deviate from cost-optimisation with systematic biases such as risk aversion or poor forecasting (Dorman 2014). Some of these systemic deviations can indeed be incorporated in TIMES models, using e.g. myopic foresight or pre-defined market shares (Astudillo et al. 2018). However, there are risks when trying to model “realistic” behaviour. Modelers may add constraints or higher hurdle rates to represent realistic technological adoptions, but given the lack of empirical evidence, there is the risk of adjusting them so the model conforms to their pre-conceptions on how the future may unfold (DeCarolis et al. 2017). This is why best-practices recommend to thoughtfully document assumptions and back them with empirical evidence. In order to facilitate the normative interpretation of results, constraints should be kept to the minimum. The removal of
15
constraints also allows conceiving “unexpected knowns” which have been overlooked in the past (Trutnevyte et al. 2016).
ESOMs provide a range of results, including future technology capacity and utilisation, marginal commodity prices or total GHG emissions. These models are now widely used in climate change mitigation plans (DeCarolis et al. 2017). Their level of complexity can vary, from models of cities to global models. Their complexity can grow further and be linked to climate models and agricultural models. These hybrid models are called Integrated assessment models (IAMs), an example being the TIMES Integrated assessment model (TIAM) (Glynn et al. 2015).
Canadian ESOMs
This research project did not intend to create a new energy model, which would be a thesis on its own, but rather use existing models. A quick overview to the existing models for Canada (Table 1 in (Layzell and Beaumier 2018)) illustrates that the North American TIMES Energy Model (NATEM) is the only bottom-up optimisation model of Canada. It is also available at the provincial level, therefore valid to study the case of Quebec. Being of the TIMES family, which is used by 77 institutions in 37 countries (Layzell and Beaumier 2018), solutions applied to NATEM can be extended to other cases. NATEM has been used to study a range of issues, from provincial to national (Vaillancourt et al. 2017, 2018, 2019).
2.2 Limitations of life cycle assessment and energy system models
LCA limitations
In the context of modelling energy systems, LCA has big limitations to model representative and complete inventories (Astudillo et al. 2017a). The step-wise procedure used in CLCA cannot grasp the complex interactions in the energy systems and LCA needs other models to foresee which technologies will be part of future energy systems and which would be their characteristics (Astudillo et al. 2017a). For example, a new heat-pump may substitute gas-fuelled boilers, but this uptake will impact prices of gas and electricity, affecting other interconnected markets. LCA also assumes linear response to changes, ignoring non-linearities considered by energy models (Yang and Heijungs 2017). Examples of non-linear response may arise from reaching constraints, such as available potential for hydropower expansion.
LCA is also ill-prepared to understand the economic implications of energy transitions, and these implications are essential for the feasibility of energy transitions. Finally, integration with ESOMs may erode model transparency, unless the model is well documented (Astudillo et al. 2017a). Multisector ESOM limitations
The main limitation of ESOMs to analyse the impact of economic activities on humans or ecosystems is their limited modelling of cause-effect mechanisms. ESOMs only model a few emissions (Astudillo et al. 2017a, 2018; Pauliuk et al. 2017). In their most comprehensive forms, they integrate land-use modelling (e.g. (Huppmann et al. 2018)) but they lack the comprehensive impact assessment methods and inventory of LCA.
16
ESOMs like LCA, require data of future technologies, and although generic data from other models is often valid, parameters of some technologies need to be regionally adapted. This is notably the case for variable renewable energy (i.e. wind, solar and run-of-river), changes in the building envelope of buildings (Astudillo et al. 2017b).
Technology-rich models define the ‘function of the system’ by the definition of end-use services. End-use services (e.g. household heating), are usually subdivided into different groups with demands that evolve independently (e.g. apartments, houses). This division of demand is crucial because it determines the substitutability of services. Division of energy services (e.g. transport by large cars, SUVs or buses) is meant to model the heterogeneous consumer preferences (DeCarolis et al. 2017). However, it rules-out potential mitigation opportunities, such as increased use of public transport or switching housing types, which may be very effective. This feature has been described as “reductionist fallacy” where it assumed that components of the energy demand would remain the same in the foreseeable future (Wene 1996).
TIMES - LCA studies
Bottom-up multisector ESOMs like those of the TIMES family have clear advantages to study a case like Quebec, where most of the GHG emissions occur outside the electricity sector but require electricity to reduce emissions (Astudillo et al. 2017a). They have also a similar level of “resolution” minimising information loss between models.
The integration of TIMES and LCA models pass by exchanging information at process/technology level. There is a growing number of studies linking TIMES and LCA, reviewed in Astudillo et al. (2018) (chapter 4). Since its publication, some other related publications emerged, notably (Arvesen et al. 2018; Mendoza Beltran et al. 2018; Volkart et al. 2018). The remaining methodological challenges can be summarised as follows:
Completeness (Mapping processes between both models): large TIMES models often have several thousands of technologies defined and are continuously updated. Finding and adapting an equivalent to those technologies to LCA counterparts is unfeasible. Even if not all are involved in a given scenario, when analysing changes in the system, often several hundreds of processes are affected by interventions (Astudillo et al. 2018), which is a similarly daunting task. To date, the only existing CLCA assessment has been done on a model with a reduced number of technologies (Astudillo et al. 2018, 2019). Astudillo et al. (2018) proposed the use of a cut-off rule to address the mapping problem, using the GHG accounting of the TIMES model as cut-off criteria.
Representativeness: LCA databases such as ecoinvent represent existing production systems, but databases would need to be adapted to represent future ones, coherent with ESOMs modelling. The adaptation involves harmonising parameters such as efficiency, or changes in fuel mixes. Just very recently, Mendoza-Beltran et al. (2018) have started to tackle a systematic adaptation of efficiencies using data from IAMs. However, the procedure is meant to adapt the background of the system, not the foreground, which is the part affected by the energy policy. In TIMES models the same process can have different efficiencies over time. Therefore the average efficiency in a time period depends on when the investment takes place and is scenario specific. These procedures would need to adapt fuel consumption as well as emissions to model the effect of fuel changes.
17
Double counting: we identified double counting as a problem in previous studies (Astudillo et al. 2018). Double counting will occur if ESOMs and LCA are ‘connected’ carelessly at different parts of the supply chain. For example, an energy system could have electricity production process and a plug-in car consuming part of this electricity. If the production volumes of both processes are included in the demand, burdens from electricity use by the plug-in car would be double counted. Volkart et al. proposed a viable approach and applied to a MARKAL model very recently (2018). The idea is to set to zero the technosphere flows associated with energy commodities present in the TIMES model. This approach is viable but challenging to implement together with a cut-off approach proposed in Astudillo et al. (2018) and implemented in Astudillo et al. (submitted) (Chapter 6).
Another type of double counting occurs when TIMES models include as final demands what are intermediate products in LCA product systems. For example, heavy freight transport is a final demand in NATEM but other final demands require heavy freight transport as intermediate services. These dependencies are not modelled in TIMES models, and but are included in LCA product systems. This can result in double-counting and inaccuracies in the modelling (Astudillo et al. 2018). Ideally, changes in final demands (e.g. electrification of road freight or changes in the production of clinker) should be taken into account in LCI of processes in the region under study. Moreover, the total demand from LCA production systems should be discounted from the demands as defined by the TIMES model. However, it is unclear if these increases in accuracy are worth the effort, and procedures to quantify the impact of these ‘feedback’ effects are needed.
Transparency and reproducibility: except for some studies (Rauner and Budzinski 2017; Mendoza Beltran et al. 2018) the inner workings of integration efforts have not been made public. A workshop of LCA researchers working on this domain found that there is a lot of overlap and wasted efforts because of, among other things, lack of transparency on the data manipulation steps (Vandepaer and Gibon 2018). The use of open-source software and common procedures were seen as step-forward to avoid waste of resources (Vandepaer and Gibon 2018). Reusability can indeed improve the impact of research, while transparency is vital to the credibility of the results, inside and outside academia.
2.3 Common vocabulary between models
To link models there should be areas of overlap where both models have representations of the same reality (Wene 1996). Models should have a common specification of concepts, terms and definitions to communicate effectively, also referred as ontology (Pauliuk et al. 2016). Therefore, an initial step is to identify these areas of overlap.
TIMES commodities have several numeric and non-numeric characteristics that are common with LCA exchanges that can be used in the integration process. TIMES has a wider range of exchange typologies: energy, material, demand service, emissions and financial. The distinctions are enough to differentiate technosphere (energy, material and demand services) from biosphere flows (emissions). It also allows to identify the reference flows (ISO 2006b) from other technosphere -intermediate- flows. TIMES commodities, as LCA exchanges have units, which need to balance equations.
18
TIMES processes also have characteristics similar to those of LCA processes. While LCA processes are typically divided into market processes or transforming activities, TIMES processes have a wider typology range. Of particular use is the differentiation of importing and exporting processes, and processes delivering final demands (Gargiulo et al. 2016). Both exports and -internal- demand represent the overall demand for energy services of the model. TIMES processes can have efficiencies, which can be a function of inputs (e.g. a gas power plant being less efficient when using oil) or outputs (e.g. heat pumps being more efficient to deliver heat than refrigeration). Efficiencies can also change with time to represent technological progress, this means the same process can have different efficiencies in different scenarios, depending on when investment takes place. Unlike LCA, processes and generated commodities can have different units. For instance, a car may have Vehicle km as activity units and deliver the commodity in persons km. This requires an extra attribute (ACTFLO) (Gargiulo et al. 2016) which in this case represents the average occupancy (persons per vehicle). This attribute is also useful as sometimes LCA processes are defined in person km, vehicle km or tone km.
Emissions can be either associated with the consumption of a commodity (e.g. CO2 emissions per
tonne of coal burned) or the output of an activity (CO2/kWh electricity). NATEM opts for defining
emissions factors as a function of fuel input, the same procedure used in national inventories of GHG emissions (Environment Canada 2017). Therefore, emissions per unit of activity depend on the efficiency, activity levels, and the type of fuel consumed.
Table 2.1: Vocabulary differences between LCA and ESOMs
LCA term ESOM term
Activity / process Process / technology
Biosphere exchange / elementary flow Emission Technosphere exchange/ intermediate
flow
Energy commodity
Reference flows End-uses
Background What is outside the partial-equilibrium model
foreground What is inside the partial-equilibrium
model
19
2.4 Research question and objectives
The decarbonisation of energy services is increasingly pressing, and integrated approaches are needed to avoid unintended harmful consequences. These potential consequences can be foreseen through the integration of LCA and ESOMs (Astudillo et al. 2017a, 2018).
This thesis intends to elicit which are the cost-optimal technological options to reduce GHG emissions from the energy system in Quebec, and if the introduction of these technologies will “backfire” (i.e. result in additional impacts unforeseen by ESOMs) when analysed from a life cycle perspective. Additionally, an objective is to know the nature and amount of the transition economic costs. These questions are a specific formulation of the more generic question “how to softlink large bottom-up ESOMs and LCA to analyse the potential consequences of energy transitions?”.
Large refers to models with several thousands of technologies defined.
Answering this question can be subdivided in the following intermediate objectives: 1. Revise the state of the art on the linking of ESOMs and LCA
2. Adapt NATEM-Quebec to address specific policy questions related to the household and transport sector:
• Which heating systems should be used to reduce societal costs?
• Would better-insulated buildings be a cost-effective mitigation option? • How different urban planning would affect transition costs?
• If the GHG from reservoir impoundment are considered in NATEM, would it affect the solution?
• How does the generation of variable renewable energy (wind, solar and run-of-river) and imports match the electricity demand, concentrated in winter?
• Which powertrains are the cheapest options to reduce emissions in the long-term? • Which are the cost-optimal ways to produce electricity when emissions from reservoirs
and temporal distribution of variable renewable energy are considered?
• How much the energy transition could cost and what is the nature of these costs? 3. Link NATEM and LCA databases to conduct CLCA, addressing the gaps in the literature,
namely
• Overcome the complexity of mapping two large bottom-up models.
20
• Create an LCI that can be subject to contribution analyses. This implies not doing corrections at ‘indicator level’ but instead build a coherent LCI.
• Validate combustion emission factors
2.5 Original contributions
• Identification of methodological needs on the integration of ESOMs and LCA • Improvement of NATEM-Quebec to analyse specific policy questions.
o Link NATEM-Quebec with building simulation to evaluate new thermal envelopes. o Time series analysis to characterise variable renewable energy (wind, solar and
run-of-river), the temporal distribution of heat demand and temporal availability of imports.
o Update transport (road passenger, road freight and air) and heating technologies to model future technologies adapted to the regional context.
• Develop a reproducible method to integrate technology-rich ESOMs and LCA o Develop an approach to simplify the mapping between ESOMs and LCA.
o Develop methods to adapt inventories of existing technologies to represent future ones.
o Evaluate the impacts on biodiversity and human health of a global warming mitigation strategy allowing for contribution analyses.
o Develop methods to quantify ‘feedback effects’ (i.e. the effects of changes in what TIMES models consider final demands and LCA intermediate services) and potential ‘double counting’.
o Compare combustion emission factors.
• Evaluate the potential costs of a GW mitigation policy in Quebec and the main factors associated with these costs.
21
CHAPTER 3 CHALLENGES AND OPPORTUNITIES
TO IMPROVE DATA QUALITY OF ELECTRICITY
PRODUCTION MODELS. A LITERATURE REVIEW.
Avant-propos
Auteurs et affiliation.
Miguel Fernandez Astudillo, étudiant au doctorat, Faculté de génie, Département de génie civil et génie du bâtiment, Université de Sherbrooke
Karin Treyer, Paul Scherer Institut, Département d’évaluation des technologies, Suisse Christian Bauer, Paul Scherer Institut, Département d’évaluation des technologies, Suisse Pierre-Olivier Pineau, professeur, Département de sciences de la décision, HEC Montréal
Ben Amor, professeur, Faculté de génie, Département de génie civil et génie du bâtiment, Université de Sherbrooke
Date d’acceptation: 16 Juillet 2016
État de l’acceptation : version finale publique
Référence:, Astudillo, M.F., Treyer, K., Bauer, C., Pineau, P.-O., Amor, M. Ben, 2017. Life cycle inventories of electricity supply through the lens of data quality: exploring challenges and opportunities. Int. J. Life Cycle Assess. 3, 374–386. https://doi.org/10.1007/s11367-016-1163-0 Titre en français: Inventaires du cycle de vie de la production électrique suivant une perspective de qualité des données.
Contribution au document : revue de littérature sur la modélisation de la production d’électricité en analyse du cycle de vie.
Résumé :
Objet : La génération d’électricité est l’un des principaux contributeurs à l’impact environnemental global et son rôle en tant que vecteur d’énergie devrait se développer considérablement. Par conséquent, des inventaires fiables et précis des flux de matières et d'énergie associés à la fourniture d'électricité sont essentiels dans les évaluations environnementales. Cet article a pour objectif de résumer les défis et les opportunités existants dans la modélisation des inventaires de cycle de vie (ICV) de l’approvisionnement en électricité, du point de vue de la qualité des données.
Méthode: Nous passons systématiquement en revue l’état de l’art en matière ICV de l’approvisionnement en électricité actuel et futur. L'analyse est structurée en fonction des
22
caractéristiques de qualité des données proposées dans l'ISO 14044: 2006: représentativité, exhaustivité, cohérence, reproductibilité, incertitude, sources de données et précision.
Résultats et discussion: En examinant les ICV existants du point de vue de la qualité des données, nous constatons des difficultés pour obtenir des données représentatives sur le plan temporel et technologique, tandis que des données représentatives sur le plan géographique ne sont toujours pas disponibles pour certaines régions. De plus, les méta-analyses ont rencontré des problèmes de reproductibilité, qui, combinés à un manque de cohérence entre les études, gênent la comparabilité entre les études. De plus, certains flux tels que les émissions fugitives ont été sous-estimés. Les problèmes mentionnés ont un impact négatif sur la qualité des ICVs. Nous fournissons ici des recommandations sur la manière dont plusieurs méthodes telles que les modèles d'équilibre, la régression ou le paramétrage peuvent être utilisées pour améliorer la qualité des données, étayées par des formats de données plus puissants. Des modèles open-source, des plateformes de données ainsi qu'une liste des paramètres clés à déclarer sont suggérés pour faciliter la reproductibilité et améliorer la transparence de l'ICV.
Conclusion: Plusieurs méthodes et ressources peuvent être utilisées pour améliorer l’ICV de l’approvisionnement en électricité, permettant ainsi des analyses plus ambitieuses et plus puissantes. Néanmoins, il convient de faire attention aux compromis entre différents aspects de la qualité des données. Par exemple, des modèles plus complexes et précis peuvent entraîner une perte de transparence et de reproductibilité, à moins que des efforts supplémentaires de documentation ne soient déployés. D'autres approches, telles que la paramétrisation systématique, ne compromettent pas la qualité des données et devraient être utilisées pour améliorer la cohérence et la reproductibilité des inventaires.
23
Abstract
Purpose: Electricity is one of the main contributors to global environmental impacts, and its role as an energy carrier is expected to grow substantially. Consequently, reliable and accurate inventories of material and energy flows associated with electricity supply are essential in environmental assessments. This article aims to summarize existing challenges and opportunities in the modeling of life cycle inventories (LCI) of electricity supply from a data quality perspective. Method: We systematically review the state-of-the-art in LCI modelling of current and future electricity supply worldwide. The analysis is structured according to the data quality characteristics proposed in ISO 14044:2006: representativeness, completeness, consistency, reproducibility, uncertainty, data sources and precision.
Results and discussion: Looking at existing LCI through the lens of data quality, we observe difficulties in obtaining temporally and technologically representative data, while geographically representative data is still unavailable for some regions. Moreover, meta-analyses encountered issues of reproducibility combined with a lack of consistency across studies, impeding inter-study comparability. Additionally, some flows such as upstream fugitive emissions have been underestimated. The aforementioned issues have a negative impact on the quality of LCI. Here we provide recommendations on how several methods such as equilibrium models, regression or parameterization can be used to improve data quality, underpinned by more powerful data formats. Open-source models, data platforms as well as a list of key parameters to be reported are suggested to facilitate reproducibility and enhance transparency of electricity LCI.
Conclusion: There are several methods and resources that can be used to improve LCI of electricity supply, enabling more ambitious and powerful analyses. Nonetheless, special care should be taken concerning tradeoffs between different data quality aspects. For instance, more complex and accurate models may result in a loss of transparency and reproducibility unless additional reporting efforts are conducted. Other approaches, such as systematic parameterization do not compromise data quality and should be used to improve the consistency and reproducibility of inventories. Keywords: electricity, LCI, consumption mix, data quality, representative, uncertainty
3.1 Introduction
Electricity supply is often highlighted as a significant hot spot in LCA results for a majority of product and service life cycles (e.g. (Curran et al. 2005; Treyer and Bauer 2013)). It is one of the main sources of environmental burden in several sectors such as buildings or information and communication technology (IEA 2013a; Arushanyan et al. 2014). Electricity supply was also the largest emitting sector, with around 38% of direct world CO2 emissions in 2013 (IEA 2015).
Several facts illustrate the growing importance of the electricity sector in the global economy. Since 1970, the electricity share of overall energy demand has risen from 9% to 17% (IEA 2014a). The trend is likely to accelerate because most of the climate change mitigation scenarios pass by a gradual electrification of energy supply, substituting fossil fuels in services such as transport and household heating (Williams et al. 2012; IEA 2014a). The International Energy Agency (IEA 2014a) predicts a rise between 80% and 130% of current production levels by 2050 in its climate
24
change mitigation scenarios. Global electricity production is also expected to change radically to meet climate mitigation targets, with increasing penetration of intermittent renewable energy systems and increased use of novel technologies such as carbon capture and storage and smart grids (IEA 2014a).
In life cycle assessment (LCA), inventorying material and energy flows is one of the most critical and time-consuming phases of the analysis. Back in 2001 a special workshop on life cycle inventories (LCI) of electricity production covered many of the challenges faced in LCI of electricity (Curran et al. 2005). The topical areas identified in advance and discussed included marginal vs. average mixes, co-product allocation, system boundaries, current and future technologies. The LCI of electricity has improved since, but several issues are still prevalent. In addition, various guidelines on how to build generic LCI datasets have been set up and published (ISO 2006b; UNEP 2011), which should be considered today.
This review aims to provide an updated vision of electricity LCI from a data quality perspective, covering inventories along the supply chain of the technologies and at the electricity mix level. Developing inventories of sufficient quality to meet the increasingly complex LCA scopes is a challenging task. We summarize and discuss these challenges and propose approaches to overcome them. Potential applications of the review include critical assessments of the quality of electricity LCI (section 3.2) and the identification of methodological approaches with potential to improve data quality (section 3.3). The analysis is valid for both attributional and consequential perspectives, although we expect it to be more useful for the latter, as consequential LCI are comparatively underdeveloped. The review builds on a book chapter with the focus on life cycle management (Astudillo et al. 2015b), which has been adapted and substantially extended.
3.2 Data quality issues of LCI of electricity supply
This section covers the identified methodological challenges and data gaps faced in LCA of electricity, exclusively looking at the life cycle inventory (LCI) phase. The review is structured according to the data quality requirements proposed in ISO 14044:2006 (2006b), that is: representativeness (geographical, temporal and technology coverage), completeness, consistency, reproducibility, precision, uncertainty, and data sources. Challenges are summarized in Table 3.1 and discussed in the following subsections.
Table 3.1 Methodological challenges in LCI of electricity supply categorized by data quality indicator.
Quality indicator Challenge Geographical
coverage
- ‘Un-traceability” of electricity and congestion challenge the selection of geographical boundaries of electricity markets and mixes.
- Data gaps in non-OECD countries: inventories are inexistent or subject to high uncertainty.