Université du Québec
Institut National de la Recherche Scientifique (INRS) Centre Eau Terre Environnement (ETE)
A Global Scan of How the Issue of Nutrient Loading and Harmful Algal Blooms is Being Addressed
By
Étienne Foulon Ph.D. Alain N. Rousseau P.Eng., Ph.D.
World literature review for the International Joint Commission
INRS-ETE Research Report R-1848
First draft, March, 25th 2019 Final version, May, 6th 2019
© Droits réservés Étienne Foulon et Alain N. Rousseau, 2019 ISBN : 978-2-89146-918-0 (version électronique)
FOREWORD
Alain N. Rousseau P.Eng., Ph.D., directed, reviewed and edited this literature review, while Etienne Foulon Ph.D. gathered and analysed all the relevant information (see Executive Summary), and drafted the first version of this research report. The first author is a professor of Hydrology and Integrated Watershed Management, while the second author is a postdoctoral researcher in Hydrology, both are at Institut national de la recherche scientifique – Centre Eau Terre Environnement (INRS-ETE), Quebec City, QC, Canada.
The scope of the review was outlined by Glen Benoy Ph.D., Senior Water Quality and Ecosystem Adviser, and Pierre-Yves Caux Ph.D., Director Science and Engineering at the International Joint Commission in Ottawa, ON, Canada.
A first draft of this report was reviewed by Dr Rebecca North of the University of Missouri, School of Natural Resources, Limnology Laboratory (Columbia, MO) and Dr Patricia Chambers of Environment and Climate Change Canada, Canada Centre for Inland Waters (Burlington, ON).
EXECUTIVE SUMMARY
The goal of this report is to inform and support recommendations regarding nutrient loading and harmful algal blooms (HABs) in Missisquoi Bay-Lake Champlain and Lake Memphremagog. The content deals with how other jurisdictions beyond the region (Québec, Vermont, and New York) and around the world are addressing this water quality issue. It focuses on the frameworks, approaches, and processes implemented by government agencies and departments, academic institutions, and non-governmental organisations (NGOs) – both within countries and in transboundary contexts. In this document, “frameworks” refers to the overall picture of the program that is being used to address the issue. “Approaches” refers to the mechanisms used to deliver the program, whether they are through research agenda, regulatory and policy advances, implementation initiatives (combination of programs, financial incentives, technological fixes, societal behavioural changes etc.), as well as outreach and engagement activities. “Processes” refers to whether assessment or performance indicators and metrics are in place to track the progress through a positive feedback loop.
The review has been constrained as follows. Case studies in Québec were left out because the research was being carried out by Frédéric Chouinard’s team at the Missisquoi Bay Watershed Agency. Then, given the extent of the Missisquoi Bay-Lake Champlain and Lake Memphremagog, the focus was on case studies of the same magnitude to avoid the immensity of the literature pertaining to smaller lakes and watersheds where simple “technical band aids” (i.e. PhosLock) seemed to be the standard approach. Second, given that regulations in Canada and in the USA are rooted in water quality standards established quite some time ago to curb point sources of pollution, we discarded any material that dealt with the implementation of strategies to resolve these issues - first implementations only. For example, we left aside material for Lake Victoria in Africa or four of the five largest freshwater lakes in China (i.e., Poyang, Dongting, Taihu, and Chao lakes).
Given this scope, the research phase of the review was conducted in three separate stages. First, a global scan of the literature (primary literature, peer-reviewed reports and books, legislative materials, countries and states strategies, government bodies - including watershed-based organisations - online material) along with personal communications with a few experts allowed identifying nearly 15 case studies relevant to the issue at hand (totaling more than 250 analysed references). The case studies represent worldwide jurisdictions that have various dominant nutrient sources and face different issues ranging from HABs, to limited recreational uses, passing by the additional complexity of internal loadings and fish kills, up to drinking water shutdowns. Second, given the overall homogeneity of the case studies identified in terms of general frameworks, we considered four (4) categories of approaches, namely: (i) regulatory; (ii) incentive-based; (iii) risk mitigation; and (iv) outreach, engagement, and educational activities. These allowed us to look at the specific approaches used to manage the problem of nutrient loads and HABs. The following questions were used to guide our review:
• When was the problem noticed? What research was done to determine whether the problem needed to be addressed?
vi • How were these approach (es) decided on? How long have these approach (es) been used? • Have they been successful? How was “success” determined?
The intent was to capture enough cases in order to get a sense of the different types of approaches available. Finally, though phosphorus is the limiting nutrient to algal growth in most freshwater systems, including Lake Champlain and Lake Memphremagog, nitrogen is often the limiting nutrient in marine systems. Nevertheless, it was deemed relevant to examine case studies dealing with coastal HABs and nutrient loadings. Thus, the review considered frameworks, approaches and processes that address one or both nutrients.
The outcome of our analyses is our key findings which were refined through a third step, a separate supplementary review; ensuring enough cases were captured and allowing us to conclude as follows: LESSONS LEARNED
•
National water quality standards are not stringent enough to prevent HABs.•
Overall, frameworks are all based on an integrated watershed management planning framework and national standards.•
There are not any actual success stories related to remediation of HABs, simply management stories.•
Non-point source (NPS) best management practices are questioned throughout the world.•
Market-based strategies to offset pollution or promote targeted BMP adoption are becoming popular and resulting into cost-effective and efficient approaches.•
Cost-benefit analyses may increase the use of technical solutions over comprehensive approaches.•
Every specific element of the approaches identified in this review should be the subject of a distinct exhaustive literature review if the International Joint Commission (IJC) wishes to build upon some of them elements to make recommendations tailored to the Lake Memphremagog and Missisquoi Bay -Lake Champlain areas.o Climate change synergy will definitely increase HABs frequencies
Disclaimer: all references are not provided in this document, but all the material used to compile this literature review is available in a separate folder holding approximately 460 documents.
TABLE OF CONTENTS
Foreword iii
Executive Summary v
Background 9
Nutrients and HABs management strategies 13
Overview of case studies 16
Summary of lessons learned 23
1 Approaches and their specificities 23
2 Engaging with all stakeholders and building trust 24
3 Thinking BMPs through 26
4 Ensuring performance 27
5 Governance and leadership 29
6 Climate change, an Emerging issue? 31
Appendix 1: Lake Léman, monitoring Pannel, Action plan 2011-2020 34
BACKGROUND
Algal blooms are dense layers of cyanobacteria occurring on the surface of lakes and water bodies when there is an overabundance of nutrients (Phosphorus – P, and Nitrogen – N) on which algae depend for growth. It is a naturally occurring phenomenon resulting from the gradual accumulation of nutrients and organic matter from watersheds (Bath, 2017). However, excess nutrients may also originate from human induced activities such as agriculture (mostly from surface and subsurface water movement from fertilised soils and faulty manure storage), industrial and municipal waste water treatment plants, leaky home septic systems, run-off from lawns, and even atmospheric depositions. Hence, humans modified the natural frequency, extent, location, and potential toxicity of algal blooms. Nontoxic blooms hurt the environment and local economies, while toxic algal blooms, referred to as harmful algal blooms (HABs), are of particular relevance to humans because of their toxicity. Bright-green blooms occur in freshwater systems often as a result of cyanobacteria such as Microcystis. Red-tides or brownish blooms occur in brackish waters often as a result of harmful phytoplankton such as dinoflagellates of the genus Alexandrium and Karenia. HABs can produce dangerous toxins that can sicken or kill people and animals, create dead zones in the water (depleted in oxygen), raise treatment costs for drinking water (or provoke shutdowns), and hurt industries depending on clean water (EPA, 2018a).
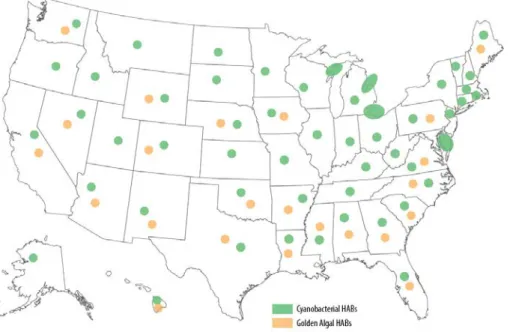
Overall, HABs are a worldwide issue. In the USA, all 50 states are affected. The USEPA estimates that HABs and eutrophication cost the U.S. economy 2.2-4.6 billion dollars a year (Hudnell, 2010). They are responsible for the state of emergency declared in Florida in 2016 and for the half a million Ohioans left without drinking water for a week in 2014. In Canada, cyanobacteria HABs are not uncommon, but tracking them across millions of water bodies is tricky. Reporting programs and phosphorus management strategies are still being designed and released. In Europe, eutrophication, particularly linked to nitrates, is also widespread and even warrants multi-lake surveys of cyanotoxins (e.g., 137 lakes sampled by Mantzouki et al., 2018).
Figure 1: Generalized Distribution of selected freshwater HABs in the U.S. extracted from (CRS, 2018). Dots indicate states that have experienced one or more cyanobacterial (green) or golden (yellow) HABs. Larger ovals mark areas where more widespread HAB problems occurred.
10 Figure 2: Indicator of Coastal Eutrophication Potential (ICEP) calculated from the relative fluxes of N and silica in rivers flowing to the coast. Positive values (yellow, orange, and red colours) indicate likely shortage of silica relative to N in estuaries and coastal marine receiving waters, making diatom production less likely and HABs more likely. Extracted from (Howarth et al., 2011).
In China, an increasing number of HAB events has been recorded in the last two decades in coastal waters (Yu et al., 2018). Since 2000, large-scale HABs appeared, such as dinoflagellates and hapophyte red tides in the East and South China Seas, respectively, and pelagophyte brown tides in the Bohai Sea. These emerging blooms have, since the 1970s, become more diversified and shifted from diatoms to flagellates that tend to be harmful (Yu et al., 2018). Eutrophication of most lakes and reservoirs in China also threatens the regional ecological environment and water security. It has restricted the development of society and economy. In past decades, algal blooms have been observed in Lake Chao (Yang et al., 2010; Jiang et al., 2014), Lake Dianchi and Lake Taihu (Huang et al., 2015; Qin Figure 3: Annual maximum cyanobacterial
bloom area in Lake Taihu in 2009 (top-left), 2010 (top-right), 2011 left), and 2012 (bottom-right), extracted from (Paerl et al., 2016).
et al., 2015). The rapidly accelerating pace of eutrophication in lakes across the country has forced the government to set ambitious lake restoration goals (Qin et al., 2010).
The watersheds of Lake Memphremagog and Lake Champlain span two countries (Canada and the United States of America), one province (Québec), and two states (Vermont and New York). The two lakes suffer from excess nutrient loading and HABs. This review summarises case studies of nutrient loads and HABs management in six countries – Australia, Canada, China, France, Switzerland, and the United States of America – and twelve different jurisdictions worldwide before presenting key lessons learned to inform potential HABs management strategies for Lake Memphremagog and Lake Champlain.
NUTRIENTS AND HABS MANAGEMENT STRATEGIES
The case studies presented in this report illustrate the diversity of approaches and processes used for prevention, control, and abatement of nutrient loads and related HABs, which could be used to inform and support the issue facing Missisquoi Bay in Lake Champlain and Lake Memphremagog.
Approaches used to address nutrient loads and HABs
Overall management strategies applied in the case studies introduced herein generally rely upon the same framework using a set of similar interdependent approaches rather than a single approach to address nutrient and HAB management issues. These approaches fall into four (4) distinct categories: (i) regulatory approaches; (ii) incentive-based approaches; (iii) risk mitigation approaches; and (iv) outreach, engagement, and educational activities. Note that different sets of approaches are being used simultaneously in all case studies.
Regulatory approaches
Regulatory approaches often set the scene for other approaches to be implemented. Regulatory approaches require standards to be met, targets to be respected, potential ensuing sets of sanctions and fines for non-compliance. They require certain actions to be taken (or not taken) by users and do not provide incentives (financial and other) for polluters or others. Examples include bans on specific agricultural practices such as applying fertiliser on snow or frozen soils or when the top two inches of soil are saturated from precipitation. Wetland no-net loss policies are another example generally associated with an offset system or mechanism based on a trading ratio from 2:1 to 3:1 in case of unavoidable impact to a wetland (2-3 areal units of wetland restored to 1 areal unit of wetland lost). Nutrient reduction targets have been included in the regulatory approaches because they imply strategies or a set of agreed upon priorities for all parties involved (including inter-state/province, state/province-country, and/or international memorandum of understanding). Also, in the Unites States of America (U.S.A.), these targets can be defined through a total maximum daily load program (TMDL) resulting from the listing of a water body as impaired under listing 303(d) of the Clean Water Act (CWA). Septic system control and storm water management regulatory approaches entail the design of a specific strategy to address HABs or nutrient mitigation measures within existing programs. This includes the obligation to incorporate low impact technologies during urban developments, imposing more stringent treatment/abatement requirements to sensitive areas, watersheds, or wastewater treatment plants (WTP), or requiring retrofitting when renovations are carried out or properties are sold. Finally, numerical nutrient criteria development are simply the setting of nutrient water quality standards (WQSs for phosphorus and nitrogen) to protect and regulate specific uses of water (drinking, recreational, wildlife), stretches of rivers, or even rivers as a whole. WQSs describe the desired condition of a water body and the means by which that condition will be protected or achieved. To summarise, regulatory approaches, as described in Table 2, include:
o Ban on specific nutrient applications o Numerical nutrient criteria development
o Wastewater management – relative to limiting nutrients exportation and WTP regulations in sensitive areas (or not)
o Setting enforceable reduction targets (including TMDL) o Storm water management
14 Incentive-based approaches
Some of the approaches used to manage nutrient loads and HABs include incentives to promote implementation of beneficial management practices. Land retirement projects compensate landowners for “retiring” sensitive areas relative to their contribution to water quality degradation. Offset programs and more generally water quality trading (WQT) promote trades (mostly Point Source to Non-Point Source) between pollutant source treatments as a way to make a voluntary and surplus pollutant reduction at a lower cost. Note that these programs are often associated with zero export policies. Conservation auctions work as reverse auctions where bidders (often farmers of private land owners) submit bids indicating the incentive they are willing to accept to implement a management practice (Packman and Boxall, 2010). BMP insurance, also called “green insurance” allows farmers to try management practices risk-free (Mitchell and Hennessy, 2003) paying indemnities for actual losses (Baerenklau, 2005) while yield insurance can offer premium rebates if farmers implement specific BMPs. Based on the same principle, governing bodies may offer tax credits as incentives to implement BMPs or conservation strategies, or levy pollution related taxes to incentivise pollution-reducing approaches. Sometimes payments/incentives are proportional to the actual measured performance or to the level of environmental benefits arising from a technical approach. All these incentives are mostly financial whether they use direct payments, loans or subsidies, or indirect financial gain by eventually increasing yields. Stewardship certification programs use indirect approaches. They rely on willingness to improve the environment, on peer pressure (when a program has been implemented by your neighbours, you are more inclined to implement it yourself), and of course on market value increase. The ensuing certificates acknowledge the conservation efforts made to tackle nutrients and/or HABs issues. To summarise, incentive-based approaches, as described in Table 3, include:
o Best management Practices (BMPs) insurance and insurance promoted BMPs o Conservation auctions
o Land retirement projects
o Performance payments or incentives related to conservation or BMPs o Stewardship certification
o Taxes, fees, or surcharges
o Water quality trading (including offset programs) Risk mitigation approaches
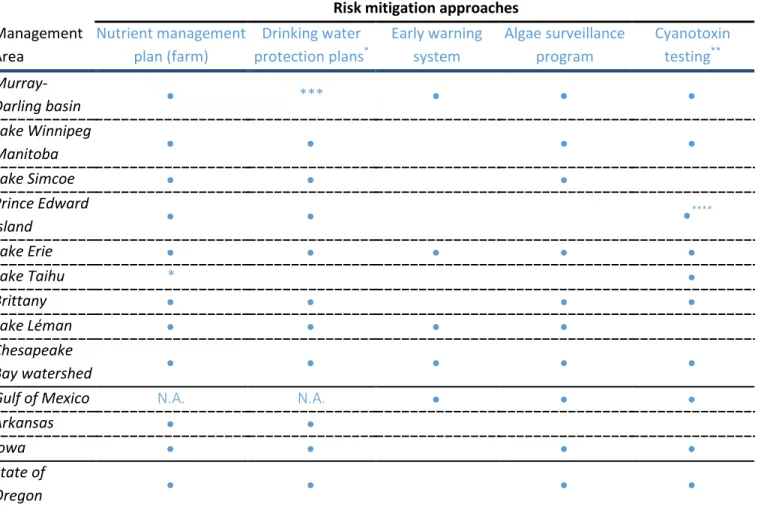
In engineering, risk mitigation can be construed as the process of developing options and actions to enhance opportunities and reduce threats (Mitre, 2008). The environmental definition narrows it down to threats to human health and the environment (U.S. EPA, 2017). This also includes tracking the identified risks. As such, algae surveillance programs allow tracking most sensitive areas. They enable testing for toxins when algal blooms occur and increase the chance for releasing health advisories in time, when needed. Early warning systems (EWS) based on satellite data are the current ultimate risk monitoring tools as they help narrow field testing and designing management strategies (not limited to HABs). However, other EWSs are rather based on a network of monitoring stations and water use restrictions relative to the crossing of water quality thresholds. Environmental pollution liability insurance is a risk mitigation approach as it ensures that a company going bankrupt will not prevent compensation or reparation when possible (Zhou and Bi, 2019). At the same time, it incentivises polluters to invest in risk reduction and prevention measures through lower premiums (Feng et al., 2014a; Feng et al., 2014b). Note that this approach is currently in use only in China. Farm based nutrient management plans ensure farmers have the tools and knowledge required to limit nutrient run-off to rivers and
lakes. This particular approach is closely related to both education and incentive based approaches. Drinking water protection plans increase protection and thus decrease risk, which is assessed as the product of probability of pollution occurrence and of severity of consequences. To summarise, risk mitigation approaches, as described in Table 4, include:
o Algae surveillance program o Drinking water protection plans
o Farm based nutrient management plans o Cyanotoxins testing
o Early warning system
Outreach, engagement, and educational activities
Government bodies, local authorities, as well as watershed-based, non-governmental organisations can help users understand the consequences of their behaviour and identify opportunities to improve nutrient management sustainability through outreach, engagement, and educational activities. These are present at all levels and for topics related to managing nutrients and HABs induced pollution. Approaches include informational reports, guidance documents and websites to inform about the issues at hand. They encompass outreach activities, educational programs, and media mobilisation to help modify users’ behaviours. They require technical seminars and conferences, public hearings, and coordination efforts to foster a sense of responsibility and improve stakeholders’ engagement. Environmental farm plan represents a good example of an educational program targeting farmers. It consists in a voluntary assessment, by the farmer, of a farm operation’s environmental strengths and areas of concern. In Ontario, Canada, it increases using workshops farmers’ environmental awareness in as many as 23 different areas on their farms (OMAFRA, 2016). Often, this program is a funding prerequisite for setting BMPs, going back to the incentive-based approach and illustrating how they are entwined. To summarise, outreach, engagement, and educational approaches include:
o BMP guidance documents (for citizens, farmers, municipalities, water suppliers) o Educational programs (including sensitisation activities)
o Community engagement activities o Technical seminar and conferences o Opinion surveys
16
OVERVIEW OF CASE STUDIES
The following case studies are meant to provide a sense of the different types of approaches available to manage nutrient loads and HABs environmental issues in a variety of hydrological and social settings. The case studies bring together insights from primary literature, peer-reviewed reports and books, legislative materials, countries and states strategies, government bodies - including watershed-based organisations - online material. These documents pertain to the management approaches and actions used in different regions to address water quality issues and their consequences ranging from limited recreational uses to fish kills and drinking water shutdowns. Tables 1 through 4 highlight issues faced across case studies, as well as key regulatory, incentive-based, and risk mitigation approaches used to address these issues. All case studies also employ outreach, engagement, and educational activities to educate and give advice to stakeholders, to influence their behaviour, and to promote programs and disseminate good practices.
It is noteworthy that the content conveyed in Tables 1 through 4 is based on our interpretation of the information available in several, sometimes not as clear as we would have liked, documents pertaining to each case study. Thus, the content describes to the best of our knowledge the characteristics of each case study.
Although Prince Edward Island (PEI), Canada, is not directly concerned with freshwater HABs (only eight recorded occurrences in the last 12 years), it was included in the case studies because water quality is heavily impacted by nutrients: (out of 75 monitoring stations from across Canada examined by Environment Canada (2011), two of the three stations in PEI rivers had the highest levels and increasing trends of total nitrogen and nitrate-nitrite, especially nitrates. Indeed, the province is the kingdom of potato farming where nitrogen is used as a fertiliser and contaminates all sources of water including groundwater (Jiang and Somers, 2009; Paradis et al., 2016) which is the sole drinking water supply of the province.
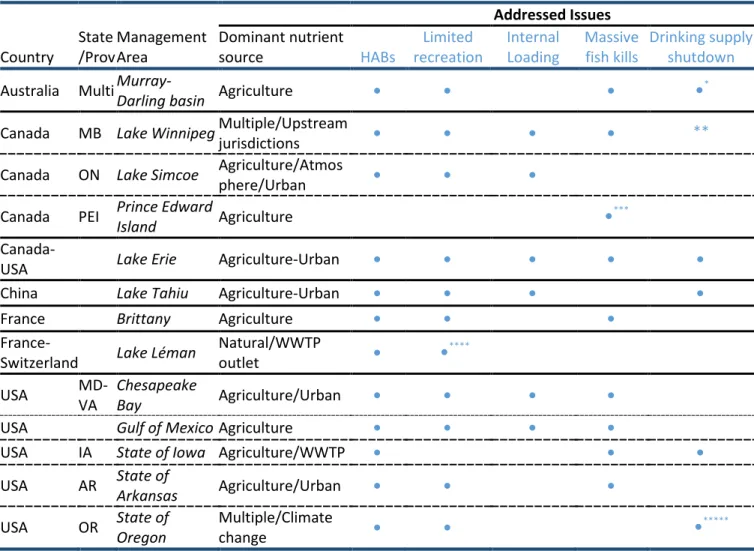
Table 1: Issues related to nutrient loads and HABs addressed across case studies
Addressed Issues
Country State/Prov Management Area Dominant nutrient source HABs recreation Limited Internal Loading Massive fish kills Drinking supply shutdown Australia Multi Murray-Darling basin Agriculture • • • •*
Canada MB Lake Winnipeg Multiple/Upstream jurisdictions • • • • ** Canada ON Lake Simcoe Agriculture/Atmosphere/Urban • • •
Canada PEI Prince Edward Island Agriculture •***
Canada-USA Lake Erie Agriculture-Urban • • • • •
China Lake Tahiu Agriculture-Urban • • • •
France Brittany Agriculture • • •
France-Switzerland Lake Léman Natural/WWTP outlet • •****
USA MD-VA Chesapeake Bay Agriculture/Urban • • • •
USA Gulf of Mexico Agriculture • • • •
USA IA State of Iowa Agriculture/WWTP • • •
USA AR State of Arkansas Agriculture/Urban • • •
USA OR State of Oregon Multiple/Climate change • • •*****
WWTP stands for wastewater treatment plant.
* Note that drinking water supply shutdowns for the Murray-Darling basin are also linked to extreme low flow conditions ** Lake Winnipeg Is not used as a source of drinking water. There may have been drinking water supply shutdowns, but nobody drinks the water.
*** Not a common issue (51 fish kills over 1962-2017), but still addressed because they were mainly (72%) caused by pesticides.
**** Currently very limited impact, but historically prevalent.
***** To our knowledge, no drinking water shutdown happened yet. Still, the problem is addressed at the state level given that all warning signs are red.
18 Some of the selected case studies involve multiple jurisdictions (provinces, states, and countries); the following paragraphs introduce the ones that were used to inform regulatory approaches presented in Table 2.
The Lake Winnipeg Basin is a vast watershed that covers parts of two countries (Canada and the United States of America), four provinces (Alberta, Saskatchewan, Manitoba, Ontario) and four states (North Dakota, South Dakota, Minnesota, Montana). The nutrient pollution problem and solution are both inter-provincial and international in scope and involve multiple jurisdictions, but the Province of Manitoba has the primary responsibility for decisions related to water quality management of Lake Winnipeg as the lake is located entirely in the province. Given the differences and the number of jurisdictions involved, Table 2 presents information for the province of Manitoba (ECCC, 2019).
Lake Erie is the smallest of the Great Lakes and its drainage basin (i.e., of its shore solely) covers parts of two countries (Canada and United States of America), one province (Ontario), and five states (Indiana, Michigan, Ohio, Pennsylvania, New York). Under the 2012 Great Lakes Water Quality Agreement (GLWQA), the governments of Canada and the United States of America agreed “to restore and maintain the chemical, physical and biological integrity of the waters of the Great Lakes basin ecosystem.” In 2011 they released the Lake Erie Binational Nutrient Management Strategy outlining agreed upon nutrient management actions to reduce excessive phosphorus loading and eutrophication. In 2018, to meet binational phosphorus reduction targets adopted in 2016, Canada and the U.S. released action plans for reducing phosphorus loadings. Although these strategies and management plans are not strictly-speaking binding, they were used to fill in Table 2. To the best of our understanding we verified the legal status of each piece of information within the countries regulations. Lake Léman watershed covers 8,000 km² across two countries (25% in France and 85% in Switzerland) and 555 municipalities (CIPEL, 2010). But the lake is fed (among other sources) by the Rhone River which drains an area of 98,000 km² with more than 90% located in France. Phosphorus loadings from the Rhone represent the majority of the total phosphorus entering the lake (95% according to Quetin (2007)). The International Commission for the Protection of the Leman’s waters (CIPEL) released the 2011–2020 binational strategy in 2010 (CIPEL, 2010). Given the history of France and Switzerland not following through on the CIPEL’s recommendations at the same time, we decided not to rely on the strategy to fill in Table 2. Rather each jurisdiction’s legislation was scanned when possible. Indeed, since 1968, the CIPEL has been advocating for regulating the use of phosphates in laundry detergent. This resulted in a ban of phosphates in laundry detergents in 1986 in Switzerland and in 2007 in France.
The Chesapeake Bay is the largest estuary in the U.S. Its watershed encompasses the District of Columbia as well as parts of six (6) states: Delaware, Maryland, New York, Pennsylvania, Virginia, and West Virginia. This area encompasses 13.6 million people and nutrients come from a range of point and nonpoint sources, including WWTPs, industrial facilities, agricultural fields, lawns, and atmospheric deposits (EPA, 2011). On December 29, 2010, the U.S. Environmental Protection Agency established the Chesapeake Bay Total Maximum Daily Load (TMDL) (EPA, 2015b). This TMDL applies to the entire 64,000 squared-mile watershed; however, it is sub-divided into 92 smaller TMDLs across the six (6) states and the District of Columbia. As TMDLs are legally binding, Table 2 is filled in based on information about this type of planning.
The Gulf of Mexico contributing area begins at the Mississippi River delta and extends westward up to the upper Texas coast. Watersheds within this area drain much of the U.S.A. This includes 31 states, from Montana to Pennsylvania and extending southward along the Mississippi River. Most of the nitrogen input comes from major farming states in the Mississippi River valley, including Minnesota, Iowa, Illinois, Wisconsin, Missouri, Tennessee, Arkansas, Mississippi, and Louisiana (Bruckner, 2018). Despite the existence of the Mississippi
River/Gulf of Mexico Watershed Nutrient Task Force (Hypoxia Task Force, HTF), demonstrating the need for cooperative action by grouping together 12 states, five federal agencies and a representative for tribes, U.S. EPA does not plan to take the lead and implement a legally binding TMDL for the whole contributing area. For the moment, it allows states to stay in the lead. Besides, the HTF task force agreed on an interim target of a 20 percent nutrient load reduction by year 2025 as a milestone toward reducing the hypoxic zone to less than 5,000 km² by 2035 (EPA, 2015a). However, this task force does not have legislative power and each state must develop its own strategy and regulations. Given the extent of the Gulf of Mexico/Mississippi River watershed, and given the goal of this review (informing freshwater nutrients loads and HABs management), we decided to fill in Table 2 for the two states only, the upstream state of Iowa and the downstream state of Arkansas.
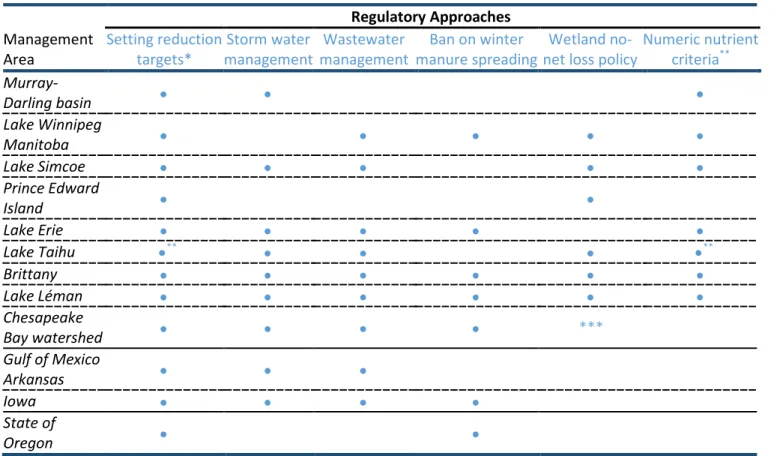
Table 2: Regulatory approaches used across case studies
Regulatory Approaches Management
Area Setting reduction targets* management Storm water management Wastewater manure spreading Ban on winter net loss policy Wetland no- Numeric nutrient criteria**
Murray-Darling basin • • • Lake Winnipeg Manitoba • • • • • Lake Simcoe • • • • • Prince Edward Island • • Lake Erie • • • • • Lake Taihu •** • • • •** Brittany • • • • • • Lake Léman • • • • • • Chesapeake Bay watershed • • • • *** Gulf of Mexico Arkansas • • • Iowa • • • • State of Oregon • •
*This issue is discussed, but we cannot ascertain that reduction targets are required by law.
** Typically what this means is that the jurisdiction has defined N/P numerical criteria for at least one class of water. With that logic, jurisdiction that uses N/P criteria based on a reduction program (including through TMDLs) do not fit in that category. Implementation details for the whole U.S.A. can be found at https://www.epa.gov/nutrient-policy-data/state-progress-toward-developing-numeric-nutrient-water-quality-criteria. One can note that Florida, Minnesota, Missouri, North Carolina, and Oregon are using Chlorophyll-a concentrations as a standard for nutrients. China has a 10 mg/L limit for nitrogen for both drinking water and surface water standards, but no numerical criteria for phosphorus.
20 Table 3: Incentive-based approaches used across case studies
Incentive based approaches Management
Area retirement Land Stewardship Certification Water Quality trading Performance incentives
Insurance promoted
BMPs Conservation auctions Taxes, fees or surcharges Murray-Darling basin • • • • • Lake Winnipeg Manitoba • • * • Lake Simcoe • • • • • Prince Edward Island • • • • Lake Erie • • • • • Lake Tahiu • • • • • • Brittany • • • Lake Léman •** • Chesapeake Bay watershed • • • • • • Gulf of Mexico Arkansas • • • • • Iowa • • • • •*** • • State of Oregon • • • •
*Performance incentives are part of the recommendations made to municipalities applying for the lake friendly certification (https://p2infohouse.org/ref/54/53080.pdf), but we cannot ascertain that these approaches are already available in the Lake Winnipeg watershed.
** Lake Léman does not have a Land retirement project, but uses a very active biological agriculture transformation policy promoting high standard BMPs.
Table 4: Risk mitigation approaches across case studies
Risk mitigation approaches Management Area Nutrient management plan (farm) Drinking water protection plans* Early warning system Algae surveillance program Cyanotoxin testing** Murray-Darling basin • *** • • • Lake Winnipeg Manitoba • • • • Lake Simcoe • • • Prince Edward Island • • •**** Lake Erie • • • • • Lake Taihu * • Brittany • • • • Lake Léman • • • • Chesapeake Bay watershed • • • • •
Gulf of Mexico N.A. N.A. • • •
Arkansas • •
Iowa • • • •
State of
Oregon • • • •
*Many of those plans are prepared on a voluntary basis.
** These refer to the testing of microcystins even if in the USA some states (Minnesota, Ohio, Oregon, and Vermont) have implemented guidelines for Anatoxins, Cylindrospermopsins, and Saxitoxins (details can be found at
https://www.epa.gov/nutrient-policy-data/guidelines-and-recommendations).
***No specific drinking water protection plan identified, however groundwater generic protection exists and surface water is managed in a whole basin plan.
SUMMARY OF LESSONS LEARNED
A review of the case studies reveals several lessons in effective nutrient loads and HABs management that can be grouped into five themes: (i) importance of jurisdictions’ specificities in defining approaches; (ii) engaging with all stakeholders and building trust; (iii) re-thinking BMPs; (iv) monitoring and enforcing to ensure performance; and (v) need for good governance and leadership.
1 APPROACHES AND THEIR SPECIFICITIES
Table 1 through Table 4 clearly illustrate the overall homogeneity of the management strategies applied in the reviewed case studies. However, each element of the regulatory, incentive-based, and risk mitigation approaches are applied in different manners in each jurisdiction and sometimes even within jurisdictions. This observation warrants the following remark; we considered that every specific element of the approaches identified should be the subject of a distinct exhaustive literature review if the International Joint Commission (IJC) wishes to build upon some of these elements to make recommendations tailored to the Lake Memphremagog and Missisquoi Bay-Lake Champlain areas.
As examples and insights into the previous remark, we looked into two elements taken from the categories of approaches presented in Table 2 and Table 3. First, regarding numerical nutrient criteria, the EPA has been recommending their adoption for 14 different ecoregions since January 2000 (EPA, 2019), at least. Today, a greater number of States has adopted numerical criteria for response variables such as chlorophyll-a, rather than for N or P, using scientifically defensible approaches different than that proposed in the EPA’s guidelines. For the bi-national Lake Winnipeg watershed (ECCC, 2018), water quality guidelines are different for the lake (Total N: 0.75 mg/L; Total P: 0.05mg/L) and rivers, it even differs for the different rivers for phosphorus (Saskatchewan: 0.088 mg/L for open-water periods and 0.028 mg/L for ice-covered months; Red: 0.102 mg/L; Winnipeg: 0.012 mg/L) as well as for nitrogen (Saskatchewan: 0.838 mg/L for open-water periods and 0.761 mg/L for ice-covered months; Red: 1.4 mg/L; Winnipeg: 0.44 mg/L). These nitrogen guidelines were modified for these site-specific guidelines from the previous 1 mg/L limit applied at all sites because neither Manitoba nor the Canadian Council of Ministers of the Environment (CCME) have a guideline. The quality status is also computed differently for the lake and rivers. The lake quality is good when seasonally weighted average concentrations are at or below the guidelines; it is poor otherwise. The river quality status is good if less than 10% of samples are above the objective; it is fair if the objective is exceeded 10 to 50% of the time; it is poor otherwise (ECCC, 2018). Battling with numerical criteria, officials at the Iowa Department of Natural Resources have decided not to set numerical standards for the state’s recreational lakes (Payne, 2019). Proposed standards would have needed to be met 75% of the time (Total N: 0.9 mg/L; Total P: 0.035 mg /L). The refusal is based on the fact that too many streams and lakes in the state would not meet numerical criteria, thus, diluting available funds instead of reducing nutrients in prioritised areas as proposed and implemented by the Iowa Nutrient Reduction Strategy (Iowa Department of Agriculture and Land
24 Stewardship et al., 2013). On the other side of the Atlantic, nitrogen quality standards are set at 11.3 mg/L in France and should be met 90% of the time1. Second, all jurisdictions are using stewardship certification programs, but their field of applications and requirements vary. In Ontario, Prince Edward Island, and Lake Erie watershed, nutrient providers can be certified through the 4R Nutrient Stewardship Certification Program to encourage implementing a series of BMPs related to using the Right source of nutrients at the Right rate and Right time in the Right place (4R Certification Program, 2017a, b). At the same time, forest and tree farm certifications are respectively offered in Oregon (Oregon Department of Forestry, 2010) and Arkansas (Arkansas Forestry Association, 2019) while Lake friendly certification is offered to municipalities around Lake Winnipeg (Lake Friendly, undated).
2 ENGAGING WITH ALL STAKEHOLDERS AND BUILDING TRUST
It is widely recognised that the success of environmental management strategy is partially based on mobilising all stakeholders around key issues and building trust around the proposed strategy. This is even truer in the case of integrated watershed management and it is still a recurring theme identified in the case studies.
Because of the historical development of water quality trading in the Lake Simcoe Region Conservation Authority (LSRCA), it was recognised from the beginning that the Lake Simcoe Phosphorus Offset Program (LSPOP) would require widespread consensus and endorsement of project outcomes (XCG consultants, 2014). The program steering Committee was composed of the LSRCA, its partner municipalities, and individuals and groups with whom the LSRCA routinely works on watershed environmental issues. It also included representation from the agricultural sector, the land development and building industry, the Chippewas of Georgina Island First Nation, as well as the watershed municipalities and government ministries. A pilot offset project working group was formed with York Region who agreed to participate as the pilot municipality. In addition to the stakeholder engagement, a public outreach and consultation aspect of the LSPOP was established that included three major components: (i) Stakeholder Soundings - a survey of watershed stakeholders; (ii) four (4) community workshops designed to engage the public-at-large; (iii) the Citizen’s Guide to Phosphorus Offsetting – a guide aimed at the general public describing the concept and details of phosphorus offsetting. The consultation process provided the project team with good insight into public perceptions and helped the program achieve stakeholder acceptance and endorsement (for example, 89% of farmers would recommend that other watersheds undertake a similar program (O’Grady, 2011; O'Grady, 2013)). The public can of course be involved and sensitised beyond the scope of specific projects as Nature Alberta has been demonstrating for more than 15 years with (Nature Alberta, 2013). Indeed, shoreline advisors provide a personalised experience for each individual property outlining BMP suggestions and the results of the consultation, along with additional resources to support property management
1 Arrêté du 25 janvier 2010 relatif aux méthodes et critères d'évaluation de l'état écologique, de l'état chimique et du potentiel écologique des eaux de surface pris en application des articles R. 212-10, R. 212-11 et R. 212-18 du code de l'environnement
decisions to benefit their property and the lake. It is noteworthy Nature Alberta has added a shoreline naturalisation incentive to encourage lake front property owners to naturalise their shorelines (Alberta, 2016).
In addition to community involvement and stakeholder consultations, a few things can be done to build trust. Using data to illustrate environmental conditions and explaining future evolution and mitigation measures can help building trust. Sharing data and enabling public access helps promote transparency and trust. More specific tools can also be mobilised. For example, in Ontario, the South Nation Conservation promoted controlled tile drainage (CTD) using cost benefit analysis (Kitchen and Kitchen, 2017; OSCIA, 2017; South Nation Ontario, 2017). A computerised tool helped producers predict crop yield benefits from CTD versus conventionally drained systems under varying weather conditions for their individual properties. This educational approach could effectively improve CTD application and the tool has even been advertised using video clips and workshops, organised by a trio of Conservation Authorities. Indeed, according to one of the lead researchers on CTD (D.R. Lapen, Agriculture and Agri-Food Canada, May 2019), the farming community is more aware and uptake rate better than ever; suggesting it takes time to change drainage practices.
A third approach of trust building may require more bottom-up approaches. Indeed, the majority of approaches identified in the literature review rely on top-down approaches, meaning they are generally developed and proposed by a higher level (often governmental agencies) and passed down along the hierarchy for final implementation by the users. These approaches have little input from the public or end-users and can be a hindrance for supra-catchment public participation (Rollason et al., 2018). Contrary to top-down approaches, bottom-up approaches are initiated by local, state, and grass-root organisations (farmers associations, industrial groups, NGOs, watershed groups, lake shore residents), and refined to reflect regional, national, and international (when and if they do reach this level) concerns. These kind of approaches are often less costly and enjoy a great deal of success (at least in their implementation), because they are locally developed and more easily trusted. Examples include the Alternative Land Use Services (ALUS) program. This pilot project took place from 2006 to 2009 in Blanshard, Manitoba (Allen, 2015). The program reflects the concept that farmers and ranchers can use their land in an alternative way to produce ecosystem services that benefit Canadians. It first offered payment for wetland services to landowners and, though short-lived, proved effective (Mann et al., 2014). It was so effective in fact that developed ALUS are now offering services across Canada in six (6) provinces (Alberta, Manitoba, Ontario, P.E.I, Québec, and Saskatchewan). It is even the first Canadian province-wide application of payments for ecosystem services (PES) (Kolinjivadi et al., 2019). In the U.S.A, the Clean Water Act enforceable objective2 states “The objective of the Act is to restore and maintain the chemical, physical, and biological integrity of the Nation's waters”. One could say that the development of indices of biological integrity at the local level then state level (MPCA, 218; Hawkins, 2006; MPCA, 2015; Rehn et al., 2015; Kuhn et al., 2018; U.S. EPA, 2019) was, although unplanned, also an application of bottom-up approaches. Mariam (2001) argues that the bottom-up approach has also been used by the USEPA to set standards for drinking water under the authority of the Safe Drinking Water Act
26 (SDWA). These standards specify zero risk from carcinogens in drinking water as a non-enforceable health goal. However, because this goal cannot be achieved at any cost, the standards establish legally enforceable limits set as close as possible to ensure zero risk, taking into account cost and technical feasibility. The goal must also be based on trade-off between what the public would be willing to accept vis-à-vis losses in economic benefits (Mariam, 2001).
3 THINKING BMPS THROUGH
The observation is clear, BMPs’ efficacy is questioned. They have been used to manage nutrient loads for several decades in the U.S.A. (Osgood, 2017) and other developed countries. Yet, there are very few success stories of restoring eutrophic lakes (where watershed size isn’t considered small, i.e. < 10-times lake surface area; in comparison the Lake Champlain watershed is 17 times larger than the Lake - 1269 km2, Lake Memphremagog has the same ratio). Their cost-effectiveness is also questioned, especially when compared to in-lake technical measures to control algae (Welch and Jacoby, 2001; Wagner, 2017) or phosphorus loads (Huser et al., 2016), including internal loading. Certain types of BMPs, such as nutrient management, seem more efficient than others (including buffer strip or cover corps for example) in decreasing nutrient (especially phosphorus) loads (Liu et al., 2016). In cases where BMPs are inadequate as the sole restoration measure, in-lake technical solutions and wetland restoration can be used as supplemental strategies (Liu et al., 2016; Osgood, 2017) or, when source control is not an option, as an alternative (Huser et al., 2016; Wagner, 2017). The following paragraphs offer some insights related to the possible re-thinking of BMPs.
Another area of concern is that BMPs are still not adopted by some farmers. Hence, farmers and landowners adoption behaviour is a widely studied topic whether it is in the U.S.A. in western Lake Erie (Zhang et al., 2016), Ontario (Weber, 2017), Australia (Pannell et al., 2006) or even worldwide (Liu et al., 2018). This topic still requires some research and the role of social media diffusion of information has been highlighted as a potential mean of increasing adoption (Liu et al., 2018). One of the reasons why BMPs are not adopted would be that farmers and landowners are rather risk-adverse. This interesting avenue was explored with BMP insurance. This type of insurance guarantees economic losses endured due to the application of a BMP. A test-strip without BMP serves as the control parcel (USDA, 2003). Often a 5% deductible exists; beyond a loss of more than 5%, losses are refunded to the policy holders (Maulsby, 2001). Apart from high transactions costs imposed by private insurance companies (Harris Palm-Forster and Swinton, 2012), BMP insurance has some potential (Mitchell, 2004; Harris Palm-Forster et al., 2014).
Other types of market-based BMP adoption strategies have been tried out, one of which being conservation procurement auctions. In these auctions, farmers/landowners submit bids for implementing BMPs; the bids are ranked and funded based on cost effectiveness (Smith et al., 2009). Auctions are attractive and increasingly used because competitive bidding is expected to increase cost-effectiveness of nature conservation programs (Dijk et al., 2018; Rolfe et al., 2018). But, in practice, participation rates to conservation procurement auctions are often low, even lower than with broader agri-environmental and PES schemes (Haynes et al., 2007; Defrancesco et al., 2008; Mettepenningen et al., 2011; Taylor and Van Grieken, 2015; Rolfe et al., 2017). Reasons may be numerous as Rolfe et al.
(2018) pointed out that decision to participate in a conservation tender involves three simultaneous decisions about: (i) whether to change a management practice; (ii) whether to be involved in a public or private program with contractual obligations; and (iii) how to set a price or bid. Also, there are a number of factors that affect each stage of the decision process with some, such as landholder attitudes and risk considerations, relevant to all three.
The auctions can bring about a paradigm shift as it could allow targeting high priority areas with cost-efficient measures relative to conservation results (Greenhalgh, 2010; Smith et al., 2012; Harris Palm-Forster, 2015). That is precisely what some suggest, BMPs could be re-thought. Instead of incentivising a procurement of means, payments could be made to incentivise results (Kerr et al., 2016). The innovative institutional design that could go beyond the traditional government programs and do more to reward outcomes and not just actions, introduced by Kerr et al. (2016), are corroborated by the Delta Institute which proposes to shift towards pay for performance programs (Fisher et al., 2016) and by the USDA which proposed similar programs (NRCS, 2017). Besides, this could supplement the trending PES schemes (MAPAQ, 2005) and be coupled with progress payments such as in Finland where specific BMPs are required the years following enrollment in the conservation program to keep increasing payments coming (MAPAQ, 2005).
4 ENSURING PERFORMANCE
As illustrated in the BMP section, ensuring performance is paramount to the success of nutrient and HABs management. It also conditions the public trust and support of those programs. Case studies have shown that ensuring performance can be done one of three ways. First, regulations need to be enforced. Second, monitoring programs (data collection) should be designed carefully and attention should be given to their time span. Third, monitoring should not be limited to data collection and adaptive management should be implemented to ensure long term performances. These three elements are highlighted through insightful examples.
Since experiencing a record bloom in 2011 and since the 2014 drinking water crisis in Toledo, Ohio (Smith et al., 2015a), little has been done to combat algae in Lake Erie or at least data have not shown improvements. Voluntary programs are not working (Bunch, 2018), regulation for NPS pollution is needed (Lucas County, 2015) and enforcement of the Clean Water Act is surely needed (Coleman, 2016). However, until March 2018, Ohio had not declared western Lake Erie impaired (EPA, 2018b) under section 303(d) of the CWA, thus preventing, according to the EPA, the application of a TMDL. Still, since 2018, no TMDL planning has been released and this despite a similar experience around the Chesapeake Bay. Indeed, states struggled for decades to make voluntary, incentive-based approaches work. Their efforts were overwhelmed by the impacts of population growth and agricultural production. In 2010, all six states in the Chesapeake Bay area asked the EPA to establish a TMDL, which contrary to voluntary measures is enforceable, allowing the EPA to impose backstop measure such as requiring additional reductions from point sources and withholding federal grant money if states missed interim milestones. The Chesapeake TMDL has had measurable effects on nitrogen, phosphorus and sediment loads (Scavia, 2017) and the Bay is slowly getting healthier, though the recovery is still “fragile”(Blankenship, 2018).
28 At the same time, Lake Erie faces unintended consequences of conservation practices. The early 2000s were marked with a step-change increase in riverine soluble reactive phosphorus (SRP) loads. These elevated loads were sustained between 2002 and 2014. 65% of the increase was attributed to increased SRP delivery (likely due to changes in tillage practices combined with increased hydrological connectivity between fields and streams) while higher run-off accounted for the other 35% (Jarvie et al., 2017). In the meantime, watershed TP budgets declined, thanks to various BMPs. Among those, land management practices were widely adopted: reduced tillage to minimise erosion and particulate P loss, and increased tile drainage to improve profits. Research shows that these land management practices, designed to reduce erosion and particulate P transport may have conversely contributed to the increased SRP loads (Kleinman et al., 2003; Kleinman and Sharpley, 2003; Smith et al., 2015b; Smith et al., 2015a; Bullerjahn et al., 2016); illustrating both the critical need for long-term monitoring and adaptive management. As far as long-term monitoring is concerned, Denmark and the Netherlands learned the same lesson. Between 1970 and 2007, lake restoration was conducted in more than 90 lakes using bioremediation (SØNdergaard et al., 2007; Søndergaard et al., 2017). These involved fish removal and stocking, but also zebra mussels Dreissena polymorpha stimulation, as an aid to increase transparency by filtering seston particles. Despite improvements in Secchi depths, chlorophyll-a, total phosphorus and nitrogen in the first few years – strongest effects appearing 4-6 years after the start of fish removal - for more than half the lakes, the long-term effects of restoration initiatives indicate a return to turbid state after ten (10) years (SØNdergaard et al., 2007). Note that fish removal for all lakes varied from one (1) year to more than ten (10) years before being stopped. On a more optimistic note, repeated fish removal or supplementation with physio-chemical measures may be an effective option (Jeppesen et al., 2012). Also note that most lakes were shallow eutrophic lakes and do not compare to the Lake Champlain or Lake Memphremagog, but this case illustrates rather clearly the critical importance of direct long-term monitoring of technical management practices.
Apart from physico-chemical data, other elements need monitoring. Effective management is also about tracking the progress made in implementing strategies. This element along with a willingness to apply adaptive management appears clearly in all the consulted case studies. Some are more advanced than others though. In the Lake Léman watershed, plan implementation is well designed, quickly understandable, and can be summarised through visual aids. Indeed, a so-called “Tableau de bord” distinguishes the ecological state of the lake on one side and reviews scheduled actions and their progress on the other. This monitoring panel should definitely be looked at by the interested readers for insights and is available at https://www.cipel.org/le-leman/tableau-bord/. A snapshot has been made available (in French) in an appendix of this report. In the Gulf of Mexico, monitoring has been pushed as far as closely monitoring and analysing operational bulletins produced using a satellite-based HAB early warning system (Davis et al., 2013; Kavanaugh et al., 2013). Operational bulletins are produced twice a week during active bloom events and provide information about the possible presence or confirmed identification of new blooms, in addition to monitoring existing blooms and providing forecasts of spatial bloom extents, movement, and intensifying conditions (National Ocean Service, 2018). The bulletins also report daily coastal respiratory irritation forecasts that are publicly available via the Internet at
http://tidesandcurrents.noaa.gov/hab. Since data on utilisation of the product is extremely important for guiding improvements, efforts are made to evaluate utilisation and usefulness of bulletins. During years
2004-2008, weekly bulletin utilisation was consistently greater than 83% (Kavanaugh et al., 2013). Utilisation was greatest for bulletins labeled as “high priority”, demonstrating that the priority categories successfully indicate the importance of their content to subscribers. Despite less frequent blooms in east Florida, and the least number of bulletin subscribers in the region, during the 2007-2008 bloom a high proportion of bulletins were confirmed as utilised, indicating that bulletins are helpful to subscribers involved in response to both frequent and rare bloom events.
Last, as a special insight, according to Council (2011), between 2008 and 2011, the Chesapeake Bay Program (CBP) was best characterised as a trial and error process of adaptation in which learning was serendipitous, rather than an explicit objective. We would like to point out that this statement is applicable to all presented case studies. Effective adaptive management requires the assessment of uncertainties relevant to decision making and the recognition than even the most well-thought plan should be modified based on what is learned through voluntarily designed management tests.
5 GOVERNANCE AND LEADERSHIP
Without clear governance and strong leadership, the key elements presented above would be moot. Clear governance ensures that each stakeholder, no matter the level, knows exactly their place and role. Leadership ensures actions are taken even in the context of integrated resource management where inertia is massive. Approaches to strengthen governance and leadership go way beyond the topic of this literature review and would probably need considering environmental management strategies as a whole to get useful insights. In this report, however, it is possible to point out one example per each case study, illustrating their importance and highlighting the vital need for voluntarily strengthening them. The following paragraphs detail the case studies for which governance or leadership have not yet been discussed.
The Murray-Darling River basin is managed across four (4) states and a territory, covering one million square kilometers, equivalent to 14% of the country's total area (MDBA, 2010; Bellamy, 2013). In 1992, the Darling River suffered one of the world’s largest toxic algal blooms, over 1000 km of water course. It became the catalyst needed to prompt the state and federal governments to enact the Murray-Darling algal management strategy in 1994 (Murray-Darling Basin Ministerial Council, 1994). The key to this strategy was the development of catchment and regional management plans. It highlighted what can be achieved when federal and state governments agree on an approach of addressing a significant problem which has implications for more than one state. Everyone’s role was clearly defined, from the basin commission to the commonwealth, state, and local governments and ultimately to the individuals. Yet, mega blooms occurred in 2007, 2009, 2010, 2016, and 2018. Following the bloom of 2009, the New South Wales Office of Water developed the River Murray algal bloom management strategy. It clearly stated that the Murray Regional Algal Contingency Plan (RACC) performed its functions well and responded effectively to the bloom, but still made recommendation for more effective future management (Ryan et al., 2009). But now trust is gone. These plans and overall well-managed governance (at least in the beginning) did not prevent the massive fish kills of January 2019 in the lower Darling Basin. These may have been caused or rendered worse due to water basin plans sharing water beyond ecological flows, worsening blooms and hence fish kills.
30 In the Lake Simcoe watershed, transport (erosion and atmospheric deposition of particulate P) of sediments represents a major contributor to eutrophication and is due to a high urbanisation rate. To combat high rates of soil erosion associated with urban development, construction-phase storm water management (CPSWM) guidelines have been adopted to reduce the quantity of eroded soil entering streams and rivers. A literature review (Trenouth et al., 2013) of international guidelines and the science they are based on allowed calling for a revision of Ontario’s guidelines. Meanwhile, total phosphorus entering the Lake from atmospheric deposition has been estimated to account for 25-50% of total inputs (Winter et al., 2007; Ramkellawan et al., 2009; Brown et al., 2011) based on bulk atmospheric deposition data spanning 1990-2007. A new concept of Dust Response Units (DRUs) coupled with the wind erosion prediction system (WEPS) allowed identifying high risk zones for atmospheric deposition (Weiss et al., 2013). Results of this analysis showed that 12 of 66 DRUs (i.e. 18% of all DRUs) contributed 85% of the total P input, allowing the implementation of control practices. Last, some modelling exercises of the Lake allow the assessment of BMP efficiency and, hence, help using scenario analysis to devise theoretically effective management strategies based on the better science available (Jin et al., 2013). These examples show how research can promote adaptation of eutrophication and HABs management initiatives.
The fight against eutrophication in the binational Lake Léman has been lead since 1960 by an inter-governmental agency. The Commission internationale pour la protection des eaux du Léman contre la pollution (CIPEL) was founded by Switzerland and France. It first aimed at coordinating their efforts to tackle the lake’s pollution on a watershed basis including the lake itself, its tributaries, and their own surface and underground contributors (Rapin, 1992). The commission managed research programs and exploited their results (Rapin and Gerdeaux, 2013). It gave advices to both governments on pollution control measures and prepared the first elements needed for international regulations (for example the ban on phosphates in laundry detergent or bi-national contracts such as river contracts). Forty (40) years later, although still en route for complete restoration and although being praised for dynamical management policy commitments, efforts are still needed to lower phosphorus concentrations under 0.015 mg/L to limit the risk of algae proliferation (CIPEL, 2018).
Under the governance of the Chesapeake Monitoring Cooperative, a group of leading organisations is managing the integration of volunteer-based and non-traditional water quality and macroinvertebrate monitoring data into the CBP partnership (Alliance for the Chesapeake Bay, 2018; Chesapeake Monitoring Cooperative, 2018, 2019). The database now includes more than 66,000 water quality records as well as 921 benthic macroinvertebrates measurements over 122 rivers/streams using 334 monitors representing 74 different organisations. This cooperative initiative ensures that data are used to inform watershed management decisions and efforts as well as proposing a comprehensive watershed stewardship program as part of the Alliance for Chesapeake Bay; mobilising a total of 75,000 volunteers over six (6) states (Chesapeake Executive Council, 1996). This type of initiative highlights the benefits of integrating volunteers in monitoring programs. On top of providing outreach and education about lake water quality, it helps building trust (section 2), ensures performance (section 4), and can even provide data of the same quality as those generated by a research laboratory (Obrecht et al., 1998), under the right supervision.
The department of environmental quality (DEQ) of Oregon developed its own strategy demonstrating how leadership and state policy development contributes to the better management of HABs. Between 2000 and 2010, due to the presence of HABs, more than 40 public health advisories were issued in Oregon (EPA, 2016). Hence in 2010, the state started including waters with HAB health advisories in the 303(d) list of impaired waters, requiring, under the Clean Water Act (CWA), that a TMDL program be established. Given the likelihood that the number of water bodies in Oregon experiencing HABs is much larger, the DEQ developed recommendations for its strategy. The overall recommendations (EPA, 2016) focused on both the CWA and the SDWA. They went from modifying current DEQ actions, including optional operation given available staff time, advocating for additional funding and legislative or EPA support (Oregon DEQ, 2011). As a result, for example, additional water quality criteria (Chl-a, DO) have been used as proxies to manage and/or monitor HABs; a variety of HAB related activities are now regulated; source testing data are now used to prioritise field actions (including BMPs); multi-level cooperation has greatly improved (with OHA in particular). All these examples illustrate the ramifications of state policy development relative to the management of HABs.
6 CLIMATE CHANGE, AN EMERGING ISSUE?
Will climate change increase HABs frequency? Upon reviewing some of the literature (Peeters et al., 2007; Wiedner et al., 2007; Paerl and Huisman, 2008; Russell and Connell, 2009; Smith and Schindler, 2009a, b; Tadonléké et al., 2009; Paerl et al., 2011; Winter et al., 2011; O'Neil et al., 2012; Anderson, 2014; North et al., 2014; Taranu et al., 2015; Culbertson et al., 2016; Nürnberg and LaZerte, 2016) on the subject, the answer can be summarised as follows.
Interactive effects of eutrophication and climate change on harmful cyanobacterial blooms are complex but, current knowledge and literature suggest these processes are likely to enhance the magnitude and frequency of HAB events. Changes in agricultural practices and management strategies will thus be key determinants. However, to finish on a positive note, we noticed that climate change was already specifically mentioned or considered in all the reviewed management strategies.
CONCLUSION
Freshwater nutrient loads and HABs management are worldwide issues generally tackled, when watershed size is not considered small (i.e. < 10-times lake surface area), with frameworks based on integrated watershed management planning and national standards. Unfortunately, these standards are not stringent enough to prevent algae blooms. In the approximately 460 consulted documents for this review, no actual success story or mention of a success story was found; there were only management stories of a more or less frequently recurring phenomenon. The review of 12 case studies was carried out analysing the diversity of approaches used under three different themes: (i) key regulatory approaches; (ii) incentive based; and (iii) risk mitigation approaches. All case studies also employ outreach, engagement, and educational activities to educate and give advice to stakeholders, to influence their behaviour, and to promote programs and disseminate good practices. The “Summary of lessons learned” section of the report refines key findings using a separate supplementary review, ensuring enough cases were captured to allow some generalisation. First, the authors noted the need for an exhaustive review with respect to the elements of the approaches identified in order to make recommendations tailored to the Lake Memphremagog and Missisquoi Bay-Lake Champlain areas. Although BMPs have been used for decades throughout the world to manage non-point source pollutions, these are questioned for their apparent lack of measurable outcome and cost-efficiency. This is especially true when cost-benefit analyses are used and may even increase the use of technical solutions over comprehensive approaches. Meanwhile market based strategies to offset pollution or promote targeted BMP adoption are becoming popular. Some even suggest that payments could be made to incentivise results, instead of incentivising a procurement of means. Last, through the doom and gloom that is climate change (CC), the authors noted that although CC synergy will definitely increase HABs frequencies, it was already specifically mentioned or considered in all the reviewed management strategies. This timely report effectively summarises our current state of knowledge of nutrient loading and implications for HABS. It proposes solutions and paths forward to a wicked problem and should prove insightful for policy makers and managers alike.
34