HAL Id: hal-01921420
https://hal.umontpellier.fr/hal-01921420
Submitted on 11 May 2020HAL is a multi-disciplinary open access archive for the deposit and dissemination of sci-entific research documents, whether they are pub-lished or not. The documents may come from teaching and research institutions in France or abroad, or from public or private research centers.
L’archive ouverte pluridisciplinaire HAL, est destinée au dépôt et à la diffusion de documents scientifiques de niveau recherche, publiés ou non, émanant des établissements d’enseignement et de recherche français ou étrangers, des laboratoires publics ou privés.
Brown trout (Salmo trutta L.) high genetic diversity
around the Tyrrhenian Sea as revealed by nuclear and
mitochondrial markers
P. Berrebi, V. Caputo Barucchi, A. Splendiani, S. Muracciole, A. Sabatini, F.
Palmas, Christelle Tougard, M. Arculeo, S. Marić
To cite this version:
P. Berrebi, V. Caputo Barucchi, A. Splendiani, S. Muracciole, A. Sabatini, et al.. Brown trout (Salmo trutta L.) high genetic diversity around the Tyrrhenian Sea as revealed by nuclear and mitochondrial markers. Hydrobiologia, Springer, 2019, 826, pp.209-231. �10.1007/s10750-018-3734-5�. �hal-01921420�
Brown trout (Salmo trutta L.) high genetic diversity
1
around the Tyrrhenian Sea
2
as revealed by nuclear and mitochondrial markers
3
4
P. Berrebi (a), V. Caputo Barucchi (b), A. Splendiani (b), S. Muracciole (c), A. Sabatini (d), F. Palmas (d), 5
C. Tougard (a), M. Arculeo (e), S. Marić (f). 6
7
(a) ISEM, Université de Montpellier, CNRS, IRD, EPHE, Montpellier, France.
8
(b) Dipartimento di Scienze della Vita e dell’Ambiente, Universita Politecnica delle Marche, Ancona,
9
Italy.
10
(c) Office National des Forêts, Pont de l'Orta, 20250 Corte, France.
11
(d) Dipartimento di Scienze della Vita e dell’Ambiente, Università di Cagliari, Via Fiorelli 1, Cagliari,
12
Italy.
13
(e) Dipartimento di STEBICEF, Università di Palermo, via Archirafi 18, Palermo 90123, Italy.
14
(f) University of Belgrade, Faculty of Biology, Institute of Zoology, Studentski Trg 16, 11001, Belgrade,
15 Serbia. 16 17 Abstract 18
The brown trout (Salmo trutta L.) is widely distributed all around Europe but its natural diversity is 19
threatened by massive stocking with Atlantic domestic strains. Describing the remaining natural genetic 20
diversity and the proportion of domestic hatchery strains in rivers is a prerequisite for smart conservation. 21
The high genetic diversity of brown trout populations around the Tyrrhenian Sea is well known. Use of 22
twelve microsatellites has allowed description of the natural genetic structure of populations and detection 23
of the consequences of stocking. Mitochondrial DNA control region sequences and the LDH-C1* gene 24
enabled placement of each population into one of the six mitochondrial and two allozymic known 25
evolutionary lineages. The Corsican populations showed low intra-population genetic diversity but an 26
exceptionally high level of inter-population differentiation. More southern Tyrrhenian regions exhibited 27
opposite pattern of diversity, partly due to the Atlantic domestic introgression. Globally, the natural 28
structure outlines two north-south clines: high inter-population differentiation and predominance of the 29
Adriatic lineage in the north, but lower inter-population differentiation and presence of the natural Atlantic 30
lineage in the south. In addition, the Tyrrhenian region is the contact zone between the widespread 31
Adriatic lineage and a local natural Atlantic lineage probably coming from North Africa through the Strait 32
of Gibraltar. 33
34
Keywords - Microsatellites - mtDNA control region - LDH-C1* - Tyrrhenian brown trout - Conservation 35
36
Running title: Tyrrhenian trout genetic structure 37
38
Corresponding author: Patrick Berrebi, patrick.berrebi@laposte.net, tel. ++ 33 4 6752 4782 39
Present address: Genome - Research & Diagnostic, 8 rue des tilleuls, 34090 Montpellier, France. 40
Introduction 42
43
The brown trout is widespread all around Europe, western Asia and North Africa at medium and high 44
elevation (Behnke, 1972, 1986). It is one of the most extensively managed freshwater fish species 45
worldwide because of its high economical value, mainly for sport fishing. As a consequence, brown trout 46
are regularly stocked in most part of its distribution from multiple hatcheries that breed various strains in 47
many countries. This species has also been introduced and acclimatized in numerous countries around the 48
world where sometimes it is considered as an invader (De Moor & Bruton, 1988; Olsson et al., 2006; Miró 49
& Ventura, 2013). 50
The brown trout is a complex taxon, first investigated through morphology, then with molecular 51
markers. The term of "Salmo trutta complex" (Patarnello et al., 1994; Bernatchez & Osinov, 1995; Giuffra 52
et al., 1996; Bernatchez, 2001) is used to indicate that the complex is composed of numerous 53
differentiated geographic forms (without consensus on the taxonomy) that can easily hybridize with each 54
other (Largiadèr & Scholl, 1996; Meldgaard et al., 2007). Its ecological diversity is also remarkable with 55
sedentary populations, sometimes in the cold upstream of rivers, and anadromous ones that migrate to seas 56
or lakes. Based on phenotypes, many species have been described. Kottelat & Freyhof (2007) reviewed 57
the published nomenclature and reached the number of 28 nominal species. This has been augmented by at 58
least fifteen new species described during the last twelve years (Delling & Doadrio, 2005; Turan et al., 59
2009, 2010, 2011, 2012, 2014a, 2014b; Delling, 2010; Doadrio et al., 2015). 60
Phylogenetic studies based on mitochondrial DNA (mtDNA) provided a first clear and testable way of 61
classification, dividing S. trutta into five main evolutionary lineages, considered as geographic variants 62
but not as species. Thus, Atlantic (AT), Mediterranean (ME), Marble (MA), Adriatic (AD) and Danubian 63
(DA) lineages have been described (Bernatchez et al., 1992) and confirmed in many publications. Other 64
lineages, i.e. monophyletic regional variants at the base of large phylogenetic lineages, such as Duero 65
(DU, Suárez et al., 2001), Tigris (TI, Bardakci et al., 2006), the Balkan cluster (Snoj et al., 2009) and 66
Dades (Snoj et al., 2011) have also been proposed. 67
The Western Mediterranean basin is considered to extend from the Siculo-Tunisian to the Gibraltar 68
Straits. Its eastern part consisted of more or less isolated zones constituting the Tyrrhenian and Ligurian 69
seas. The Adriatic and Ionian seas belong to the Eastern Mediterranean basin and are at the contact with 70
the Western basin. Several publications analyzed the genetic diversity of trout in limited parts of its 71
distribution around the Tyrrhenian Sea using allozymes, RFLP and sequences of a portion of the 72
mitochondrial control region (mtDNA CR) and microsatellites (Nonnis Marzano et al. 2003; Lucentini et 73
al. 2006; Gratton et al. 2014; Fabiani et al. 2018), but the genetic diversity of brown trout in the 74
Tyrrhenian Sea region has not yet been examined in detail. 75
According to the large literature based on morphology and molecular genetics proposing taxonomic 76
organization of the trout populations inhabiting the Tyrrhenian periphery, a rather confusing picture has 77
emerged. Nera River (Roma region) was considered to be an indigenous pool, home of the Mediterranean 78
S. trutta lineage (Lucentini et al., 2006). Corsican rivers were proposed to host S. macrostigma (Roule,
79
1933; Guyomard, 1989; Bernatchez et al., 1992) or S. trutta (Berrebi, 2015), while Sardinian rivers were 80
inhabited by S. macrostigma (Boulenger, 1901; Mola, 1928; Pomini, 1940; Gandolfi et al., 1991; 81
Patarnello et al., 1994; Massidda, 1995; Sabatini et al., 2006; Orrú et al., 2010) or S. trutta (Sabatini et al., 82
2011) or S. cettii (Zaccara et al., 2015). South Sicilian trout are of Atlantic S. trutta lineage (Schöffmann 83
et al., 2007) or S. cettii (Kottelat, 1997; Kottelat & Freyhof, 2007; Schöffmann et al., 2007; Duchi, 2011 & 84
2018; Bianco, 2014; Sabatini et al., 2018). 85
In the present study, the whole area around the Tyrrhenian Sea was sampled in order to describe the 86
overall structure of trout populations. For this, microsatellite genotypes (12 loci), mtDNA CR sequences 87
and LDH-C1* genotypes were analyzed. In addition, the impact of stocking was measured. In light of this 88
new knowledge, the principles of conservation are discussed. 89
90 91 92
Materials and methods 93 94 Sampling distribution 95 96
The present survey concentrates sampling to the freshwater basins distributed all around the Tyrrhenian 97
Sea with some Ionian Sea tributaries (Fig. 1). In order to introduce comparative samples, a river entering 98
the Ligurian Sea at the French-Italian boundary and three commercial Atlantic domestic samples from 99
northern France and central Italy have been included (Table 1). The French hatchery is representative of 100
the international commercial Atlantic strain and the Italian ones of local domestic strains, both derived 101
from genitors from several countries (Bohling et al. 2016). 102
Electrofishing was conducted between 2004 and 2014. A total of 365 river trout (sub-adults and adults) 103
was anaesthetized and a small fin clip taken (preserved in 96% ethanol) before each fish was returned to 104
its river. In the three hatcheries sampled, the method was similar but the fish were caught with dip nets. 105
Some of the samples contained few fish (Table 1): lower Tiber in Lazio region (7 to 9 specimens), 106
Calabria (3 to 7) and Sicily (6 to 11), except for the Anapo River. These samples were very difficult to 107
constitute because of the low trout density. In Sicily and Calabria, the species is protected and special 108
permits are needed with a given maximum number of trout to be caught. Fortunately, most often, this 109
concerned nearby small rivers which could be concatenated for population parameter calculations. 110
111
DNA extraction 112
113
DNA was extracted using the Chelex/proteinase K based method described by Walsh et al. (1991) and 114
Estoup et al. (1996) then improved by Yue & Orban (2005). A small piece of fin was incubated overnight 115
at 56°C in 195 µL of 5% Chelex 100 Resin (Biorad) solution containing 50 mM of Tris-HCL (pH 7) and 116
500 µg/mL of proteinase K. Samples were then incubated at 95°C for 10 min before centrifugation at 3500 117
g for 5 min. Supernatants were recovered and frozen at -20°C until required for use. 118
119
Mitochondrial marker 120
121
The mtDNA CR was amplified by PCR using the PST and FST primers (Cortey & García-Marín, 2002). 122
Each 50 µL reaction included 0.4 µM of each primer (Eurofins MWG Operon), dNTP (2 mM each), 2 mM 123
of MgCl2, 10 µL of 5× PCR buffer, 1 U of Taq polymerase (GoTaq® Promega) and about 50 ng of 124
genomic DNA. The PCR conditions included initial denaturation (95°C, 5 min) followed by 30 strand 125
denaturation (94°C, 1 min), primer annealing (52°C, 1 min) and DNA extension (72°C, 1 min) cycles, 126
followed by a final extension (72°C, 5 min). All PCR amplifications were performed in Eppendorf 127
Mastercycler thermocyclers. The amplified DNA fragments were run on a 0.8% agarose gel to verify the 128
amplification efficiency. The amplified products were purified and sequenced in both directions to 129
confirm the polymorphic sites in an ABIPRISM 3130/xl/ sequencer (Applied Biosystems). 130
The mtDNA CR sequences were aligned using the computer program Clustal X (Thompson et al., 131
1997) implemented in MEGA version 6 (Tamura et al., 2013). In order to assign Tyrrhenian trout to a 132
lineage, data were aligned and compared with reference S. trutta CR sequences from GenBank (AT, DU, 133
ME, MA, AD and DA) (see Table S1 for haplotype details). The genealogical relation of haplotypes was 134
depicted using a 95% statistical parsimony network constructed using TCS 1.3 (Clement et al., 2000). 135
136
LDH-C1* genotypes
137 138
Some of the sampled specimens were genotyped at the LDH-C1* gene coding the LDH enzyme (Table 1). 139
This marker, largely used in the past through allozyme electrophoreses (Hamilton et al., 1989; Almodóvar 140
et al., 2006; Berrebi, 2015) was analyzed by the PCR-RFLP method of McMeel et al. (2001). This popular 141
marker separates the ancestral allele *100 found in Atlantic salmon and southern brown trout lineages and 142
Atlantic domestic strains carrying the derived *90 allele (Hamilton et al., 1989; García-Marín et al., 1999; 143
AD, MA and AT. This last lineage, is represented by the so-called southern Atlantic clade, sensu Cortey et 145
al. (2004) and also exhibits the LDH-C1*100 allele (Aurelle & Berrebi, 2002). Therefore, this marker is 146
used, here, mainly to distinguish between the AT haplotypes belonging to the southern Atlantic clade and 147
the AT haplotypes of northern origin (marked with LDH-C1*90) that invaded the Mediterranean region 148
subsequent to stocking activities. According to Hamilton et al. (1989), all Mediterranean trout populations 149
are characterized by the allele *100, except the marble trout (allele LDH-C1*120). On the contrary, most 150
north Atlantic populations carry the allele *90 with several exceptions (García-Marín et al., 1999). This 151
marker can be used to distinguish natural trout, including natural Atlantic populations in Sicily carrying 152
the *100 allele (Schöffmann et al., 2007) from introduced hatchery Atlantic trout. 153
154
Microsatellite loci 155
156
The primers of the twelve microsatellite markers used in this study were obtained from the literature. 157
Repeated sequences are all dinucleotide except Ssa197 which is a tetranucleotide microsatellite (O’Reilly 158
et al., 1996). Details about each locus and multiplexes are given in Table 2. 159
For each marker, one of the 5' ends of the two primers was end-labelled with a fluorescent dye, either 160
6-FAM, HEX or NED. Polymerase chain reactions (PCR) were performed using the Qiagen multiplex 161
PCR kit in a final volume of 10 µL, containing 3 µL of genomic DNA diluted at 10 ng/µL, 5 µL of Qiagen 162
PCR Master Mix, 1 µL of Qiagen Q-solution, and 1 µL of primer mix at 2 µM each (Eurofins MWG 163
Operon). Amplifications were carried out in a GeneAmp PCR System 2700 thermal cycler (Applied 164
Biosystems), according to the supplier's instructions (Qiagen multiplex PCR kit): initial denaturation step 165
(95°C, 15 min;) followed by 35 cycles of denaturation (94°C, 30 s), annealing (55°C for the three 166
multiplexes, 90 s) and extension (72°C, 60 s); with a final extension step (60°C, 30 min). Amplified PCR 167
fragments were then diluted and separated on an ABIPRISM 3130/xl/ sequencer (Applied Biosystems) 168
with GeneScan 500 Rox dye size standards. Allele sizes were determined using the GeneMapper v4.1 169
software system (Applied Biosystems, Life Technologies). 170
A genotype matrix was then constructed and used as a basis for all the following statistical analyses 171
mainly carried out using GENETIX 4.05 (Belkhir et al., 2004). 172
173
Microsatellites statistics 174
175
For estimation of genetic polymorphism, expected heterozygosity (He), unbiased expected 176
heterozygosity (Hnb: Nei, 1978) and observed heterozygosity (Ho) were calculated for each sample or 177
river system. The mean number of alleles by locus (A) is another way to estimate the diversity in a 178
population. These calculations were limited to samples of ten or more specimens. For this reason, nearby 179
locations characterized by very low fish number were grouped in order to increase the sample size. 180
Inter-sample or inter-river system differentiations (Fst) and the intra-river panmixia (Fis) were 181
estimated (ɵ and f estimators of Weir & Cockerham, 1984, respectively). The significance of the Fst and 182
Fis values was tested by random permutation procedures: 5000 individual permutations between samples 183
for Fst and 5000 allele permutations within samples for Fis, processed using GENETIX. 184
The sequential Bonferroni correction was applied for multiple tests (Rice, 1989). Micro-Checker 185
software (van Oosterhout et al., 2004) was run in order to detect null alleles, drop-out or stuttering 186
perturbations. 187
A general picture of the trout genetic diversity was first obtained through multidimensional analyses. 188
Here Factorial Correspondence Analyses (FCA: Benzécri, 1973), allowing the overall structure of the 189
sampling to be explored, were carried out as implemented in GENETIX. Three focuses were chosen: all 190
the samples, the Sicilian two lineages and the Atlantic diversity of the sampling (Fig. 3a, b and c). The 191
clusters (or clouds) observed in the diagrams correspond to nuclear genetic homogeneous lineages. The 192
mathematical method is clearly detailed in She et al. (1987). 193
In order to detect differentiated subgroups, hierarchical STRUCTURE assignment analyses were 194
performed for the whole sample set (Vähä et al., 2007; Marić et al., 2017). The program STRUCTURE 195
clusters (here, K was run between 1 and 24). Basic assignment criteria are the minimization of Hardy– 197
Weinberg and of linkage disequilibria (Pritchard et al., 2000). Different run lengths were used at each step 198
(from 20,000 to 100,000 burn-in and 100,000 to 500,000 total lengths, repeated seven times for each K) 199
depending on convergence (proportion of identical structure among the seven repeated runs at each step). 200
The admixture ancestry model and correlated allele frequency options were chosen. Sampling location 201
was not used as prior information. 202
The ΔK method (Evanno et al., 2005) was applied to estimate the most probable K at each step (see 203
Table S2). The first step determines the first hierarchical level, the whole sample set being split into K 204
subgroups. Then each subgroup was analyzed separately, allowing for more precise clustering of 205
individuals without eliminating admixed individuals. This hierarchical method was applied until no further 206
substructure was observed. A comparison with the simple assignment test with the best K (here K=19) is 207
provided in Fig. S5 and S6). 208
Finally, the parentage software COLONY 2.0.6.4. (Jones & Wang, 2010) was applied especially on 209
Corsican and Sardinian samples. We have chosen the Pair-Likelihood-Score (PLS)/Full-Likelihood (FL) 210
combined (=FPLS) algorithm in order to establish only full-sibs listing. The objective is to understand the 211
family structure of these very low polymorphic and very differentiated/isolated populations. 212 213 214 Results 215 216 Mitochondrial sequences 217 218
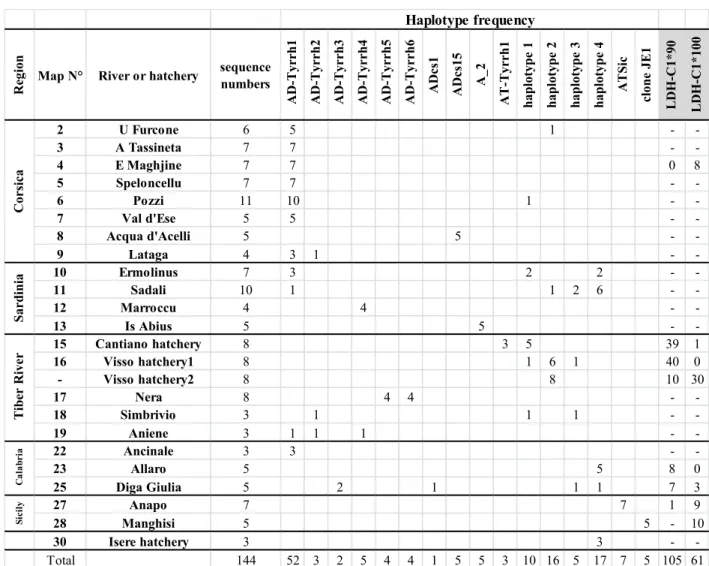
A total of 144 mtDNA CR sequences were obtained in this survey corresponding to sixteen different 219
haplotypes, seven of which are undescribed so far (AD-Tyrrh1 to 6 and AT-Tyrrh1: Tables 3 and S1 for 220
distribution and accession numbers). The alignment length was 987 bp providing 34 parsimony 221
informative sites. Haplotype classification allows the relationships between Tyrrhenian populations and 222
the five main known lineages widespread around Europe plus the DU junior lineage to be understood. The 223
network (Fig. 2) represents the haplotype organization within the Tyrrhenian region, with GenBank 224
published haplotypes used as references. Tyrrhenian haplotypes all belong to AD or AT lineages 225
exclusively. 226
The new haplotype AD-Tyrrh1 is the most common, widespread in all regions except Sicily, and in a 227
central position in the AD haplogroup (Fig. 2). AD-Tyrrh5 and 6 are exclusive to Nera River (i.e. upper 228
Tiber). With nine different haplotypes detected, the AD haplogroup was the main non-domestic mtDNA 229
haplogroup observed in the Tyrrhenian region (56%, Table 3). Note that the sequence of the AD-Tyrrh4 230
haplotype, newly discovered in the present study, contains an 82 bp repeat towards the 3′-end of the CR. 231
As the elongation model of this repeat is generally thought to be the result of intra-molecular processes 232
(Buroker et al., 1990), only the first copy was kept in the analysis. The native AD lineage was present in 233
96% of the Corsican Tyrrhenian trout, 100% of the upper Tiber River (Nera), 67% of the lower Tiber 234
River (Simbrivio and Aniene), 50% of the Sardinian trout, 46% of Calabrian trout and 0% of Sicilian 235
ones, representing a north-south cline partly linked to stocking activities. In the present survey, six AD 236
haplotypes are new, suggesting their endemism (Table S1). 237
Corsica was mainly characterized by the new haplotype AD-Tyrrh1, except for the Acqua d'Acelli 238
population that had only the ADcs15 haplotype. AD-Tyrrh1 accounted for 88% of the Corsican AD 239
haplotypes, 31% of the Sardinian ones, 8% in the Tiber basin in central Italy, 50% of the Calabrian 240
diversity (but with a sample size of 6) and was not present in Sicily. Here again, a cline affected the 241
distribution of this variant, exhibiting a decrease from north to south. The other AD haplotypes were 242
distributed without clear structure in Sardinia, the Tiber River and Calabria (Table 3). 243
Among the AT lineage, the AT-s6 haplotype should represent a natural migration of Atlantic trout into 244
the Mediterranean (Schöffmann et al., 2007). This haplotype of 380 bp is included in the 985 bp haplotype 245
ATSic detected here. This haplotype was the only one present in the Anapo River (Sicily). "Clone JE1", 246
Cassibile. On the contrary, haplotypes 1 to 4 (Table 3) are well known to characterize north Atlantic 248
populations and the domestic commercial Atlantic hatchery strain (Cortey & García-Marín, 2002; Cortey 249
et al., 2004). These haplotypes, synonymous with ATcs1 to 4 (Cortey et al., 2004), are well represented in 250
both Italian and French hatcheries, and in rivers where they had been introduced by stocking. They were 251
observed in Corsica (globally 4%), Sardinia (50%), Calabria (54%) and in the lower Tiber basin (33%). 252
The new and rare haplotype AT-Tyrrh1 was found only in the Cantiano hatchery (sample 15) but not in 253
any river. In Sicily, only the Atlantic haplotype was observed. Their natural/domestic origin is discussed 254 below. 255 256 LDH-C1* genotypes 257 258
Genotyping this gene is especially useful to distinguish between natural and domestic origins of the AT 259
haplotypes of Sicily. Some of the samples were tested, especially those with AT mtDNA haplotypes 260
(Table 1). Hatchery samples were nearly all characterized by the LDH-C1*90 allele except for one 261
*90/100 heterozygote genotype among the 20 Cantiano hatchery trouts (sample 15). This hatchery *90
262
allele was also found in 8/8 in the Allaro River and 7/10 in the Diga Giulia River, both in Calabria, and 263
just 1/10 in the Anapo River in Sicily. The domestic allele LDH-C1*90 was not found in Corsica (but only 264
four fishes analyzed) nor in the Manghisi River in Sicily (five trouts). 265
266
Microsatellite genotypes 267
268
For samples numbering over ten specimens (20 of the 30 considered), the Micro-Checker software 269
made no drop-out detection, two tests among 240 had suspect stuttering and 17 among 240 suggested the 270
occurrence of null alleles. The 17 possible null allele detections were spread among 8 of the 12 loci, with 271
0 to 3 cases each, showing that there was no systematic presence of null alleles in a given marker, 272
probably not disturbing the calculations. 273
The first representation of overall microsatellite genetic diversity is given by multidimensional 274
analyses. Fig. 3a first isolates Corsican populations at the negative part of the first axis, with very low 275
intra-population and very high inter-population diversity, together with absence of Atlantic influence. The 276
southern samples of Sardinian trout (numbers 12 to 14) clustered in one group. Note that because this is a 277
2D representation of a 3D simplification of the 273D hyperspace (274 x 324 matrix), Sardinian 278
autochthonous trout (green envelope) are clearly separated from E Maghjine Corsican trout (red circles) 279
along axis 3 despite the apparent overlapping in the diagram (see Fig. S4). The same is true between 280
Lataga (grey circles) and Acqua d'Acelli (dark green circles) fishes (Fig. S4). 281
In contrast, several trout populations seemed to be introgressed or hybridized with the commercial 282
international Atlantic strain represented here by the Italian and French hatcheries (Cantiano, Visso and 283
Isère hatcheries, samples 15, 16 and 30). They are positioned at the very end of the positive part of axis 284
one. In order to understand this part of the diagram, Atlantic-like samples were reanalyzed alone. The 285
second analysis (Fig. 3b) showed clear separation of the Anapo population (Sicily, sample 27) from the 286
remaining populations. Finally, the third analysis (Fig. 3c) that considered the Atlantic-like samples 287
without the Anapo one, gathered at the left the domestic Atlantic strains and the Ermolinus and Sadali 288
samples of central-eastern Sardinia (numbers 10 and 11 in Table 1) and those from Allaro and Precariti in 289
Calabria (23 and 26), probably of domestic origin. The remaining samples collected around two clusters: 290
first, numbers 18, 19, 28 and 29 (respectively from the Tiber River in Lazio province and the southern 291
samples in Sicily), and second, numbers 20 to 25 corresponding to most samples from Calabria (except for 292
23, the Allaro River, probably of full domestic origin). 293
Summarizing, the multidimensional analyses highlighted several types of populations: 294
- insular/endemic differentiated populations: all Corsican (samples 2 to 9) and southern Sardinian 295
samples (12 to 14); the Nera population in continental Italy (17) (Fig. 3a); 296
- the Anapo River population (27) clearly isolated from the remaining Atlantic populations (Fig. 3b); 297
- southern populations, close to the domestic cluster: downstream Tiber River samples (numbers 18 298
and 19); two Sicilian samples (28 and 29); most Calabrian samples (numbers 20 to 24, except for sample 299
23 from the Allaro River that clustered with domestic trout); 300
- domestic Atlantic samples: Italian and French hatchery strains (numbers 15, 16 and 30); central-301
eastern Sardinian samples (10 and 11); the Simbrivio River, a Tiber River tributary (18); the Allaro River 302
in Calabria (23) (Fig. 3c). 303
The hierarchical STRUCTURE analysis gave very similar results (Fig. 4, Table S2). In the first 304
hierarchical step, trouts were separated into two groups. Group A mostly consisted of natural samples 305
from Corsica and Sardinia, while group B was mainly composed of samples containing the AT lineage. In 306
group B (subgroup B2) some are domestic hatchery samples of AT lineage (Cantiano, Visso and Isere). 307
Others are an assemblage of domestic AT individuals in different proportions with native ME (Roya) and 308
AD lineage (U Furcone, Ermolinus, Sadali, lower Calabria and lower Tiber), which is evident from the 309
second to the fifth step, depending on the sample (subgroups B2 and B3). Finally, several are native 310
samples of AT (Anapo and south Sicily) and AD (Ancinale and Nera) lineages (subgroup B1). However, 311
in southern Sicilian rivers, there is a small proportion of domestic AT genotypes visible in the second step 312
of the hierarchical assignment. This heterogeneity (especially in group B) explains that the hierarchical 313
analysis reached up to 22 clusters. Some clusters showed substructures (lower Tiber, lower Calabria, Isere 314
hatchery, Cantiano hatchery, Ermolinus, U Furcone and Marroccu) which are marks of migrations or 315
introductions. The Nera sample is probably not sub-structured since the program cuts each individual into 316
two lineages but do not partition them. 317
Unlike the hierarchical Structure analysis and ΔK method (Evanno et al., 2005) which estimated 22 318
groups, method based on maximizing the mean estimated ln probability of data (ln P(D); Pritchard et al., 319
2000) show that the most probable K = 19 (Fig. S5 & S6). This last analysis method is less informative 320
than hierarchical Structure, and, unlike hierarchical method, some of populations are not detected as 321
distinct (Pozzi, Val d’Esse and Marroccu), which is very important for delimitation of MU. 322
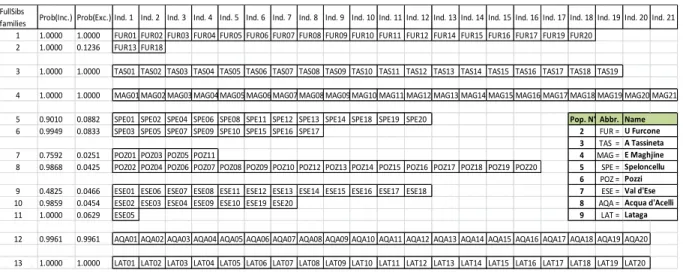
Parentage analyses performed with COLONY software detected one to three families in each 323
autochthonous Corsican or Sardinian population. However, in north-east Sardinian populations, the 324
Ermolinus and Sadali populations are composed of 7 to 9 families of generally 1 or 2 individuals (except 325
two families of 3 and 5
trouts, see Table S3). 326
327
Comparing different marker systems 328
329
Comparing data provided by the three categories of markers allowed the general genetic structure of trout 330
around the Tyrrhenian Sea to be described. The LDH-C1* marker is monomorphic for the considered 331
natural populations and was used as a diagnostic marker between natural and domestic trout. 332
The Roya trout population belongs to the ME lineage, according to mtDNA CR sequences 333
(unpublished data) constituting the ME lineage reference for microsatellite diversity and assignment 334
(Table 4, Fig. 4). In the sequence data constituting the present study, this ME lineage was not observed all 335
around the Tyrrhenian Sea. 336
Corsican and Sardinian natural populations were mostly characterized by the AD-Tyrrh1 haplotype 337
(with a few AD-Tyrrh2 and AD-Tyrrh4). Among this mitochondrial homogeneity, there were two 338
exceptions: the Corsican population of Acqua d'Acelli had only the ADsc15 haplotype and the Sardinian 339
population Is Abius was characterized by the A_2 Adriatic haplotype. The microsatellite markers divided 340
Corsican and Sardinian natural populations into nine clusters in Fig. 3a and at the third step of the 341
hierarchical assignment analysis (Fig. 4). 342
Along the Tyrrhenian-Ionian Italian Peninsula the upper Tiber River trout (Nera River, sample 17) 343
appear as a separate cluster in the third step of the hierarchical analysis, which is congruent with the 344
mtDNA haplotype composition. Here, two private haplotypes were observed (AD-Tyrr5 and 6) that 345
probably have a trans-Apennine origin due to their genetic similarity with haplotype ADcs11 (see Fig. 2), 346
this latter being very common in the Adriatic region (Sušnik et al., 2007; Berrebi et al., 2013). 347
On the contrary, the lower Tiber River trout (samples 18 and 19) showed wide and distinct haplotype 348
diversity of more western origin (AD-Tyrrh1, 2 and 4). 349
Further south, the Calabrian samples were separated into two lineages at the second step of the 350
hierarchical analysis (B1 and B2): the Ancinale River system (samples 20 to 22) and lower Calabria 351
(samples 23 to 26). The Ancinale cluster was characterized by the common haplotype AD-Tyrrh1 and the 352
lower Calabrian by two private haplotypes: AD-Tyrrh3 and ADcs1. 353
Sicilian trout populations exhibited two AT haplotypes (ATSic and "clone JE1"). The clone JE1 354
haplotype, fixed in the Manghisi River population, can be considered to be of native origin on the basis of 355
the associated fixation of the LDH-C1*(100) allele (Table 3). Microsatellite Sicilian clusters separated 356
lately (at the third step) the Manghisi and San Marco populations (south Sicily - samples 28 and 29) from 357
the Anapo population (27) in correlation with the two haplotypes (Table 3). With only one exception, all 358
analyzed Sicilian trouts showed the LDH-C1*100 wild genotype. 359
All around the Tyrrhenian Sea, AT haplotypes AT-Tyrrh1 and "haplotypes 1 to 4" marked the 360
domestic lineage assigned to the B2 cluster (Fig. 4) based on microsatellites and recognizable with the 361
LDH-C1*90 allele, while clusters B1 and B3 dominantly represented composite natural lineages.
362 363
Population parameters 364
365
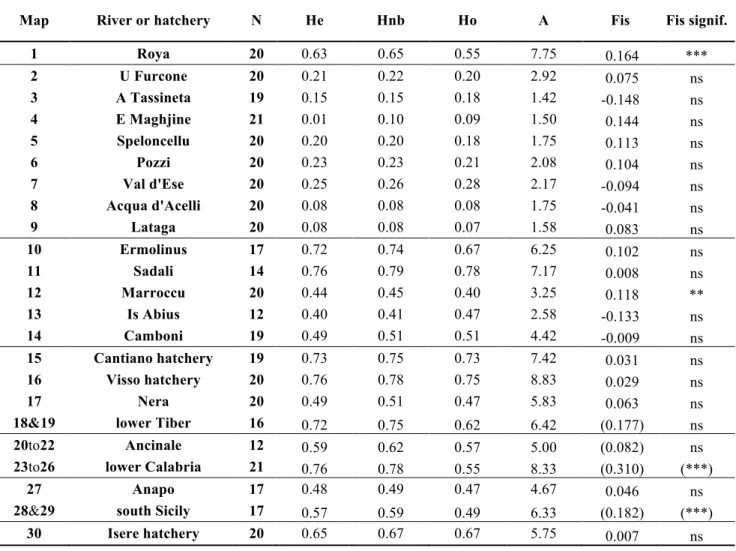
Population parameters add some biological information. Heterozygosity, as measured with various H 366
parameters and with the mean number of alleles A (Table 4), was very low in Corsica (Hnb=0.17), but 367
very high in Sardinia (0.58). Parameter A, the mean number of alleles by locus, was also very distinctive 368
(respectively 1.9 and 4.7). Hatchery populations are considered to be highly polymorphic (Berrebi et al., 369
2000; Bohling et al., 2016) and displayed large values: 0.67<Hnb<0.78 and 5.7<A<8.3. 370
Inter-sample differentiation can be determined using the estimations of Fst (Table 5). Most sample 371
pairs was highly significantly differentiated except for a few cases which became moderately significant 372
after Bonferroni correction. Considering only feral trout, in Corsica the mean inter-sample Fst was 0.74, 373
which is a very high value among neighboring rivers (0.47>Fst>0.90). The mean Fst was lower in Sicily 374
(0.34) and among the Tiber tributaries (0.29). In Sardinia, the Ermolinus and Sadali trout populations were 375
deeply introgressed by domestic forms. Only Marroccu, Is Abius and Camboni populations are native, 376
with very low differentiation (0.03<Fst<0.08). In Calabria, the small sample sizes limited the estimations 377
between groupings to an opposition between the Ancinale and Alaro/Assi/Stilaro/Precariti basins (Fst was 378 0.17). 379 380 Discussion 381 382
Combining nuclear and mitochondrial markers provided a rather clear structure of the Tyrrhenian (and 383
Ionian) trout populations. Very high inter-population diversity was observed in Corsica. A double north-384
south cline was detected: (i) high inter-population differentiation in the north (mainly Corsica) and lower 385
in the south (ii) predominance of the Adriatic lineage in the north, which decreased towards the south due 386
to stocking in Sardinia, the Tiber basin and Calabria and because of the natural Atlantic lineage settlement 387
in Sicily. 388
389
Origin of Tyrrhenian trout diversity 390
391
Corsican trout can be considered as the best conserved natural stock around the Tyrrhenian Sea, since 392
all samples (except number 2) were in the A cluster, which characterizes mostly AD individuals (Fig. 4). 393
As a possible explanation, the riverine ecosystems have been relatively well preserved in the island and 394
the upstream part of the watersheds is generally free of pollution. Hydrogeological characteristics are also 395
favorable to salmonids. According to Gauthier & Berrebi (2007), the ancestral lineage (AD) has been 396
isolated upstream by impassable waterfalls since the last glacial maximum. Below these waterfalls, 397
postglacial Mediterranean invader trout (ME, not sampled here) hybridized with resident AD populations. 398
The numerous upstream isolated ancestral populations are free of ME invader or of domestic introduction 399
(Fig. 4), confirming the Berrebi (2015) survey of 38 samples, some of which were re-sampled for this 400
study (stations 2, 6 and 7). Traces of stocking (AT) are rare there (imperceptible with nuclear markers and 401
4% according to the mitochondrial sequences). This favorable situation explains the preserved high 402
differentiation between populations (0.47>Fst>0.90; mean value 0.74, the highest value among all the 403
samples). Moreover, the small size of streams together with possible bottlenecks could explain the very 404
low intra-population diversity (0.08<Hnb<0.26, the lowest values among all the samples) compared to 405
native grouped Tiber populations (0.51<Hnb<0.75), native Sardinian trout (0.45<Hnb<0.51), and even the 406
grouped Calabrian (0.62<Hnb<0.78) and Sicilian populations (0.49<Hnb<0.59). Table 3 shows that these 407
populations exhibit only one haplotype each (except for sample 9 from the Lataga River), mostly the 408
newly described AD-Tyrrh1. 409
In order to better describe these island isolated small populations, COLONY software (Jones & Wang 410
2010) was used to research family structure in Corsican populations (not shown). In Corsica, each 411
population shows only one to three families (Table S3). In fact, the polymorphism is so low 412
(0.08<Hnb<0.26) that we can deduce that these small populations, totally isolated, have suffered several 413
drastic recent bottlenecks. We can also suppose that one or two pairs of parents have recently re-funded 414
each population making naturally each sample 1 to 3 families. The other interpretation is that such low 415
polymorphism does not allow families detection. In Sardinia, the landscape is totally different: (i) in north-416
east populations (Flumendosa basin), mostly composed of Atlantic domestic lineage, the Ermolinus and 417
Sadali populations are composed of 7 to 9 families of generally 1 or 2 individuals. These highly 418
polymorphic populations (here 0.74<Hnb<0.79) are composed of various origins. (ii) In the south, the 419
same local lineage has been observed in three samples of the same watershed (Cixerri basin) with possible 420
exchanges. The medium level of polymorphism (0.41<Hnb<0.51) corresponds to rather large populations 421
and possibly exchanges between them. The whole Cixerri sampling forms 12 families of full-sibs 422
frequently composed of individuals of the three sampled locations (Table S3). 423
If we compare these values with populations analyzed in the literature with similar markers (9 to 11 424
microsatellite loci), the first difficulty is the diversity of cases mainly in terms of population size. 425
However, with the filter of case similarity, we observed very high diversity in northern populations 426
(generally of AT mtDNA lineage) as in Switzerland (Stelkens et al, 2012: 0.73<He<0.81) or in Romania 427
(Popa et al. 2016: 0.79<He<0.82), but lower values in Catalonia/Spain, as around the Tyrrhenian Sea 428
(Araguas et al., 2017: 0.36<He<0.66). 429
The Sardinian populations seem to be far more degraded than the Corsican ones. Currently trout 430
populations can be found in a few basins in Sardinia, where they are confined to areas of medium 431
elevation. In this island, known pure natural populations are limited to one southern basin located within 432
the Regional Natural Reserve (Foresta di Monte Arcosu): the Cixerri basins (Sabatini et al., 2006; 2011; 433
Zaccara et al., 2015; Sabatini et al., 2018). Cixerri basin samples (numbers 12 to 14) were grouped at the 434
second step of hierarchical assignment (Fig. 4). Flumendosa basin (samples 10 and 11), located east-435
central of the island, is inhabited by hybrid trout with domestic dominance, assigned to the B2 cluster 436
gathering the domestic Atlantic lineage (Fig. 4), with a majority (76%) of hatchery haplotypes (Table 3). 437
Tiber River trout are probably influenced by the numerous upstream hatcheries settled in the Marche 438
(samples 15 and 16) and Umbria regions. However, this influence seems limited in the wild according to 439
the mitochondrial marker (no AT haplotype upstream in the Nera River and 33% downstream). Nuclear 440
markers clearly isolate a first natural group, the upstream Nera River sample alone, visible outside the 441
central part of the multidimensional diagram (Fig. 3a) in the B1 lineage (Fig. 4) and with haplotypes AD-442
Tyrrh5 and 6, not observed elsewhere (Table 3). According to microsatellites (Fig. 3c and the B2 cluster 443
in Fig 4.), another lower Tiber group is genetically closer to the domestic samples (haplotypes AD-Tyrrh 444
1, 2 and 4, all three not endemic to the Tiber River). 445
Calabria is a dry area cut at the south by small parallel coastal rivers flowing into the Ionian Sea. 446
Domestic Atlantic strains were introduced into this region, and totally replaced the Allaro population 447
(Table 3, Fig. 3c and B2 cluster in Fig. 4). The Diga Giulia population is hybridized and shows 70% of 448
domestic LDH alleles (*90) and 30% of Atlantic haplotypes (Table 3). Natural Calabrian trout are limited 449
to Ancinale and partly in the Diga Giulia Rivers with haplotypes AD-Tyrrh1 and 3, and ADcs1. 450
According to Schöffmann et al. (2007) and the present study, Sicily is inhabited by trout 451
belonging only to the AT mitochondrial lineage. Schöffmann et al. (2007) described haplotype AT-s6 in a 452
sample of 26 specimens from three rivers including the River Anapo. The AT-s6 haplotype is a short 453
synonym (380 bp reported by Bernatchez, 2001) of three published longer sequences: the ATSic 454
haplotype (endemic to Sicily, Snoj et al., 2011), and the ATM1 and ATM6 haplotypes, known in Morocco 455
(Snoj et al., 2011). These natural AT haplotypes are phylogenetically far from "haplotypes 1 to 4" marking 456
domestic AT trout (Snoj et al., 2011). Using one enzymatic marker, Schöffmann et al. (2007) indicated 457
that the LDH-C1*100/100 genotype is dominant in Sicily (24/26). This last genotype is absent from north 458
Atlantic domestic strains (Berrebi et al., 2000; Cortey et al., 2004). It was thus deduced that the Sicilian 459
lineage should be a natural immigration of the south Atlantic lineage, characterized by the LDH-C1*100 460
allele. Schöffmann et al. (2007) also indicated that the AT-s6 haplotype sequence is close to those found 461
in Atlantic basins in the Iberian Peninsula (Weiss et al., 2000; Suárez et al., 2001) and southern France 462
(Aurelle & Berrebi, 2001). The other haplotype found in Sicily in the Manghisi River (tributary of the 463
River Cassibile), "clone JE1", was first described in the Jerte River (tributary of the River Tajo) in Spain 464
(Suárez et al., 2001). This haplotype is phylogenetically close to the ATSic natural haplotype but also to 465
several domestic haplotypes like "haplotype 3" (Fig. 2). Therefore, the presence of the sole allele LDH-466
C1*100 in a sub-sample from the Manghisi River (Table 3) demonstrates the natural origin of the
467
haplotype clone JE1. Taking these new results into account confirm the delimitations of two Atlantic 468
sublineages: the natural one mainly in Sicily and the domestic ones mainly in hatchery samples but 469
dispatched over the whole zone. This is justified by (i) the two exclusive groups of haplotypes, haplotypes 470
1 to 4 vs ATsic and clone JE1 for domestic and natural AT and (ii) by Fig. 4, where the Atlantic lineage is 471
in black at step 1 and in green and black (B1 and B2) at step 2 for natural and domestic Atlantic 472
sublineages. 473
Recently, Splendiani et al. (2016) detected the ATsc33 haplotype in sub-fossil remains of brown 474
trout from a Tyrrhenian locality of northern Calabria dating about 13,000-8,000 years BP. This haplotype 475
is considered to belong to the southern Atlantic haplogroup together with ATSic and clone JE1 476
haplotypes, and was already detected in Sicily (Fruciano et al., 2014), Spain (Suárez et al., 2001; Cortey et 477
al., 2009) and Morocco (Snoj et al., 2011). This observation is coherent with the recent expansion of this 478
haplogroup related to the last glacial maximum as proposed by Snoj et al. (2011). 479
In the samples from Calabria analyzed in the present study, no native Atlantic haplotypes were 480
found. However, due to the very low size of the Calabrian samples analyzed here (13 sequenced 481
specimens), we cannot make any assumptions about a possible natural presence of the Atlantic lineage in 482
current brown trout populations of the southern Italian peninsula. 483
484
Conservation purposes 485
486
The brown trout is generally accepted as a diversified and complex assemblage of salmonids of the 487
genus Salmo. It has been investigated for a long time by several methods, but without a clear description 488
of its taxonomy. According to Sanz (2018), who reviewed the entire S. trutta complex data, the origin of 489
this difficulty is due to the multiple episodes of colonization and secondary contacts. This high 490
phylogenetic complexity with large genetic differences within lineages is accompanied by morphological 491
and life-history diversity that has led to the description of dozens of nominal species (Kottelat & Freyhof, 492
2007). 493
The increase in the number of new trout species, sometimes elevating known subspecies to the species 494
rank (Isaac et al., 2004; Zachos et al., 2013), sometimes accepting ancient morphological species as true 495
species (Ninua et al., 2018), is a strategy to be considered as a threatened taxon in the IUCN Red List 496
criteria. This should be a help for conservation (Garnet & Christidis, 2007) but such a strategy can lead to 497
mismatches with described molecular lineages (Phillimore & Owens, 2006). Considering the complex 498
evolutionary history of the brown trout, Sanz (2018) recommended defining conservation units based on 499
genetic assessments at the population level. 500
Thirty years ago, molecular investigations proposed a first global description of the S. trutta complex. 501
The most popular description of genetic structure is based on the mtDNA CR sequences, showing five 502
main clusters closely linked to geographic distribution (Bernatchez et al., 1992; Bernatchez, 2001). This 503
organization has been confirmed with rDNA ITS markers (Presa et al., 2002). 504
Numerous publications used the CR marker, increasing the number of sequences or the sequence 505
length (Weiss et al., 2000; Cortey & García-Marín, 2002) until sequencing the 1250 bp that cover the 506
whole CR in Giuffra et al. (1994) or 1013 bp in Cortey et al. (2004). This marker is perhaps not the best 507
for phylogenetic reconstruction, but it is the most used and so the most practical for general phylogenies 508
with numerous GenBank sequences involved. 509
Beside the S. trutta complex, few taxa have been demonstrated as being outside the species complex 510
according to mtDNA phylogenies. S. ohridanus and S. obtusirostris are rare Salmo taxa considered as 511
distinct species (Snoj et al., 2002; Sušnik et al., 2006; Snoj et al., 2009) as is S. salar. At the same time, 512
other morphological species have been returned to the S. trutta complex (S. platycephalus: Sušnik et al., 513
2004; S. dentex: Snoj et al., 2010). 514
Most molecular publications apply an exclusivity criterion which is the reciprocal monophyly, the 515
basis of the phylogenetic species concept (Hebert et al., 2003; Sites & Marshall, 2004), so that taxonomy 516
is as close as possible to the phylogeny. However, discrepancies between morphology and genetics 517
(especially for recent species) should be explained by the expected discrepancy between gene history 518
(Avise 2000) and/or gene phylogeny and species phylogeny (Knowles & Carstens, 2007). 519
According to Moritz (1994) and to the arguments given here, conservation units should be management 520
units (MUs), i.e. conservation units based on molecular assessments at the population level, without 521
phylogenetic prerequisites, considering population assemblages forming units that deserve distinct 522
management for conservation. 523
In the Tyrrhenian region, several attempts at nomenclature have been made. The proposition of 524
Kottelat & Freyhof (2007) to retain the name S. cettii for the whole Tyrrhenian region ignores the local 525
high diversity of trout populations and numerous genetic sub-groups observed with two molecular markers 526
(Fig. 2, 3 and 4). Trout in the Tyrrhenian Sea region were rarely investigated with molecular methods and 527
never as a whole in order to distinguish the different taxa and conservation units, although these data are 528
necessary for intelligent management and prioritization of stock preservation. The present survey 529
demonstrated that several categories of molecular markers are necessary for this. Crossing the well visible 530
clusters in Fig. 2, 3a and 3b and the distinct lineages obtained by assignment (Fig. 4), the following 531
significantly differentiated MUs, can be proposed: 532
The eight Corsican samples (U Furcone, A Tassineta, Aqua d'Acelli, E Maghjine, Speloncellu, Pozzi, 533
Val d'Ese and Lataga Rivers) and the three Sardinian samples of the Cixerri basin divided into two MUs 534
(Marroccu and Is Abius-Camboni) constitute ten MUs, genetically clearly different, mostly grouped in 535
cluster A of Fig. 4. They constitute the island part of the Tyrrhenian trout diversity. The detection of these 536
MUs allows much more isolated and differentiated populations to be described in Corsica. These island 537
MUs are almost not subject to domestic admixture. 538
Secondly, continental Italy revealed only two MUs positioned in cluster B1 of Fig. 4, i.e. dominated by 539
natural trout: i) the Nera River (sample 17, central Italy) and ii) the Ancinale River (sample 22, Calabria), 540
which seems to be the only local population dominated by a natural lineage. 541
Third, the Sicilian trouts, confirmed in their natural AT lineage, are nevertheless separated into two 542
MUs: i) the well-known Anapo River (Schöffmann et al., 2007) characterized by haplotype ATSic and ii) 543
the pure wild populations of Manghisi and San Marco with the "clone JE1" haplotype, although the San 544
Marco River specimens were not haplotyped. 545
546
Conclusions 547
Analyzed as a whole for the Tyrrhenian Sea region, trout have revealed their geographical genetic 549
organization. 550
The northern islands host precious MUs (not seen elsewhere) with special mention of Corsica, where 551
the relative good health of very small populations suggests that dozens of MUs need protection. Sardinia 552
is similar except that very few trout populations remain for investigation with molecular markers: two 553
MUs could be defined in the Cixerri basin. Sicily is similar to Sardinia since only the south of the island is 554
populated by small populations, but at least two MUs were detected. We do not know if the limited trout 555
range in Sicily is natural or due to human activity. 556
Populations from continental Italy appear less structured, probably as a consequence of both fewer 557
sampling efforts and a strong influence of genetic introgression with the Atlantic genome of domestic 558
origin. Here, therefore, on one hand, two MUs are still recognizable (in central and south Tyrrhenian 559
Italy). On the other hand, caution should be taken for estimation of the number of MUs detected. In future, 560
more effort should be made to include samples from other parts of Tyrrhenian Italy where the historical 561
presence of native brown trout genetic diversity has been highlighted (e.g, Splendiani et al., 2017; Fabiani 562
et al., 2018). 563
The maintenance of these natural lineages, some without domestic introgression, allows optimism 564
regarding conservation of Tyrrhenian trout, which is indispensable for their role in freshwater biodiversity. 565
In view of the great genetic diversity that characterizes Mediterranean trout and the risks of undesirable 566
genetic homogenization by domestic forms, an intelligent conservation strategy should never be carried 567
out without preliminary genetic description of the populations involved in conservation actions. 568
Unfortunately, the number of conservation programs carried out without any kind of control is becoming 569
more and more frequent. 570
571 572
Acknowledgements 573
The authors thank Bernard Lasserre, Sophie Dubois, Yuki Minegishi and Zhaojun Shao for laboratory 574
technical help, Pietro Armenia, Giuseppe Pisani et Andrea Belluscio for field help and David Schikorski 575
(of the private company Labofarm-Genindexe - France) for genotyping most of the considered trouts. 576
Thank you to Martin Laporte and Séverine Roques who participated to statistical solving. Some of the 577
samples were constituted by the French anglers' Federations of Alpes Maritimes and Corsica and the 578
Genesalm project (CIPA). They are warmly thanked. Sicilian samples were collected with permission 579
from the Regional Province of Syracuse and the professional assistance of Pietro Armena. In Calabria and 580
Lazio (Rome) corresponding managers (Giuseppe Pisani in Calabria and Andrea Belluscio in Lazio) 581
linked us with professional fishermen for sampling. We thank them for their irreplaceable assistance. The 582
authors would also like to acknowledge OSU-OREME and Juliette Fabre for their help in database 583
construction and mapping. Saša Marić was supported by the Ministry of Education, Science and 584
Technological Development of the Republic of Serbia (Grant No. 173045). 585
586
References 587
Almodóvar, A., G. G. Nicola, B. Elvira & J. L. García-Marín, 2006. Introgression variability among 588
Iberian brown trout Evolutionary Significant Units: the influence of local management and 589
environmental features. Freshwater Biology 51: 1175-1187. 590
Angers, B., L. Bernatchez, A. Angers & L. Desgroseillers, 1995. Specific microsatellite loci for brook 591
charr (Salvelinus fontinalis Mitchill) reveal strong population subdivision on a microgeographic 592
scale. Journal of Fish Biology 48: 177-185. 593
Araguas, R. M., M. Vera, E. Aparicio, N. Sanz, R. Fernandez-Cebrian, C. Marchante & J. L. García-594
Marín, 2017. Current status of the brown trout (Salmo trutta) populations within eastern Pyrenees 595
genetic refuges. Ecology of Freshwater Fish 26: 120-132. 596
Aurelle, D. & P. Berrebi, 2001. Genetic structure of brown trout (Salmo trutta, L.) populations from 597
south-western France: data from mitochondrial control region variability. Molecular Ecology 598
Aurelle, D. & P. Berrebi, 2002. Natural and artificial secondary contact in brown trout (Salmo trutta, L.) 600
in the French western Pyrenees assessed by allozymes and microsatellites. Heredity 89: 171-183. 601
Avise, J. C., 2000. Phylogeography – The history and formation of species. Cambridge, Massachusetts 602
and London, England: Harvard University Press. 603
Bardakci, F., N. Degerli, O. Ozdemir & H. H. Basibuyuk, 2006. Phylogeography of the Turkish brown 604
trout Salmo trutta L.: mitochondrial DNA PCR-RFLP variation. Journal of Fish Biology 68 605
(Supplement A): 36-55. 606
Behnke, R. J., 1972. The systematics of salmonid fishes of recently glaciated lakes. Journal of the 607
Fisheries Research Board of Canada 29: 639-671. 608
Behnke, R. J., 1986. Brown trout. Trout 27: 42-47. 609
Belkhir, K., P. Borsa, J. Goudet & F. Bonhomme, 2004. GENETIX 4.05: logiciel sous Windows pour la 610
génétique des populations. Laboratoire Génome et Population, CNRS-UPR, Université de 611
Montpellier II, Montpellier, France. 612
Benzécri, J. -P., 1973. L'analyse des données. Dunod, Paris. 613
Bernatchez, L., 2001. The evolutionary history of brown trout (Salmo trutta L.) inferred from 614
phylogeographic, nested clade, and mismatch analyses of mitochondrial DNA variation. Evolution 615
55: 351-379. 616
Bernatchez, L., R. Guyomard & F. Bonhomme, 1992. DNA sequence variation of the mitochondrial 617
control region among geographically and morphologically remote European brown trout Salmo 618
trutta populations. Molecular Ecology 1: 161-173.
619
Bernatchez, L. & A. Osinov, 1995. Genetic diversity of trout (genus Salmo) from its most eastern native 620
range based on mitochondrial DNA and nuclear gene variation. Molecular Ecology 4: 285-297. 621
Berrebi, P., 2015. Three brown trout Salmo trutta lineages in Corsica described through allozyme 622
variation. Journal of Fish Biology 86: 60-73. 623
Berrebi, P., C. Poteaux, M. Fissier & G. Cattaneo-Berrebi, 2000. Stocking impact and allozyme diversity 624
in brown trout from Mediterranean southern France. Journal of Fish Biology 56: 949-960. 625
Berrebi P., C. Tougard, S. Dubois, Z. Shao, I. Koutseri, S. Petkovski & A.J. Crivelli, 2013. Genetic 626
diversity and conservation of the Prespa trout in the Balkans. International Journal of Molecular 627
Sciences 14: 23454-23470. 628
Bianco, P. G., 2014. An update on the status of native and exotic freshwater fishes of Italy. Journal of 629
Applied Ichthyology 30: 62-77. 630
Bohling, J., P. Haffray & P. Berrebi, 2016. Genetic diversity and population structure of domestic brown 631
trout (Salmo trutta) in France. Aquaculture 462: 1-9. 632
Boulenger, G. A., 1901. On the occurrence of Salmo macrostigma in Sardinia. Annals and Magazine of 633
Natural History 8(43): 14. 634
Buroker, N. E., J. R. Brown, T. A. Gilbert, P. J. O’Hara, A. T. Beckenbach, W. K. Thomas & M. J. Smith, 635
1990. Length heteroplasmy of sturgeon mitochondrial DNA, an illegitimate elongation model. 636
Genetics 124: 157-163. 637
Charles, K., R. Guyomard, B. Hoyheim, D. Ombredane & J. -L. Baglinière, 2005. Lack of genetic 638
differentiation between anadromous and resident sympatric brown trout (Salmo trutta) in a 639
Normandy population. Aquatic Living Resources 18: 65-69. 640
Clement, M., D. Posada & K. A. Crandall, 2000. TCS: a computer program to estimate gene genealogies. 641
Molecular Ecology 9: 1657-1660. 642
Cortey, M. & J. L. García-Marín, 2002. Evidence for phylogeographically informative sequence variation 643
in the mitochondrial control region of Atlantic brown trout. Journal of Fish Biology 60: 1058-1063. 644
Cortey, M., C. Pla & J. L. García-Marín, 2004. Historical biogeography of Mediterranean trout. Molecular 645
Phylogenetics and Evolution 33: 831-844. 646
Cortey, M., M. Vera, C. Pla & J. L. García-Marín, 2009. Northern and Southern expansions of Atlantic 647
brown trout (Salmo trutta) populations during the Pleistocene. Biological Journal of the Linnean 648
Society 97: 904-917. 649
Delling, B., 2010. Diversity of western and southern Balkan trouts, with the description of a new species 650
from the Louros River, Greece (Teleostei: Salmonidae). Ichthyological Exploration of Freshwaters 651
21: 331-344. 652
Delling, B. & I. Doadrio, 2005. Systematics of the trouts endemic to Moroccan lakes, with description of a 653
new species (Teleostei: Salmonidae). Ichthyological Exploration of Freshwaters 16: 49-64. 654
De Moor, I. J. & M. N. Bruton, 1988. Atlas of alien and translocated indigenous aquatic animals in 655
southern Africa. National Scientific Programmes Unit: CSIR, SANSP Report 144, pp 317. 656
Doadrio, I., S. Perea & A. Yahyaoui, 2015. Two new species of Atlantic trout (Actinopterygii, 657
Salmonidae) from Morocco. Graellsia 71(2): e031. 658
Duchi, A., 2011. Fecundity, egg and alevin size in the River Irminio population of the threatened Salmo 659
cettii Rafinesque-Schmaltz, 1810 (Sicily, Italy). Journal of Applied Ichthyology 27: 868-872.
660
Duchi, A., 2018. Flank spot number and its significance for systematics, taxonomy and conservation of 661
the near-threatened Mediterranean trout Salmo cettii: evidence from a genetically pure population. 662
Journal of Fish Biology 92: 254-260. 663
Estoup, A., C. R. Largiader, E. Perrot & D. Chourrout, 1996. Rapid one-tube DNA extraction for reliable 664
PCR detection of fish polymorphic markers and transgenes. Molecular Marine Biology and 665
Biotechnology 5: 295-298. 666
Evanno, G., S. Regnaut & J. Goudet, 2005. Detecting the number of clusters of individuals using the 667
software STRUCTURE: a simulation study. Molecular Ecology 14: 2611-2620. 668
Fabiani A., P. Gratton, I. A. Zappes, M. Seminara, A. D’Orsi, V. Sbordoni , & G. Allegrucci, 2018. 669
Investigating the genetic structure of trout from the Garden of Ninfa (central Italy): Suggestions for 670
conservation and management. Fisheries Management and Ecology 25: 1-11. 671
Fruciano, C., A. M. Pappalardo, C. Tigano & V. Ferrito, 2014. Phylogeographical relationships of Sicilian 672
brown trout and the effects of genetic introgression on morphospace occupation. Biological Journal 673
of Linnean Society 112: 387-398. 674
Gandolfi, G., S. Zerunian, P. Torricelli & A. Marconato, 1991. I Pesci delle acque interne italiane. 675
Ministero dell’Ambiente, Instituto Poligrafico e Zecca dello Stato, Rome. pp.616. 676
García-Marín, J. -L., F. M. Utter & C. Pla, 1999. Postglacial colonization of brown trout in Europe based 677
on distribution of allozyme variants. Heredity 82: 46-56. 678
Garnett, S. T., & L. Christidis, 2017. Taxonomy anarchy hampers conservation - The classification of 679
complex organisms is in chaos. Nature 546: 25-27. 680
Gauthier, A. & P. Berrebi, 2007. La colonisation de l'île par différentes souches de truite. Guide de gestion 681
de la truite macrostigma. p 4-10. 682
Giuffra, E., L. Bernatchez & R. Guyomard, 1994. Mitochondrial control region and protein coding genes 683
sequence variation among phenotypic forms of brown trout Salmo trutta from northern Italy. 684
Molecular Ecology 3: 161-171. 685
Giuffra, E., R. Guyomard & G. Forneris, 1996. Phylogenetic relationships and introgression patterns 686
between incipient parapatric species of Italian brown trout (Salmo trutta L. complex). Molecular 687
Ecology 5: 207-220. 688
Gratton P, Allegrucci G, Sbordoni V, and Gandolfi A. 2014. The evolutionary jigsaw puzzle of the 689
surviving trout (Salmo trutta L. complex) diversity in the Italian region. A multilocus Bayesian 690
approach. Molecular Phylogenetics and Evolution 79: 292-304. 691
Guyomard, R., 1989. Diversité génétique de la truite commune. Bulletin Français de Pêche et de 692
Pisciculture 314: 118-135. 693
Hamilton, K. E., A. Ferguson, J. B. Taggart, T. Tomasson, A. Walker & E. Fahy, 1989. Post-glacial 694
colonisation of brown trout, Salmo trutta L.: Ldh-5 as a phylogeographic marker locus. Journal of 695
Fish Biology 35: 651-664. 696
Hebert, P. D. N., A. Cywinska, S. L. Ball & J. R. DeWaard, 2003. Biological identifications through DNA 697
barcodes. Proceedings of the Royal Society, Ser. B, Biological Sciences 270: 313-321. 698
Holm, L. E. & C. Bendixen, 2000. Oncorhynchus mykiss clone TAA72-13, sequence tagged site, 699
Isaac, N. J. B., Mallet, J. & Mace, G. M. 2004. Taxonomic inflation: its influence on macroecology and 701
conservation. Trends in Ecology and Evolution 19, 464-469. 702
Jones, O.R., & Wang J. I., 2010. COLONY: a program for parentage and sibship inference from 703
multilocus genotype data. Molecular Ecology Resources 10, 551-555. 704
Knowles, L. L. & B. C. Carstens, 2007. Delimiting species without monophyletic gene trees. Systematic 705
Biology 56(6): 887-895. 706
Kottelat, M., 1997. European freshwater fishes. An heuristic checklist of the freshwater fishes of Europe 707
(exclusive of former USSR), with an introduction for non-systematists and comments on 708
nomenclature and conservation. Biologia, Bratislava 52 (supplement 5): 1-271. 709
Kottelat, M. & J. Freyhof, 2007. Handbook of European freshwater fishes. Publications Kottelat, Cornol, 710
CH & Freyhof, Berlin, xiv + 646 pp. 711
Largiadèr, C. R. & A. Scholl, 1996. Genetic introgression between native and introduced brown trout 712
(Salmo trutta L.) populations in the Rhone River Basin. Molecular Ecology 5: 417-426. 713
Lucentini, L., A. Palomba, L. Gigliarelli, H. Lancioni, P. Viali & F. Panara, 2006. Genetic 714
characterization of a putative indigenous brown trout (Salmo trutta fario) population in a secondary 715
stream of the Nera River Basin (Central Italy) assessed by means of three molecular markers. Italian 716
Journal of Zoology 73: 263-273. 717
Marić, S., S. Sušnik Bajec, J. Schöffmann, V. Kostov & A. Snoj, 2017. Phylogeography of stream-718
dwelling trout in the Republic of Macedonia and a molecular genetic basis for revision of the 719
taxonomy proposed by S. Karaman. Hydrobiologia 785: 249-260. 720
McMeel, O. M., E. M. Hoey & A. Ferguson, 2001. Partial nucleotide sequences, and routine typing by 721
polymerase chain reaction-restriction fragment length polymorphism, of the brown trout (Salmo 722
trutta) lactate dehydrogenase, LDH-C1*90 and *100 alleles. Molecular Ecology 10: 29-34.
723
Massidda, P., 1995. Salmo (trutta) macrostigma in Sardegna. Biologia Ambientale 5: 40-43. 724