1
Biogenic volatile organic compound emissions from senescent
1maize leaves and a comparison with other leaf developmental
2stages
3 4A. Mozaffara,b, N. Schoonb, A. Bachya, A. Digradoc, B. Heinescha, M. Aubineta, M.-L. 5
Fauconniera, P. Delaplacec, P. du Jardinc and C. Amelynckb,d 6
7 a
TERRA Research Center, University of Liege, Gembloux Agro-Bio Tech, 8 Avenue de la 8
Faculté, B-5030, Gembloux, Belgium 9
b
Royal Belgian Institute for Space Aeronomy, Ringlaan 3, B-1180, Brussels, Belgium 10
c
Plant Biology Laboratory, AGRO-BIO-CHEM Research Unit, University of Liege, Gembloux 11
Agro-Bio Tech, 2 Passage des Déportés, B-5030, Gembloux, Belgium 12
d
Department of Analytical Chemistry, Ghent University, Krijgslaan 281-S12, B-9000, Ghent, 13
Belgium 14
15
Correspondence to: C. Amelynck ([email protected]) 16
17
Keywords: Leaf senescence; maize; BVOC; GLV; PTR-MS; methanol 18
19 20 21
2
Abstract
22
Plants are the major source of Biogenic Volatile Organic Compounds (BVOCs) which have a 23
large influence on atmospheric chemistry and the climate system. Therefore, understanding of 24
BVOC emissions from all abundant plant species at all developmental stages is very important. 25
Nevertheless, investigations on BVOC emissions from even the most widespread agricultural 26
crop species are rare and mainly confined to the healthy green leaves. Senescent leaves of grain 27
crop species could be an important source of BVOCs as almost all the leaves senesce on the field 28
before being harvested. For these reasons, BVOC emission measurements have been performed 29
on maize (Zea mays L.), one of the most cultivated crop species in the world, at all the leaf 30
developmental stages. The measurements were performed in controlled environmental conditions 31
using dynamic enclosures and proton transfer reaction mass spectrometry (PTR-MS). The main 32
compounds emitted by senescent maize leaves were methanol (31% of the total cumulative 33
BVOC emission on a mass of compound basis) and acetic acid (30%), followed by acetaldehyde 34
(11%), hexenals (9%) and m/z 59 compounds (acetone/propanal) (7%). Important differences 35
were observed in the temporal emission profiles of the compounds, and both yellow leaves 36
during chlorosis and dry brown leaves after chlorosis were identified as important senescence-37
related BVOC sources. Total cumulative BVOC emissions from senescent maize leaves were 38
found to be among the highest for senescent Poaceae plant species. BVOC emission rates varied 39
strongly among the different leaf developmental stages, and senescent leaves showed a larger 40
diversity of emitted compounds than leaves at earlier stages. Methanol was the compound with 41
the highest emissions for all the leaf developmental stages and the contribution from the young-42
growing, mature, and senescent stages to the total methanol emission by a typical maize leaf was 43
61, 13, and 26%, respectively. This study shows that BVOC emissions from senescent maize 44
leaves cannot be neglected and further investigations in field conditions are recommended to 45
further constrain the BVOC emissions from this important C4 crop species. 46
47 48
3
1 Introduction
49 50
Terrestrial vegetation is a huge source of volatile organic compounds (VOCs) in the Earth’s 51
atmosphere. Besides playing a role in plant biology and ecology (Pierik et al., 2014), biogenic 52
VOCs (BVOCs) are generally highly reactive with the major atmospheric oxidants, thus 53
affecting the oxidation capacity of the atmosphere, air quality and climate (Atkinson, 2000; 54
Laothawornkitkul et al., 2009; Pacifico et al., 2009). BVOC emissions from plants are highly 55
species-specific and not only depend on environmental conditions (Guenther et al., 2012) and 56
abiotic or biotic stress factors (Holopainen et al., 2010) but also on plant ontogeny (Bracho-57
Nunez et al., 2011). Therefore they should be investigated at all developmental stages, including 58
senescence. 59
Leaf senescence is the final stage of leaf development. It is a complex energy-dependent self-60
digesting process that facilitates the remobilisation of nutrients from the senescing leaf to 61
growing vegetative plant organs or developing seeds and fruits, where they are reused for 62
biosynthesis (Woo et al., 2013; Keskitalo, 2005; Gan and Amasino, 1997; Taiz et al., 2015). 63
Under normal growing conditions leaf senescence is governed by the developmental age of the 64
leaves, which is a function of hormones and other regulatory factors (Taiz et al., 2015). Under 65
unfavourable environmental conditions (e.g. drought or enhanced ozone concentrations) or biotic 66
stress (e.g. pathogen infestation), however, the leaf senescence process can occur prematurely. 67
Three main phases are generally distinguished in the developmental leaf senescence process 68
(Taiz et al., 2015). The initiation phase is characterised by a gradual decline in photosynthesis 69
and a transition of the leaf from being a nitrogen sink to a nitrogen source. Self-digestion of 70
cellular constituents and macromolecules mainly occurs during the second phase, the 71
degenerative phase. The third phase, the terminal phase, is characterised by loss of cellular 72
integrity, cell death, and finally (in most cases) leaf abscission. 73
Although numerous studies have already been performed on BVOC emissions from healthy 74
and growing leaves where cells were developing (Kuhn et al., 2002; Harley et al., 2007; Hüve et 75
al., 2007; Folkers et al., 2008; Bracho–Nunez et al., 2011; Mozaffar et al., 2017), studies on 76
senescent leaves where cells are breaking down (Gan and Amasino, 1997) are very rare. As far 77
4
as we know, there is only one leaf-scale study, performed under controlled conditions 78
(Holopainen et al., 2010), in which VOC emissions from undetached senescent leaves (of Betula 79
pendula Roth) have been measured, but the measurement frequency was too low (1 Gas 80
Chromatography – Mass Spectrometry (GC-MS) sample every 3 days) to adequately represent 81
the emission dynamics. Therefore, additional studies at increased time resolution are required for 82
a better characterisation of BVOC exchanges between senescent leaves and the atmosphere 83
during the whole senescence period. 84
To assess the importance of BVOC emission rates from the senescent leaves of a plant, 85
information about BVOC emission rates from other leaf developmental stages (young, semi-86
mature, mature) is also necessary. In this study we will mainly focus on BVOC emissions from 87
senescent maize (Zea Mays L.) leaves, but we will also compare them with BVOC emissions 88
from other developmental stages of maize leaves measured under the same environmental 89
conditions. Despite being a vastly cultivated crop species worldwide, only a few literature 90
studies have been devoted to BVOC emissions for this species (MacDonald and Fall, 1993; Das 91
et al., 2003; Graus et al., 2013; Bachy et al., 2016; Mozaffar et al., 2017) and none of them cover 92
all the leaf developmental stages. In particular, data on BVOC emission rates from senescent 93
maize leaves are missing in the abovementioned literature. 94
Maize is a monocarpic (a plant which only flowers and bears fruit once in its lifetime) 95
herbaceous C4 plant for which whole plant senescence occurs with seed maturation (Lim et al., 96
2007). However, the first leaf at the base of the plant starts senescing long before flowering and 97
this process continues for all the leaves from the base to the top of the plant throughout the 98
growing season. Therefore, emissions from senescent leaves could provide a significant 99
contribution to the total BVOC emission budget from a maize field, as suggested by de Gouw et 100
al. (2000). 101
In order to improve the knowledge on BVOC emissions from this important crop species we 102
aim to provide answers to the following specific questions: 1) which BVOCs are emitted during 103
the senescence process and in what proportions, 2) how do BVOC emissions from senescent 104
maize leaves compare to those from other species of the Poaceae family, 3) how do BVOC 105
emission rates vary among the different leaf developmental stages of maize, and 4) what are the 106
5
contributions of the different developmental stages to the total emission of individual BVOC 107
compounds by a maize leaf/plant. 108
2 Materials and methods
1092.1 Plants and environmental conditions
110
The experiments were performed on maize leaves (Zea mays L., variety Prosil, Caussade 111
Semences, France) at four different leaf developmental stages: young, semi-mature, mature, and 112
senescent. To measure BVOC exchanges between young leaves and the atmosphere, 8 to 14 day 113
old maize plants (age counting began at seed germination) were used. The shoots of the young 114
maize plants were completely enclosed because it was not feasible to enclose a single young leaf 115
for a sufficiently long period without damaging it due to the fast elongation rate of both leaves 116
and stem. The upper part (ca. 55 cm starting from the tip) of almost fully developed, healthy 7th 117
leaves of 30-40 day old plants (around 120 cm tall) and the fully developed (7th, 8th or 9th) leaves 118
of 60-70 day old, fully grown plants (around 180 cm tall) were enclosed to measure BVOC 119
emission rates from semi-mature and mature leaves during 5 consecutive days, respectively. The 120
above-mentioned leaf numbers refer to the order in which new leaves appear during plant 121
development and leaf numbering thus starts from the base. The choice for (mainly) 7th leaves 122
was determined by their position with respect to the ground and the ceiling level of the 123
environmental chamber and the possibility to enclose them without damaging them. Senescence-124
induced BVOC emission rates were measured from senescing (7th, 8th or 10th) leaves of fully 125
grown 60-95 day old plants. The upper half of those leaves was enclosed a few days before the 126
start of the senescence initiation phase, which was identified by a decrease of photosynthesis 127
(Taiz et al., 2015) and preceded chlorosis, i.e. leaf yellowing due to chlorophyll degradation, by 128
a few days. Chlorosis started at the tip of the leaf and gradually progressed towards the base of 129
the enclosed leaf within 5-10 days (range for 10 replicates). The onset and evolution of leaf 130
chlorosis, however, could only be determined visually and not by a quantitative metric (e.g. 131
photochemical efficiency or chlorophyll content). When describing the BVOC emission rate 132
dynamics in Section 3.1, the term “chlorosis period” refers to the period between the first visual 133
signs of yellowing and the total absence of green areas on the enclosed part of the leaf. Whereas 134
6
the period between the onset of the decrease of photosynthesis and the onset of chlorosis can be 135
considered as the initiation phase of leaf senescence, the chlorosis period largely coincides with 136
the degenerative phase. The terminal phase can be mainly associated with the post-chlorosis 137
period (from the end of the chlorosis period to the end of the measurements). It is to be noted that 138
the third phase of senescence in maize does not imply leaf abscission. In order to support the 139
description of the temporal evolution of senescence and BVOC emissions in this Section and in 140
subsections 3.1.1 and 3.1.2, daily pictures of a typical senescent leaf (taken at 10 AM every day), 141
along with the temporal evolution of the daily net photosynthesis rate and the methanol and 142
acetic acid daily emission rates are shown in Fig. 1. 143
144
Figure 1 145
146
Investigations on young, semi-mature, and mature leaves were performed on 5 replicates for 147
each stage, and 10 replicates were used for investigating emissions from senescent leaves. More 148
details about the enclosed leaves at the different leaf developmental stages and the associated 149
plant age and developmental status can be found in Table 1. 150
All these experiments were conducted on potted (20 L pots filled with a mixture of 75% silty 151
clay loam soil and 25% sand) plants in a temperature and light controlled environmental 152
chamber. Details about the environmental chamber can be found in Mozaffar et al. (2017). The 153
soil was fertilised before planting with NPK fertiliser (6-5-5, Substral Nutrimax, Belgium) 154
containing micronutrients (Cu, Fe, Mn, Mo, Zn). Daytime temperature in the environmental 155
chamber was maintained at 25°C throughout the experimental period and during the night the 156
temperature decreased by around 2°C due to the absence of a heat source. Seventeen hours of 157
photoperiod at three different PPFD (Photosynthetic Photon Flux Density) values (100, 330 and 158
600 µmol m-2 s-1) were alternated with seven hours of darkness (Fig. 2). All the plants were 159
watered regularly to maintain a good soil moisture content (35-40%, field capacity was 40%). 160
161 162
7
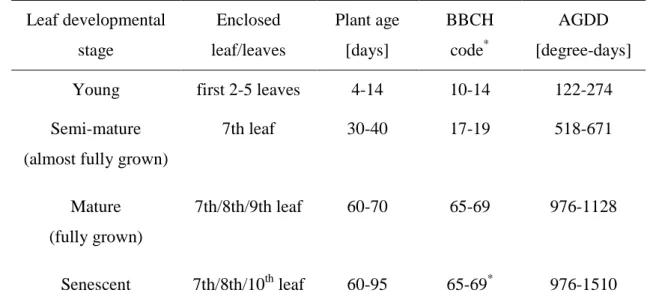
Table 1: Detailed information about the enclosed leaf/leaves at the different leaf developmental
163
stages, the associated plant age and two useful metrics, BBCH code and AGDD (Accumulated 164
Growing Degree-Days), for the plant developmental stages at which the experiments were 165
carried out. The BBCH code and AGDD are explained in supplement S1. 166 Leaf developmental stage Enclosed leaf/leaves Plant age [days] BBCH code* AGDD [degree-days] Young first 2-5 leaves 4-14 10-14 122-274 Semi-mature
(almost fully grown)
7th leaf 30-40 17-19 518-671 Mature (fully grown) 7th/8th/9th leaf 60-70 65-69 976-1128 Senescent 7th/8th/10th leaf 60-95 65-69* 976-1510 *
range of BBCH codes at which the onset of senescence was identified for the enclosed leaves. 167
168 169
2.2 Experimental setup
170
Young maize shoots were enclosed in 22 L cylindrical dynamic flow-through enclosures made of 171
transparent PFA (perfluoroalkoxy Teflon) envelope (Norton, Saint-Gobain Performance Plastics, 172
NJ, USA). Similar 30 L enclosures were used to partially enclose the semi-mature, mature, and 173
senescent leaves. In addition, a similar empty enclosure was used to measure the background 174
VOC concentrations in the air that was supplied to the enclosures. The enclosures were equipped 175
with a Teflon fan, a thermistor (type 10k, NTC, Omega, UK), and a relative humidity sensor 176
(type HIH-3610, Honeywell, NJ, USA ) for proper mixing of air and continuous monitoring of 177
leaf temperature, air temperature and relative humidity, respectively. Relative humidity and CO2 178
concentration in the 5 SLM (standard litre per minute) air flow sent through each of the 179
enclosures were controlled at around 40% and 400 ppm, respectively. A conventional high-180
sensitivity quadrupole-based Proton Transfer Reaction-Mass Spectrometry instrument (hs-PTR-181
8
MS, Ionicon Analytik GmbH, Innsbruck, Austria) and a LI-7000 non-dispersive IR gas analyser 182
(LI-COR, Lincoln, Nebraska, USA) were used to determine BVOC, H2O and CO2 183
concentrations. In general, BVOC and H2O calibrations were performed every 3-5 days and CO2 184
calibrations were performed monthly. Further details about the set-up have been presented in 185
Mozaffar et al. (2017). 186
2.3 Tentative identification and quantification of emitted BVOCs
187
The operating principle and technical details of the PTR-MS technique have been amply 188
described in the literature (e.g. Lindinger et al., 1998; Ellis and Mayhew, 2013). In the present 189
work, the quadrupole-based hs-PTR-MS instrument was operated at a drift tube pressure and 190
temperature of 2.1 hPa and 333 K, respectively, and at an E/N value (ratio of the electric field to 191
the air number density in the drift tube) of 130 Td (1 Td = 10-17 V cm2). Measurements were 192
carried out in the Multiple Ion Detection mode, in which the instrument continuously cycled 193
through a list of preset m/z values of BVOC-related ion species for which signal intensities 194
above the detection limit have been observed in PTR-MS spectra of maize leaf emissions. The 195
m/z values of ions which were used for emission rate quantification, along with a tentative 196
identification of the associated BVOCs are shown in Table 2. This identification mainly relies on 197
Karl et al. (2005) who unambiguously identified BVOCs released from drying rice (O. sativa) by 198
using the hyphenated GC/PTR-MS technique. In addition to the BVOC-related ions, isotopes of 199
the reactant ion species H3O+ (at m/z 21) and its first hydrate H3O+•H2O (at m/z 39) were 200 monitored. 201 202 203 204 205 206 207
9
Table 2: The m/z ratios and list of potential contributory compounds for which emission rates 208
were quantified. Compounds that were present in the multi-component calibration bottles are 209
indicated in bold and their mixing ratios (±5% accuracy) in the bottles are also shown. 210
m/z Compound Mixing ratio (ppbv)
Bottle 1a Bottle 2a
33 Methanol 1074 1013
45 Acetaldehyde 999 969
57 Hexenals 1041b
59 Acetone, propanal, 2,3-butanedione 973 502
61 Acetic acid
69 Isoprene, pentenol, n-pentanal 441 483
73 Methyl ethyl ketone (MEK), 2-methyl-propanal,
butanal 494 516
81 Monoterpenes, 851c
Hexenals 1041b
83 Hexenols, n-hexanal, hexenyl acetates 986d
99 Hexenals 1041b
137 Monoterpenes 851c
211 a
Calibration bottle 1 was used for the experiments with young, semi-mature and mature leaves. 212
Bottle 2 was used for the senescence experiments. 213
b
Trans-2-hexenal was used as a proxy for hexenals and was the only compound in calibration 214
bottle 2 which resulted in product ions at m/z 81. 215
c
Alpha-pinene (452 ppbv) and sabinene (399 ppbv) were used as proxies for the monoterpene 216
family and were the only compounds in calibration bottle 1 which resulted in product ions at m/z 217
81. 218
d
Only the cis-3-hexenol isomer was present in the calibration bottle 219
10
PTR-MS calibrations were performed by using two gravimetrically prepared multi-component 221
mixtures of BVOCs in nitrogen (Apel-Riemer Environmental Inc., Denver, CO, USA) with a 222
certified accuracy of 5%. The calibration gas was further diluted with zero air, generated by 223
sending ambient air through a catalytic converter (Parker® ChromGas® Zero Air Generator, 224
model 1001, Parker Hannifin Corporation, Haverhill, MA, USA), to obtain mixing ratios in the 225
lower ppbv range. When several compounds potentially contributed to the ion signal at a given 226
nominal m/z value (e.g. methyl ethyl ketone, 2-methyl-propanal and butanal at m/z 73), it was 227
assumed that they possessed similar calibration factors. By calibrating the PTR-MS to the 228
compound indicated in bold in Table 2 (methyl ethyl ketone for the above-mentioned example) 229
and applying the calibration factor to the measured ion signal at that m/z, we estimated the sum 230
of the concentrations of those compounds. 231
The H3O+/monoterpene reaction in the drift tube reactor of the PTR-MS is known to result 232
mainly in the protonated molecule at m/z 137 and a fragment at m/z 81 and the product ion 233
distribution is isomer-dependent (Tani et al., 2003). However, since the rate constant for proton 234
transfer from H3O+ to monoterpenes is isomer-independent, the sum of the ion signals at m/z 81 235
and 137, weighted for their relative transmission in the mass spectrometer, is expected to be 236
isomer-independent. This sum was used to determine the emission rate of all monoterpene 237
isomers emitted by the young, semi-mature, and mature leaves. During the measurements with 238
senescent leaves the ion signals at m/z 137 were always below the detection limit, even when ion 239
signals at m/z 81 were maximal (I137/I81 at maximum I81 is 0.01 ± 0.02 with I137(81) being the net 240
ion signal at m/z 137(81)). This indicates that monoterpene emission rates were not significant 241
during this stage and that ions at m/z 81 did not result from dissociative proton transfer of 242
monoterpenes but corresponded to dehydrated protonated hexenals. In order to obtain accurate 243
emission rates for the sum of hexenal isomers, the other main proton transfer product ions of 244
hexenals at m/z 57 and m/z 99 (Pang, 2015) were also continuously monitored, both during the 245
enclosure measurements and calibrations, and the sum of the signals of the three product ion 246
species, weighted for ion transmission in the mass spectrometer, was used to derive the emission 247
rate of the sum of hexenal isomers. As hexenals and monoterpenes both result in a product ion at 248
m/z 81, calibration of the PTR-MS for those compounds required the use of two multi-249
component calibration mixtures containing either a hexenal or a monoterpene, in addition to the 250
11
other compounds to be quantified (Table 2). The calibration mixture containing the 251
monoterpenes was used for the experiments on young, mature, and semi-mature leaves, whereas 252
the mixture containing hexenal was used for the experiments on senescent leaves. 253
The calibration factor for acetic acid (at m/z 61), a compound which was not present in the 254
calibration bottles, was estimated from the factor for acetone (at m/z 59) by considering the 255
fragmentation of the protonated molecules in the drift tube (Inomata and Tanimoto, 2010; 256
Schwarz et al., 2009) and the ratio of the calculated collision rate constants for the proton 257
transfer reactions (Su, 1994), and by assuming the same PTR-MS transmission efficiency for 258
ions at m/z 59 and 61. The m/z 81 and 83 compounds emitted by the senescent leaves are 259
associated to C6 volatiles (hexenals, hexanal, hexenols, hexenyl acetates) and will be designated 260
as green leaf volatiles (GLVs) hereafter. 261
2.4 Emission rate computation
262
Unless explicitly mentioned otherwise, BVOC emission rates EBVOC from maize leaves are 263
expressed as mass flow rates per unit of leaf dry weight [µg of the compound gDW-1 s-1]. They are 264
calculated according to Eq. 1 in which Fair is the molar flow rate of the air which is supplied to 265
the enclosure, MBVOC is the molar mass of the BVOC, DW is the dry weight of the enclosed (part 266
of the) leaf, and xBVOC,PE and xBVOC,RE are the mole fractions of the BVOC in the sampled air 267
from the plant enclosure and the empty reference enclosure, respectively. 268
= × , − , × (1)
The mole fractions of the BVOC are obtained by dividing the normalised background-corrected 269
PTR-MS BVOC ion signals Im/z, expressed in normalised counts per second (ncps), by the 270
BVOC calibration coefficients CBVOC [ncps ppbv-1] (Mozaffar et al., 2017). 271
The dry weight of the leaves was determined at the end of the experiments after at least 48 272
hours of drying in an oven at 75°C until all water was evaporated and a constant weight was 273
reached. Photosynthesis and transpiration rates were obtained in a similar way but are expressed 274
in molar units and per unit of leaf area [mol m-2 s-1]. Leaf area was estimated as described in 275
Mozaffar et al. (2017). 276
12
277
3 Results and discussion
2783.1 BVOC emissions from senescent maize leaves
279
Significant emissions of methanol, acetaldehyde, m/z 59 compounds, acetic acid, and hexenals 280
were observed from senescent maize leaves and their temporal evolution is shown in Fig. 2 for a 281 single leaf. 282 283 Figure 2 284 285
Although the plants were grown and investigated under the same environmental conditions, a 286
considerable variability was noticed in the temporal evolution of the emissions among the 287
different replicates as is shown in Figures S1a and S1b in Supplement S1. However, the BVOC 288
emission dynamics from the investigated leaves show similar characteristics, as will be described 289
in the following subsections. Small emission rates of m/z 69, m/z 73 and m/z 83 compounds 290
were also noticed (Table 3), but they often barely exceeded the detection limit. The emergence of 291
BVOC emissions or their increase (in case the BVOC was also emitted constitutively) took place 292
at the start of the degeneration phase. Photosynthesis and transpiration diminished gradually as 293
chlorosis progressed from the apex towards the base of the leaf and finally stopped 2-4 days 294
before the end of the chlorosis period (as shown in Fig. 2 for one replicate). While some of the 295
BVOCs were predominantly emitted during and just after the degeneration phase, others were 296
emitted during the termination phase of senescence as well, as will be discussed in detail in the 297
following sections. 298
The temporal emission dynamics of the individual BVOC species, the relative contribution of 299
their cumulative emissions to the total emission, as well as a comparison with cumulative 300
emissions for other senescent species of the Poaceae family will be discussed hereafter. 301
13
3.1.1 Methanol, acetaldehyde and GLVs are predominantly emitted during the
302
degeneration phase of leaf senescence
303
At the beginning of the chlorosis period, the emission rates of methanol, acetaldehyde, and 304
hexenals rose slowly as leaf discoloration moved from the tip to the base and they increased 305
faster when the leaf was turning brown and was shrinking due to the drying process. The highest 306
emission rates occurred at around 1-3, 0-2 and 0-2 days before the end of the chlorosis period, 307
respectively (Fig. 2 and Fig. S1a). By then photosynthesis and transpiration from the steadily 308
decreasing green part of the enclosed leaf were already greatly reduced. Emissions of methanol, 309
acetaldehyde, and hexenals exceeding 20% of their maximum value lasted for 3-8, 3-7, and 2-7 310
days, respectively. The temporal evolution of normalised m/z 83 compound emission rates was 311
similar to that of normalised hexenal emission rates (data not shown). The variability in the 312
duration of the high emission periods for the different compounds reflects the variability in 313
temporal emission profiles for the 10 replicates (Fig. S1a in Supplement S1) . Figure 2 also 314
shows small methanol and acetaldehyde emissions after the chlorosis period which persisted 315
until the end of the measurements. These emissions showed a fixed diurnal pattern with a 316
maximum emission rate of at most 10% of the maximum emission rate during the chlorosis 317
period. 318
As can be seen in Fig. 2 and in Fig. S1a, no distinct diurnal patterns were observed for 319
methanol, acetaldehyde, and GLV emission rates during the chlorosis period and there was no 320
clear correlation between these emission rates and the environmental conditions (temperature, 321
PPFD) in the dynamic enclosures. This is in agreement with previous observations of emissions 322
of these compounds from drying leaves (Fall et al., 1999; Warneke et al., 1999; Warneke et al., 323
2002). 324
The link between the evolution of the senescent leaf and the temporal emission profile 325
suggests that the biochemical and physical mechanisms involved in leaf chlorosis and drying are 326
major drivers of BVOC emissions during leaf senescence. Presumably collapse of the cellular 327
structure during drying (Karl et al., 2001a; Karl et al., 2001c; de Gouw et al., 1999) and 328
disintegration of cell organelles and dying cells (Keskitalo et al., 2005) are at the origin of high 329
emissions of these compounds. Ozuna et al. (1985) reported that the stomata of senescent 330
14
Nicotiana glauca leaves which already showed marked chlorosis (the degree of chlorosis varied 331
from 60 to 90% of the total leaf surface area) remained closed even in the presence of light. As 332
maximum emissions of methanol and acetaldehyde in our experiments were measured close to 333
the end of the chlorosis period, the main emission route for those compounds during the 334
degeneration phase of leaf senescence was therefore probably no longer diffusion through the 335
stomata, as is the case for healthy leaves (MacDonald and Fall, 1993; Kreuzwieser et al., 2000; 336
Rottenberger et al., 2004). As changes in the biomechanical properties of the epidermis cuticle 337
have been reported for Sonneratia alba leaves (Takahashi et al., 2012) during this senescence 338
phase, diffusion of those compounds through a degraded epidermal layer might be considered as 339
a potential emission route. 340
341
In leaves, methanol is mainly produced by pectin demethylation in the cell wall, catalysed by 342
pectin methylesterase (PME) enzymes (Fall and Benson, 1996; Fall 2003). This process occurs 343
during growth as well as during aging and senescence of plant tissues (Nemecek-Marshall et al., 344
1995). Due to continuous breakdown of cellular materials for nutrient remobilisation during the 345
degeneration phase of senescence (Woo et al., 2013; Keskitalo, 2005), massive changes occur in 346
the primary cell wall structure, which potentially stimulates massive methanol production. 347
Methanol emissions from the dead, brown leaves during the termination phase could be either 348
due to the physical membranes breakdown following dehydration or result from the presence of 349
active PME in dead plant materials (Castaldo et al., 1997; Galbally and Kirstine, 2002). Indeed, 350
most of the PME formed by the plant remains active under normal environmental conditions and 351
is capable of demethylation of about 65% of the pectin in the dead plant material (Galbally and 352
Kirstine, 2002). 353
The acetaldehyde production mechanism in senescent leaves is not yet well known, but fatty 354
acid peroxidation by reactive oxygen species (ROS) has been suggested by Jardine et al. (2009) 355
as a potential mechanism based on their 13C isotope analysis studies on stressed leaves of 356
deciduous trees. As increased oxidative stress and lipid peroxidation have been observed 357
(Prochazkova et al., 2001) during maize leaf senescence, the suggested mechanism might be 358
responsible for high production of acetaldehyde during the degeneration phase. 359
15
GLV emissions from senescent leaves have been reported previously in the literature. While 360
Holopainen et al. (2010) mentioned increases in GLV emissions from senescent leaves of Betula 361
pendula Roth before abscission, others observed hexenal and hexenol emissions from leaf drying 362
experiments (Fall et al., 1999; Fall et al., 2001; de Gouw et al., 2000; Karl et al., 2001a; Karl et 363
al., 2001c; Karl et al., 2001b; Warneke et al., 2002; Karl et al., 2005). During leaf senescence, 364
most of the cellular fatty acids are oxidised to supply energy for the senescence process (Lim et 365
al., 2007). Since fatty acid oxidation, catalysed by 13-lipoxygenase (13-LOX), is the initial step 366
in GLV production in leaves (Scala et al., 2013; Hatanaka et al., 1993), high GLV emissions can 367
be expected during leaf senescence. Furthermore, recent research revealed the key role of this 368
enzyme in the degradation of chloroplasts during leaf senescence (Springer et al., 2016), 369
potentially leading to strong increases in the emission of GLVs with increasing chlorosis of the 370 leaf. 371 3.1.2 Persistent m/z 59 compounds and acetic acid emissions during the 372 terminal phase of leaf senescence 373
Whereas the temporal evolution of acetic acid emissions was well-marked and no emissions 374
were observed prior to senescence, normalized m/z 59 compounds emissions from senescent 375
leaves showed a much smaller increase with respect to the constitutive emissions by the end of 376
the chlorosis period (Fig. 2 and Fig. S1b). Normalised acetic acid and m/z 59 compounds 377
emissions increased somewhat slower than those of methanol, acetaldehyde and GLVs, resulting 378
in a delay of their maximum emissions with respect to the latter three compounds by 1-2 days. 379
Furthermore, in strong contrast to methanol, acetaldehyde and GLVs, acetic acid and m/z 59 380
compounds emission rates remained close to their maximal value for a few days after the end of 381
the chlorosis period and then slowly decreased with time, but never reached zero during the 382
entire measurement period. Early morning acetic acid emissions were generally somewhat lower 383
than at the end of the day, presumably due to a decrease in temperature in the leaf enclosures 384
during the night. A similar diurnal behaviour was observed for the m/z 59 compounds emissions 385
from senescent leaves which, in contrast to the pre-senescence constitutive emissions, remained 386
well above the zero level in dark conditions. High day and night-time m/z 59 compounds 387
emissions (acetone) from dry plant parts and litter have previously been mentioned in the 388
16
literature (Schade and Goldstein, 2001; Warneke et al., 2002) and acetic acid emissions from dry 389
plant material have been reported as well (Kesselmeier et al., 1998; Warneke et al., 1999; Crespo 390
et al., 2013). The production of acetone and acetic acid during the drying process following the 391
chlorosis period might be explained by the occurrence of a non-enzymatic Maillard reaction 392
(Ikan et al., 1996). After the end of the chlorosis period a significant positive correlation (R2 = 393
0.53, P < 0.01) was observed between the acetic acid emissions and the relative humidity of the 394
air supplied to the enclosures. Similarly, Warneke et al. (1999) observed a large increase in 395
partially oxidised VOC (POVOC) emissions after wetting of dried biomatter. They explained 396
this by the transfer of some of the POVOC molecules, produced by the Maillard reaction and 397
remaining attached to the surface of the solid structure of the dry leaf material, to the aqueous 398
phase through replacement by highly polar water molecules. The dissolved POVOCs were 399
subsequently transferred from the aqueous to the gas phase until a gas/liquid equilibrium, 400
determined by the Henry’s law constant, was reached. Although the dry leaves were not wetted 401
in our experiments, release of acetic acid molecules from the biomass surface layer may have 402
been influenced by the presence of a relative humidity dependent microlayer of water on the 403
surface layer or by interactions with polar water vapour molecules. Those interactions may have 404
promoted the release of the polar BVOC molecules from the surface layer. A short additional 405
experiment was carried out in which an inert surface, coated with a pure acetic acid microlayer, 406
was inserted in an empty enclosure demonstrated that such a positive correlation between acetic 407
acid emissions and relative humidity was not restricted to senescent biomass. Indeed, the acetic 408
acid emission rate from the coated surface, which was of similar magnitude to that of the 409
enclosed senescent maize leaves, was found to increase by a factor of 2.7 when increasing the 410
relative humidity of the purge air from 40 to 64 %. Moreover, increased emissions of acetic acid 411
and other polar compounds with increasing relative humidity have been reported previously from 412
other materials such as wood boards (Steckel et al., 2013) and indoor furniture (Fechter et al., 413
2006; Schaeffer et al., 1996). 414
17 3.1.3 Absolute BVOC emissions from senescent maize leaves and relative 415 contribution of the emitted compounds to the total BVOC emission from 416 senescent leaves 417
Cumulative emissions of the quantified BVOCs for the different senescence phases are shown in 418
Table 3, along with the maximum instantaneous emissions and the maximum daily emissions 419
that have been observed over the entire senescence period. Additional statistical information on 420
instantaneous and daily emissions and on cumulative emissions from the investigated senescent 421
leaves is provided in Table S2 and in Fig. S2 in Supplement S1. The emission rates for some 422
compounds (e.g. methanol, m/z 59 compounds, and acetic acid) were still well above the 423
detection limit at the end of the measurement period. Consequently, the reported cumulative 424
emission values from the onset of senescence to the end of the measurement period (31 days) for 425
those compounds should be considered as lower limits for their total cumulative emissions 426
during leaf senescence. 427
18
Table 3: BVOC emissions from maize leaves at different leaf developmental stages. Maximum values for the instantaneous (Einst,max)
428
and for the daily emission rate (Eday,max), and cumulative emissions for the initiation, degeneration, and termination phases are shown
429
for the different BVOCs emitted during senescence. Also tabulated are the daily emission rates (Eday) from young, semi-mature and
430
mature maize leaves. Data for the senescent leaves are averages over 10 replicates and data for the young, semi-mature and mature 431
leaves are averages over 5 replicates. The error on the emission rates corresponds to the standard deviation (1σ). 432
433
Compounds
Senescent leaves Young
leaves Semi-mature leaves Mature leaves Einst,max (ng gDW-1 s-1) Eacc (µg gDW-1) Eday,max (µ g gDW-1 day-1) Eday (µ g gDW-1 day-1) Eday (µg gDW-1 day-1) Eday (µg gDW-1 day-1) Initiation phase Degeneration phase Termination phase Methanol 0.9 ± 0.4 14 ± 11 150 ± 30 50 ± 20 53 ± 16 137 ± 17* 4.1 ± 0.7* 4.8 ± 1.0* Acetaldehyde 0.38 ± 0.10 1 ± 2 44 ± 12 32 ± 19 15 ± 3 - - - m/z 59 compounds 0.05 ± 0.02 5 ± 5 12 ± 7 31 ± 20 2.3 ± 1.2 2.7 ± 1.1 0.4 ± 0.2 0.9 ± 0.3 Acetic acid 0.17 ± 0.05 6 ± 7 40 ± 20 160 ± 60 12 ± 4 <DL** <DL <DL m/z 69 compounds 0.08 ± 0.02 3 ± 3 13 ± 8 22 ± 16 3.4 ± 1.3 <DL <DL <DL m/z 73 compounds 0.03 ± 0.02 3 ± 4 5 ± 7 11 ± 15 1.2 ± 1.3 1.7 ± 1.0 0.4 ± 0.2 0.30 ± 0.08 Hexenals 0.21 ± 0.14 6 ± 7 30 ± 20 20 ± 20 10 ± 8 - - - Monoterpenes <DL <DL <DL <DL <DL 10 ± 6 0.6 ± 0.2 0.4 ± 0.2 m/z 83 compounds 0.07 ± 0.02 1.4 ± 1.7 9 ± 6 11 ± 9 2.6 ± 1.5 - - -
*: Mozaffar et al. (2017); ** Detection Limit 434
19 436
Methanol and acetic acid were clearly the compounds with the highest emissions (expressed in 437
mass of compound per leaf dry weight), accounting both for around 30% of the total cumulative 438
emission from the onset of senescence to the end of the investigations (Fig. 3a). They were 439
followed by acetaldehyde (11%), hexenals (9%), m/z 59 compounds (7%), and m/z 69 440
compounds (6%). The m/z 73 and m/z 83 compounds also made up a small fraction of the total 441
BVOC emissions from the senescent leaves, but their individual contributions were not higher 442 than 3%. 443 444 Figure 3 445 446
Fig. 3 clearly shows that the relative contribution of the emitted compounds varied among the 447
time periods considered. Differences in relative BVOC composition reflect the differences in 448
temporal emission dynamics among BVOCs that were discussed in Section 3.1.1 and 3.1.2. 449
Indeed, as methanol, acetaldehyde, and hexenals were predominantly emitted during the 450
degeneration phase (see Table 3), it is clear that those compounds together made up a large part 451
(75%) of the BVOC emissions for that period (Fig. 3b). Because of the strong persistence of m/z 452
59 compounds and acetic acid emissions after the chlorosis period, the relative contribution of 453
those compounds increased with time after that period. During the termination phase (Fig. 3c), 454
the m/z 59 compounds and acetic acid together made up half (55%) of the BVOC emissions, and 455
acetic acid was predominantly emitted during that period (46%). 456
While some studies (Karl et al., 2001b; Karl et al., 2005; Eller et al., 2011; Crespo et al., 457
2013) have reported cumulative BVOC emissions from biomass drying and simulated 458
drying/senescence experiments, information about cumulative BVOC emissions from senescent 459
leaves that are still attached to the plant is, to our knowledge, not available in the literature. 460
Moreover, the abovementioned studies are the only available ones which report cumulative 461
emissions in conditions which somehow approximate senescence in real natural conditions. 462
Therefore we will compare the cumulative BVOC emissions from senescent maize leaves over 463
the entire measurement period against the results from those studies (Table 4), which were all 464
performed on different species of the Poaceae family. Overall, BVOC emissions from senescent 465
20
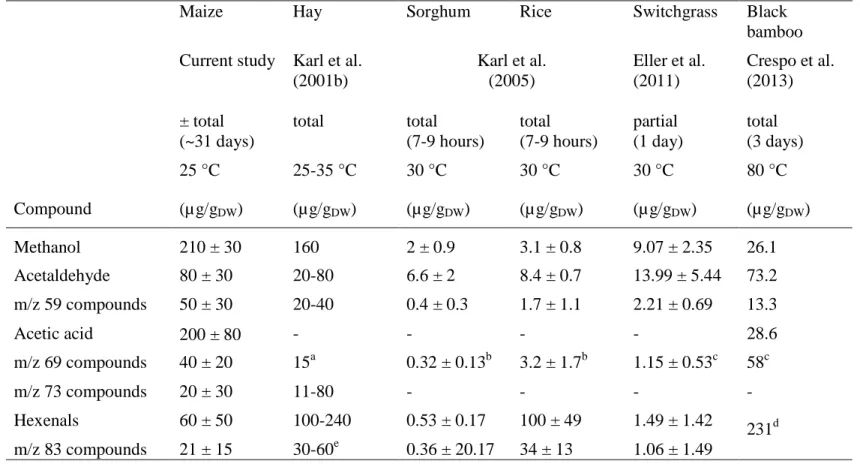
maize leaves are among the highest for the drying/senescent plant species. The cumulative 466
methanol emission from the senescent maize leaves is very similar to that of hay, reported by 467
Karl et al. (2001b). By contrast, cumulative methanol emissions from Sorghum sudanense 468
(sorghum) (Karl et al., 2005), Oryza sativa (rice) (Karl et al., 2005), Panicum virgatum 469
(switchgrass) (Eller et al., 2011), and Phyllostachys nigra (black bamboo) (Crespo et al., 2013) 470
are several orders of magnitude lower than those for maize and hay. Cumulative emissions of 471
acetaldehyde, m/z 59, and m/z 69 compounds from maize are of the same order of magnitude as 472
those from drying hay and black bamboo, and considerably higher than those from sorghum, rice, 473
and switchgrass. Total acetic acid emission from maize is several-fold higher than that of black 474
bamboo, which is the only other species of the Poaceae family for which cumulative acetic acid 475
emissions have been reported (Warneke et al. (1999) also mentioned acetic acid emission from 476
grass, but didn’t report cumulative emissions). Maize, hay, rice, and black bamboo all have 477
higher cumulative GLV emissions than sorghum and switchgrass. 478
This comparison of cumulative BVOC emissions from the different plant species should, 479
however, be taken with caution because of differences in the way they have been determined 480
(from leaves still attached to the plant as in this study or from cutting of biomass, followed by 481
drying in the field or in an oven as in the other studies), in environmental conditions during the 482
experiments, and in the length of the accumulation period (see Table 4). 483
21
Table 4: Comparison of the cumulative BVOC emissions during senescence of maize leaves and drying of hay, Sorghum sudanense 484
(sorghum), Oryza sativa (rice), Panicum virgatum (switchgrass) and Phyllostachys nigra (black bamboo). Also mentioned in the 485
Table are the accumulation period and the temperature at which the experiments were performed. 486
Compound
Maize Hay Sorghum Rice Switchgrass Black
bamboo Current study Karl et al.
(2001b) Karl et al. (2005) Eller et al. (2011) Crespo et al. (2013) ± total (~31 days) total total (7-9 hours) total (7-9 hours) partial (1 day) total (3 days) 25 °C 25-35 °C 30 °C 30 °C 30 °C 80 °C (µ g/gDW) (µg/gDW) (µg/gDW) (µ g/gDW) (µ g/gDW) (µg/gDW) Methanol 210 ± 30 160 2 ± 0.9 3.1 ± 0.8 9.07 ± 2.35 26.1 Acetaldehyde 80 ± 30 20-80 6.6 ± 2 8.4 ± 0.7 13.99 ± 5.44 73.2 m/z 59 compounds 50 ± 30 20-40 0.4 ± 0.3 1.7 ± 1.1 2.21 ± 0.69 13.3 Acetic acid 200 ± 80 - - - - 28.6 m/z 69 compounds 40 ± 20 15a 0.32 ± 0.13b 3.2 ± 1.7b 1.15 ± 0.53c 58c m/z 73 compounds 20 ± 30 11-80 - - - - Hexenals 60 ± 50 100-240 0.53 ± 0.17 100 ± 49 1.49 ± 1.42 231d m/z 83 compounds 21 ± 15 30-60e 0.36 ± 20.17 34 ± 13 1.06 ± 1.49 487 a
pentenol and 2-methyl-butanal; b pentenol and n-pentanal; c pentenol and isoprene; d based on the sum of ion intensities at m/z 57,
488
81, 99, 83, 101, and 103; e hexenols and hexanal
22
3.2 Contribution of leaf senescence to the total BVOC emissions from a
490
maize leaf/plant
491
In order to investigate the relative importance of BVOC emission rates from senescent maize 492
leaves, these emission rates were compared with those of young, semi-mature, and mature maize 493
leaves measured under the same environmental conditions (Table 3). Strong variations in daily 494
emission rates were observed among the different leaf developmental stages for those 495
compounds that could be quantified for the three earliest stages. Methanol was clearly the 496
compound with the highest emission rates for all stages. The highest daily emission rate during 497
the senescence period was about 40% of the average daily emission rate for the young leaves and 498
about a factor of 10 higher than that of semi-mature and mature leaves. The high emission rates 499
for senescent and young leaves with respect to those of the other developmental stages are due to 500
enhanced production of methanol by PME-catalysed demethylation of pectin during cell wall 501
remodelling. Whereas complex diurnal methanol emission profiles were found for the young 502
leaves (Mozaffar et al., 2017), no clear correlation between the methanol emission rate and PPFD 503
could be observed for the senescent leaves either. Maximum daily emission rates for m/z 59 and 504
m/z 73 compounds during senescence were of similar magnitude to the corresponding average 505
daily emission rates for young leaves and about 3-6 times higher than the average daily emission 506
rates for the semi-mature and mature leaves. Daily monoterpene emission rates for young maize 507
leaves were more than ten-fold higher than for semi-mature and mature leaves and emission rates 508
from senescent leaves were below the detection limit. Higher acetone and monoterpene 509
emissions from young leaves have previously been reported in the literature and higher defence 510
requirements for the young leaves (Bracho-Nunez et al, 2011) and lower metabolic activity in 511
mature leaves resulting in low de novo synthesis rates (Aalto et al., 2014) have been proposed as 512
potential reasons. 513
Although the data listed in Table 3 allow a comparison between the maximum daily BVOC 514
emission rates during senescence and the average daily BVOC emission rates measured during 515
relatively short periods for the young, semi-mature, and mature leaves, additional information is 516
required to assess the contributions of the different leaf developmental stages to the total BVOC 517
emissions for an individual leaf in the course of its lifetime. By taking into account the 518
23
experimental daily methanol emission rate data from the young and mature leaves (Mozaffar et 519
al., 2017) and the cumulative methanol emissions from senescent leaves (Table 3), and by using 520
information about the relative leaf area growth rate and the duration of the young-growing 521
(encompassing young and semi-mature) and mature leaf developmental stages, it was possible to 522
estimate the cumulative methanol emissions from a 7th leaf of a maize plant during the young-523
growing, mature and senescent leaf developmental stages. The leaf number again refers to the 524
order of appearance of the leaf on the maize plant. They were 360 ± 30 µ g, 80 ± 30 µ g and 150 ± 525
40 µg, respectively, and the resulting total amount of methanol emitted by a 7th leaf in the course 526
of its lifetime was therefore 590 ± 60 µg. The young-growing, mature and senescent stages 527
consequently contributed 61 ± 3, 13 ± 5 and 26 ± 6% to the total methanol emission from a 7th 528
leaf. Details about the estimation procedure are provided in Supplement S1. 529
Based on the emission rates obtained for a 7th leaf, the total amount of methanol emitted by all 530
leaves of a representative maize plant, grown in the environmental chamber at 25 °C and exposed 531
to the diurnal light pattern described in Section 2.1, has been estimated for the different leaf 532
developmental stages. Values of 4.8 ± 0.4, 0.8 ± 0.5 and 1.9 ± 0.6 mg were obtained for the 533
cumulative methanol emission from all young-growing, mature, and senescent leaves over the 534
entire lifetime of the plant, respectively. The total amount of methanol emitted by the leaves of a 535
whole maize plant from shoot emergence to full senescence was therefore equal to 7.5 ± 0.9 mg 536
and the contributions of the different stages to the total methanol emission were 64 ± 3, 10 ± 8 537
and 26 ± 7%, respectively. The estimation of the total cumulative methanol emission from a 538
whole maize plant over the course of its lifetime should however be considered with caution. As 539
already mentioned it was assumed that all leaves were exposed to the same PPFD and the effect 540
of shading by leaves with a higher leaf number was not taken into account. Moreover, a large 541
variability in the duration of the mature stage was noticed among leaves with different leaf 542
numbers, which may be related to the demands of the plant for nutrient relocation. The total leaf 543
emissions of methanol from a maize plant presented in this work could be used as a first estimate 544
for upscaling to field scale in regions characterised by environmental conditions close to those of 545
the growth chamber. However, a general upscaling from the leaf/plant level to ecosystem level 546
would definitely benefit from methanol emission measurements at different temperatures at all 547
leaf developmental stages. Moreover, uptake of atmospheric methanol by the ecosystem may 548
24
also be important in the field (Laffineur et al., 2012; Wohlfahrt et al., 2015) and should be taken 549
into account. 550
For the other BVOCs emitted by maize leaves, assumptions about the temporal evolution of 551
the emission rates at the different leaf developmental stages are less straightforward than for 552
methanol. Indeed, whereas methanol emission from young leaves has been associated with leaf 553
growth (Hüve et al. 2007), this is not the case for other BVOCs and therefore a simple 554
relationship between the daily emission rate of those compounds and the daily relative leaf area 555
growth rate (eq. S3 in Supplement S1) cannot be put forward. Consequently, an estimation of the 556
relative contribution of the different leaf developmental stages to the total emission from a 7th 557
maize leaf for other BVOCs than methanol- from the emission rate data obtained in this work 558
would have been prone to very large errors and has therefore not been accomplished. The same 559
applies to extrapolation to an entire maize plant. 560
4 Conclusions
561Maize is one of the most cultivated crop species worldwide, but only 5 studies on BVOC 562
exchanges from maize are available in the literature and none of them deal with emissions from 563
senescent leaves. In contrast to most studies on BVOC emissions from artificially senescing 564
leaves (cutting and drying), the senescent maize leaves in our experiments were still attached to 565
the stems. 566
The main emitted compounds, ranked according to their cumulative emissions over the 567
senescence period, were found to be methanol, acetic acid, acetaldehyde, hexenals, m/z 59 568
compounds, m/z 69 compounds, m/z 73 compounds, and m/z 83 compounds. Important 569
differences were observed in the temporal emission profiles of these compounds. Whereas 570
methanol, acetaldehyde, and GLVs (hexenals and m/z 83 compounds) were emitted mainly 571
during the degeneration phase of leaf senescence, m/z 59 compounds and acetic acid emission 572
rates increased at the end of that phase and their emissions remained high during the termination 573
phase, even when the leaves were already completely dry. Beside m/z 59 compounds and acetic 574
acid, the rest of the abovementioned compounds were also emitted in small but significant 575
amounts from dry leaves during the termination phase. Therefore, not only the yellow senescent 576
maize leaves but also the dry brown leaves, which remain attached to the plant, are an important 577
25
source of BVOCs. By comparing cumulative BVOC emissions from senescent maize leaves with 578
those of artificially senescing species of the Poaceae family, it was found that maize leaves were 579
clearly among the strongest emitting species during that leaf developmental stage. Nevertheless, 580
an improved comparison of cumulative BVOC emissions among senescent species of the 581
Poaceae family might benefit from additional measurements on naturally senescing plants instead 582
of results obtained from cutting and drying experiments. 583
Whereas senescent leaves showed a large diversity of emitted compounds, BVOC emission 584
rates for young, semi-mature, and mature leaves were limited to methanol, m/z 59 and m/z 73 585
compounds, and monoterpenes. Methanol was clearly the highest emitted compound for all 586
stages and showed a strong variation in intensity and diurnal emission patterns among the 587
different leaf developmental stages. The contributions from the young-growing, mature, and 588
senescent stages to the total methanol emission from a typical leaf of a maize plant were 589
estimated to be 61, 13, and 26%, respectively. 590
Although our growth chamber study provided new information on the contribution of 591
senescence and other leaf developmental stages to the BVOC emissions from maize, additional 592
studies, preferably in field conditions and at a wide variety of meteorological conditions, are 593
definitely required to better constrain BVOC emissions for this important C4 crop species for use 594
in regional and global atmospheric chemistry and climate models. 595
Acknowledgements
596We gratefully acknowledge the financial support provided by FNRS (Fonds National de la 597
Recherche Scientifique) for funding the CROSTVOC research project (T.0086.13), in the 598
framework of which this study was carried out. We are also very grateful for the indispensable 599
technical support provided by the employees of the Belgian Institute for Space Aeronomy and 600
the University of Liège, Gembloux Agro-Bio Tech. 601
26
602
References
603 604Atkinson, R.: Atmospheric chemistry of VOCs and NOx, Atmospheric Environment, 34(12-14), 605
2063–2101, doi: 10.1016/S1352-2310(99)00460-4, 2000. 606
Aalto, J., Kolari, P., Hari, P., Kerminen, V.-M., Schiestl-Aalto, P., Aaltonen, H., Levula, J., 607
Siivola, E., Kulmala, M. and Bäck, J.: New foliage growth is a significant, unaccounted 608
source for volatiles in boreal evergreen forests, Biogeosciences, 11, 1331-1344, 609
doi:10.5194/bg-11-1331-2014, 2014. 610
Bachy, A., Aubinet, M., Schoon, N., Amelynck, C., Bodson, B., Moureaux, C. and Heinesch, B.: 611
Are BVOC exchanges in agricultural ecosystems overestimated? Insights from fluxes 612
measured in a maize field over a whole growing season, Atmospheric Chemistry and 613
Physics, 16, 5343-5356, doi: 10.5194/acp-16-5434-2016, 2016. 614
Bracho-Nunez, A., Welter, S., Staudt, M. and Kesselmeier, J.: Plant-specific volatile organic 615
compound emission rates from young and mature leaves of Mediterranean vegetation, 616
Journal of Geophysical Research, 116(D16), doi: 10.1029/2010JD015521, 2011. 617
Castaldo, D., Laratta, B., Loiudice, R., Giovane, A., Quagliuolo, L., and Servillo, L.: Presence of 618
residual pectin methylesterase activity in thermally stabilized industrial fruit preparations, 619
LWT - Food Science and Technology, 30, 479–484, doi: 10.1006/fstl.1996.0211, 1997. 620
Crespo, E., Graus, M., Gilman, J. B., Lerner, B. M., Fall, R., Harren, F. J. M. and Warneke, C.: 621
Volatile organic compound emissions from elephant grass and bamboo cultivars used as 622
potential bioethanol crop, Atmospheric Environment, 65, 61-68, doi: 623
10.1016/j.atmosenv.2012.10.009, 2013. 624
Das, M., Kang, D., Aneja, V.P., Lonneman, W., Cook, D.R. and Wesely, M.L.: Measurements of 625
hydrocarbon air–surface exchange rates over maize, Atmospheric Environment 37(16), 626
2269-2277, doi: 10.1016/S1352-2310(03)00076-1, 2003. 627
27
de Gouw, J. D., Howard, C. J., Custer, T. G. and Fall, R.: Emissions of volatile organic 628
compounds from cut grass and clover are enhanced during the drying process, Geophysical 629
Research Letters, 26(7), 811-814, doi: 10.1029/1999GL900076, 1999. 630
de Gouw, J. D., Howard, C. J., Custer, T. G., Baker, B. M. and Fall, R.: Proton-Transfer 631
Chemical-Ionization Mass Spectrometry allows real-time analysis of volatile organic 632
compounds released from cutting and drying of crops, Environmental Science & 633
Technology, 34(12), 2640-2648, doi: 10.1021/es991219k, 2000. 634
Eller, A.S.D., Sekimoto, K., Gilman, J.B., Kuster, W.C., de Gouw, J.A., Monson, R.K., Graus, 635
M., Crespo, E., Warneke, C. and Fall. R.: Volatile organic compound emissions from 636
switchgrass cultivars used as biofuel crops, Atmospheric Environment 45 (19), 3333-3337, 637
doi: 10.1016/j.atmosenv.2011.03.042, 2011. 638
Ellis, A. M. and Mayhew, C. A.: Proton transfer reaction mass spectrometry: principles and 639
applications, Wiley, Chichester, 2013. 640
Fechter, J.-O., Englund, F. and Lundin, A.: Association between temperature, relative humidity 641
and concentration of volatile organic compounds from wooden furniture in a model room, 642
Wood Material Science and Engineering 1 (2), 69-75, doi: 10.1080/17480270600900551, 643
2006. 644
Fall, R.: Abundant oxygenates in the atmosphere: a biochemical perspective, Chemical Reviews, 645
103(12), 4941-4952, doi: 10.1021/cr0206521, 2003. 646
Fall, R. and Benson, A.A.: Leaf methanol - the simplest natural product from plants, Trends in 647
Plant Science, 1, 296-301, doi: 10.1016/S1360-1385(96)88175-0, 1996. 648
Fall, R., Karl, T., Hansel, A., Jordan, A. and Lindinger, W.: Volatile organic compounds emitted 649
after leaf wounding: On-line analysis by proton-transfer-reaction mass spectrometry, 650
Journal of Geophysical Research: Atmospheres, 104(D13), 15963–15974, doi: 651
10.1029/1999JD900144, 1999. 652
Fall, R., Karl, T., Jordan, A. and Lindinger, W.: Biogenic C5 VOCs: release from leaves after 653
freeze–thaw wounding and occurrence in air at a high mountain observatory, Atmospheric 654
Environment, 35(22), 3905-3916, doi: 10.1016/S1352-2310(01)00141-8, 2001. 655
28
Folkers, A., Hüve, K., Ammann, C., Dindorf, T., Kesselmeier, J., Kleist, E., Kuhn, U., Uerlings, 656
R. and Wildt, J.: Methanol emissions from deciduous tree species: dependence on 657
temperature and light intensity, Plant Biology, 10, 65-75, doi: 10.1111/j.1438-658
8677.2007.00012.x, 2008. 659
Galbally, I. E. and Kirstine, W.: The production of methanol by flowering plants and the global 660
cycle of methanol, Journal of Atmospheric Chemistry, 43, 195-229, doi: 661
10.1023/A:1020684815474, 2002. 662
Gan, S. and Amasino, R. M.: Making sense of senescence (molecular genetic regulation and 663
manipulation of leaf senescence), Plant Physiology, 113(2), 313-319, 1997. 664
Graus, M., Eller, A., Fall, R., Yuan, B., Qian, Y., Westra, P., de Gouw, J. and Warneke, C.: 665
Biosphere-atmosphere exchange of volatile organic compounds over C4 biofuel crops, 666
Atmospheric Environment, 66, 161-168, doi: 10.1016/j.atmosenv.2011.12.042, 2013. 667
Guenther, A. B., Jiang, X., Heald, C., Sakulyanontvittaya, T., Duhl, T., Emmons, L. K. and 668
Wang, X., The Model of Emissions of Gases and Aerosols from Nature version 2.1 669
(MEGAN 2.1): an extended and updated framework for modelling biogenic emissions, 670
Geoscientific Model Development, 5, 1471-1492, doi: 10.5194/gmd-5-1471-2012, 2012. 671
Harley, P., Greenberg, J., Niinemets, Ü. and Guenther, A.: Environmental controls over methanol 672
emission from leaves, Biogeosciences, 4, 1083-1099, doi: 10.5194/bg-4-1083-2007, 2007. 673
Hatanaka, A.: The biogeneration of green odour by green leaves, Phytochemistry, 34, 1201-1218, 674
doi: 10.1016/0031-9422(91)80003-J, 1993. 675
Holopainen, J. K., Heijari, J., Oksanen, E. and Alessio, G. A.: Leaf volatile emissions of betula 676
pendula during autumn coloration and leaf fall. Journal of Chemical Ecology, 36(10), 677
1068-1075, doi: 10.1007/s10886-010-9857-4, 2010. 678
Holopainen, J. K., and Gershenzon, J., Multiple stress factors and the emission of plant VOCs, 679
Trends in Plant Science, 15, 176-184, doi: 10.1016/j.tplants.2010.01.006, 2010. 680
Hüve, K., Christ, M. M., Kleist, E., Uerlings, R., Niinemets, U., Walter, A. and Wildt, J.: 681
Simultaneous growth and emission measurements demonstrate an interactive control of 682
29
methanol release by leaf expansion and stomata, Journal of Experimental Botany, 58, 683
1783-1793,doi: 10.1093/jxb/erm038, 2007. 684
Ikan, R., Rubinszialn, Y., Nissenbaum, A. and Kaplan, I. R.: The maillard reaction: 685
consequences for the chemical and life sciences, edited by Ikan, R., 1-25, John Wiley, New 686
York, 1996. 687
Inomata, S. and Tanimoto, H.: A quantitative examination of the detection sensitivities of proton-688
transfer reaction mass spectrometry for gaseous 2-propanol and acetic acid, Bulletin of the 689
Chemical Society of Japan, 83, 900–904, doi: 10.1246/bcsj.20100043, 2010. 690
Jardine, K., Karl, T., Lerdau, M., Harley, P., Guenther, A., and Mak, J.E.: Carbon isotope 691
analysis of acetaldehyde emitted from leaves following mechanical stress and anoxia, Plant 692
Biology, 11(4), 591-597, doi: 10.1111/j.1438-8677.2008.00155.x, 2009. 693
Karl, T., Fall, R., Jordan, A. and Lindinger, W.: On-line analysis of reactive VOCs from urban 694
lawn mowing, Environmental Science & Technology, 35(14), 2926-2931, doi: 695
10.1021/es010637y, 2001a. 696
Karl, T., Guenther, A., Jordan, A., Fall, R. and Lindinger, W.: Eddy covariance measurement of 697
biogenic oxygenated VOC emissions from hay harvesting, Atmospheric Environment, 35, 698
491-495, doi: 10.1016/S1352-2310(00)00405-2, 2001b. 699
Karl, T., Guenther, A., Lindinger, C., Jordan, A., Fall, R. and Lindinger, W.: Eddy covariance 700
measurements of oxygenated volatile organic compound fluxes from crop harvesting using 701
a redesigned proton-transfer-reaction mass spectrometer, Journal of Geophysical Research: 702
Atmospheres, 106(D20), 24157-24167, 2001c. 703
Karl, T., Harren, F., Warneke, C., Gouw, J. D., Grayless, C. and Fall, R.: Senescing grass crops 704
as regional sources of reactive volatile organic compounds. Journal of Geophysical 705
Research, 110(D15), doi: 10.1029/2005JD005777, 2005. 706
Keskitalo, J., Bergquist, G., Gardeström, P. and Jansson, S.: A cellular timetable of autumn 707
senescence, Plant Physiology, 139(4), 1635-1648, doi: 10.1104/pp.105.066845, 2005. 708
Kesselmeier, J., Bode, K., Gerlach, C., and Hork, E.-M.: Exchange of atmospheric formic and 709
acetic acids with trees and crop plants under controlled chamber and purified air 710