https://doi.org/10.5194/acp-18-13881-2018 © Author(s) 2018. This work is distributed under the Creative Commons Attribution 4.0 License.
Atmospheric CO and CH
4
time series and seasonal variations on
Reunion Island from ground-based in situ and FTIR
(NDACC and TCCON) measurements
Minqiang Zhou1, Bavo Langerock1, Corinne Vigouroux1, Mahesh Kumar Sha1, Michel Ramonet2, Marc Delmotte2, Emmanuel Mahieu3, Whitney Bader3, Christian Hermans1, Nicolas Kumps1, Jean-Marc Metzger4, Valentin Duflot5,4, Zhiting Wang6,7, Mathias Palm6, and Martine De Mazière1
1Royal Belgian Institute for Space Aeronomy (BIRA-IASB), Brussels, Belgium
2Laboratoire des Sciences du Climat et de l’Environnement (LSCE/IPSL), UMR CEA-CNRS-UVSQ,
Gif-sur-Yvette, France
3Institut d’Astrophysique et de Géophysique, Université de Liège, Liège, Belgium 4UMS 3365 – OSU Réunion, Université de La Réunion, Saint-Denis, Réunion, France
5Laboratoire de l’Atmosphère et des Cyclones (LACy), UMR8105, Saint-Denis, Réunion, France 6Institute of Environmental Physics, University of Bremen, Bremen, Germany
7College of Atmospheric Science, Lanzhou University, Lanzhou 730000, China
Correspondence: Minqiang Zhou ([email protected]) Received: 28 February 2018 – Discussion started: 17 May 2018
Revised: 27 August 2018 – Accepted: 11 September 2018 – Published: 1 October 2018
Abstract. Atmospheric carbon monoxide (CO) and methane (CH4) mole fractions are measured by ground-based in
situ cavity ring-down spectroscopy (CRDS) analyzers and Fourier transform infrared (FTIR) spectrometers at two sites (St Denis and Maïdo) on Reunion Island (21◦S, 55◦E) in
the Indian Ocean. Currently, the FTIR Bruker IFS 125HR at St Denis records the direct solar spectra in the near-infrared range, contributing to the Total Carbon Column Observing Network (TCCON). The FTIR Bruker IFS 125HR at Maïdo records the direct solar spectra in the mid-infrared (MIR) range, contributing to the Network for the Detection of At-mospheric Composition Change (NDACC). In order to un-derstand the atmospheric CO and CH4variability on Reunion
Island, the time series and seasonal cycles of CO and CH4
from in situ and FTIR (NDACC and TCCON) measurements are analyzed. Meanwhile, the difference between the in situ and FTIR measurements are discussed.
The CO seasonal cycles observed from the in situ mea-surements at Maïdo and FTIR retrievals at both St Denis and Maïdo are in good agreement with a peak in September– November, primarily driven by the emissions from biomass burning in Africa and South America. The dry-air column averaged mole fraction of CO (XCO) derived from the FTIR
MIR spectra (NDACC) is about 15.7 ppb larger than the CO mole fraction near the surface at Maïdo, because the air in the lower troposphere mainly comes from the Indian Ocean while the air in the middle and upper troposphere mainly comes from Africa and South America. The trend for CO on Reunion Island is unclear during the 2011–2017 period, and more data need to be collected to get a robust result.
A very good agreement is observed in the tropospheric and stratospheric CH4 seasonal cycles between FTIR (NDACC
and TCCON) measurements, and in situ and the Michelson Interferometer for Passive Atmospheric Sounding (MIPAS) satellite measurements, respectively. In the troposphere, the CH4mole fraction is high in August–September and low in
December–January, which is due to the OH seasonal varia-tion. In the stratosphere, the CH4mole fraction has its
max-imum in March–April and its minmax-imum in August–October, which is dominated by vertical transport. In addition, the different CH4 mole fractions between the in situ, NDACC
and TCCON CH4measurements in the troposphere are
dis-cussed, and all measurements are in good agreement with the GEOS-Chem model simulation. The trend of XCH4 is
7.6 ± 0.4 ppb yr−1from the TCCON measurements over the 2011 to 2017 time period, which is consistent with the CH4
mospheric chemistry, especially as it reacts with hydroxyl radicals (OH) that affect the carbon and the methane (CH4)
cycles (Rasmussen and Khalil, 1981) and take part in the formation of many other polluting gases, e.g., tropospheric ozone and urban smog (Aschi and Largo, 2003). CH4is the
second most important anthropogenic greenhouse gas after carbon dioxide (CO2), with a global warming potential about
28 times greater than CO2 over a 100-year time horizon.
About 17 % of the total increase in radiative forcing between 1750 and 2010 related to the long-lived greenhouse gases in the atmosphere is caused by CH4(IPCC, 2013). In addition,
CH4also reacts with OH, affecting the atmospheric oxidizing
capacity. CH4is well-mixed in the lower atmosphere with a
life time of 8–10 years (Kirschke et al., 2013).
In recent decades, CH4 growth rates in the atmosphere
have been variable. The CH4concentration increased in the
1990s at a rate of 0.7 % yr−1, it was then relatively stable in the first half of the 2000s, and then started increasing again after 2007 (Rigby et al., 2008). The CO concentration in-creased from the 1950s and then started to decrease in the late 1980s (Novelli, 2003). The importance of CO and CH4in our
changing atmosphere motivates continuous and long-term time series of precise and accurate measurements of these species. Several kinds of measurement techniques have been used to monitor the CO and CH4mole fractions in the
atmo-sphere, e.g., ground-based in situ or sampling measurements (Vermeulen et al., 2011; Lopez et al., 2015), ground-based Fourier transform infrared (FTIR) spectrometer observations (Sussmann et al., 2012; Té et al., 2016), and space-based satellite measurements such as the Michelson Interferometer for Passive Atmospheric Sounding (MIPAS), the Greenhouse gases Observing SATellite (GOSAT) and the Measurement Of Pollution In The Troposphere (MOPITT) (von Clarmann et al., 2003; Yokota et al., 2009; Deeter et al., 2014). In addi-tion to providing useful means for trend determinaaddi-tion, such measurements allow the verification of atmospheric models for air pollution and climate change, e.g., Té et al. (2016) used ground-based in situ and FTIR measurements as well as GEOS-Chem simulations to explain the seasonal variabil-ity of atmospheric CO, and Bader et al. (2017) used FTIR measurements and the GEOS-Chem model to investigate the
dataset. In situ instruments monitor gas mole fractions near the surface, while FTIR retrievals report information on the distribution of the gas abundance with altitude. The represen-tativeness of both measurements depends on the location of the site, the air transport and the lifetime of the target species (Folini et al., 2009; Dils et al., 2011; Sepúlveda et al., 2014). In addition, the representativeness of FTIR retrievals, and their vertical sensitivity is also related to the spectral range and retrieval strategy, which has to be taken into account when comparing the Total Carbon Column Observing Net-work (TCCON) and the Detection of Atmospheric Compo-sition Change (NDACC) data (Ostler et al., 2014; Kiel et al., 2016).
The objective of this paper is to study the atmospheric CO and CH4time series and seasonal variations on Reunion
Island based on the in situ and FTIR measurements from two sites: Saint Denis (St Denis) and Maïdo. The different ground-based in situ and FTIR techniques (NDACC and TC-CON) are used to show their complementarity with regards to obtaining the CO and CH4abundances at the surface and
in the troposphere and stratosphere. Section 2 introduces the datasets at the two sites. The measurement uncertainty and characterization of the various datasets are also presented. In the next section, the time series and seasonal cycles of CO and CH4 from the in situ measurements at the surface and
FTIR column retrievals are analyzed. In addition, intercom-parisons between colocated daily means of the in situ and FTIR measurements are carried out. In Sect. 4, the differ-ences of CO and CH4 between the in situ and FTIR
mea-surements are discussed using the vertical information from the FTIR data which allows tropospheric columns to be de-rived, and by providing GEOS-Chem model comparisons for CH4 in the troposphere. Furthermore, in Sect. 4, the FTIR
CH4stratospheric columns are compared with MIPAS
satel-lite data. Finally, conclusions are drawn in Sect. 5.
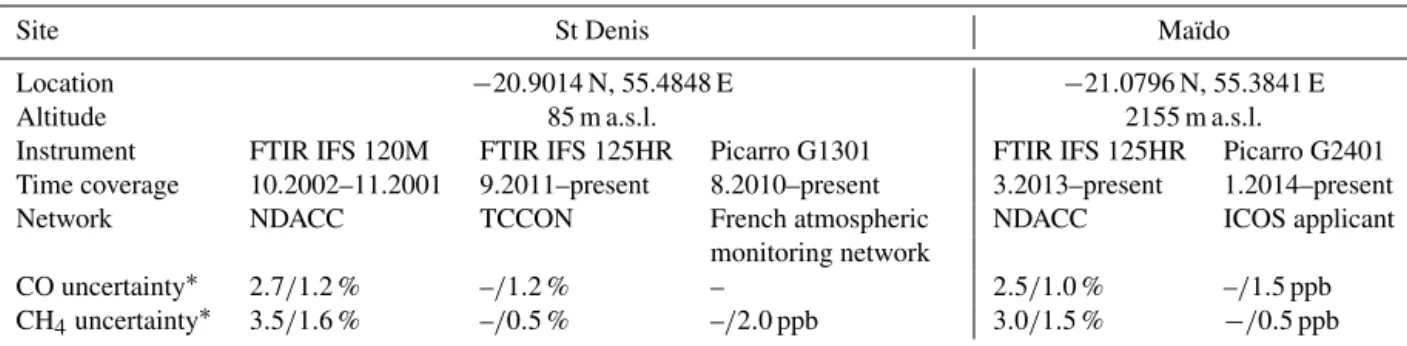
2 Measurements on Reunion Island
There are two sites on Reunion Island: St Denis (−20.9014◦N, 55.4848◦E; 85 m a.s.l. above sea level) which
is close to the coast, and Maïdo (−21.0796◦N, 55.3841◦E; 2155 m a.s.l.) which is close to the top of the mountain ridge. Table 1 lists all of the available CO and CH4measurements
from these two sites, in addition to their measurement uncer-tainties. Currently, each site is operated with a FTIR instru-ment and an in situ cavity ring-down spectroscopy (CRDS) analyzer. In this section, we give a brief historic overview of the in situ and the FTIR measurements on Reunion Island. 2.1 In situ measurements
The Royal Belgian Institute for Space Aeronomy (BIRA-IASB) in collaboration with the Laboratoire de l’Atmosphére et des Cyclones (LACy), the Observatoire des Sciences de l’Univers de la Réunion (OSU-R) and the Laboratoire des Sciences du Climat et de l’Environnement (LSCE), has been performing in situ surface measurements on Reunion Island. The CH4mole fraction has been measured by a CRDS
ana-lyzer (Picarro G1301) at St Denis since August 2010, and CO and the CH4mole fractions have been collected by another
CRDS analyzer (Picarro G2401) at Maïdo since December 2014. The latter installation will be proposed for a certifi-cation (to be certified for standardized data production) in the European research infrastructure Integrated Carbon Ob-servation System (ICOS-ERIC) as a French-Belgian station in late 2018. The St Denis coastal site has been developed within the French national monitoring network. The two sta-tions have been set up in a similar way, taking the techni-cal specifications recommended by ICOS into account (Lau-rent, 2016). Both CRDS analyzers are calibrated every 3 to 4 weeks with a suite of four cylinders that have concentra-tions spanning the atmospheric ranges of CH4and CO, and
have been calibrated at LSCE with NOAA reference tanks. All values are expressed in WMO reference scales (X2004A and X2014A for CH4 and CO, respectively). In addition,
these tanks are used to calculate the continuous monitoring repeatability (CMR) and the long-term repeatability (LTR) as defined by Yver Kwok et al. (2015). The air is sampled through a 1/400tube (“Synflex 3000”) at the top of the build-ing, and goes through a 2 µm filter, and a multi-position valve before being analyzed by the CRDS analyzer. The pump is always located downstream of the analyzer. Raw data are transferred to the LSCE server every night, and are processed according to the ICOS specifications (Hazan et al., 2016). The in situ measurements at the two surface sites are carried out in wet conditions without any dryer in the sampling line. The correction of the dry air mole fractions is carried out us-ing the H2O measurements performed by the same analyzers
(Rella et al., 2013). 2.2 FTIR instruments
In 2002 (October) and 2004 (August to November), BIRA-IASB carried out two atmospheric monitoring experiments using a mobile Bruker IFS 120M FTIR equipped with indium
antimonide (InSb) and mercury cadmium telluride (MCT) detectors at St Denis on the campus of the Université de La Réunion (Senten et al., 2008). The same instrument was operated at St Denis to provide continuous measurements between June 2009 and November 2011 (Vigouroux et al., 2012; Zhou et al., 2016). The instrument recorded the so-lar spectra in the mid-infrared (MIR) range from 600 to 4500 cm−1, contributing to the NDACC network.
In September 2011, BIRA-IASB installed a high-resolution Bruker IFS 125HR FTIR at St Denis next to the FTIR 120M. This instrument is primarily dedicated to mea-suring the near-infrared (NIR: 4000–16 000 cm−1) spectra, with silicon (Si) and indium gallium arsenide (InGaAs) de-tectors, and contributes to TCCON.
In March 2013, BIRA-IASB started operating a second Bruker IFS 125HR FTIR spectrometer, observing the MIR spectra with MCT and InSb detectors at the Maïdo observa-tory (Baray et al., 2013). These FTIR measurements are also affiliated with NDACC.
2.3 FTIR retrieval techniques
The optimal estimation method (Rodgers, 2000) is applied to retrieve the gas mole fractions from the FTIR solar spectra. The retrieval strategies are determined by the spectral range and the network (see Table 2).
2.3.1 TCCON
The TCCON (NIR) spectra at St Denis are analyzed using the GGG2014 algorithm to retrieve CO and CH4total columns
(De Maziere et al., 2017). The details of the TCCON re-trieval settings were described in Wunch et al. (2015). Note that GGG2014 applies a profile scaling; therefore, TCCON only provides a total column instead of a vertical profile. The daily a priori profiles are generated by a stand alone tool based on in situ and aircraft measurements (Toon and Wunch, 2014). Figure 1 shows the a priori profiles of CO and CH4 at St Denis on four days in 2013. TCCON CO
and CH4 retrieved products have been calibrated and
vali-dated by Infrastructure for the Measurement of the Europe Carbon Cycle (IMECC) profiles over the European TCCON stations (Messerschmidt et al., 2011) and HIAPER Pole-to-Pole Observations (HIPPO) profiles over Northern America, East Asia and Oceania (Wunch et al., 2010); the calibration factors (CO: 1.067 ± 0.020; CH4: 0.977 ± 0.002) are found
to be robust both over time and from site to site (Wunch et al., 2015). The data in this study have all been corrected by applying these calibration factors. Therefore, it is assumed that there are no systematic uncertainties for the TCCON re-trievals, and only random uncertainties are listed in Table 1.
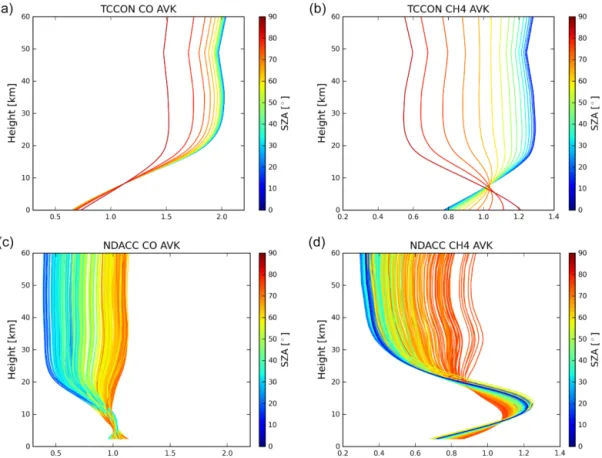
Figure 2 shows the column averaging kernels (AVK) of TCCON CO and CH4retrievals for different solar zenith
an-gles (SZAs). At St Denis, the SZA is mainly in the range from 20 to 70◦. The AVK represents the sensitivity of the
Table 2. NDACC and TCCON CO and CH4retrieval strategies for data recorded on Reunion Island.
Species CO CH4
Network TCCON NDACC TCCON NDACC
Algorithm GGG2014 SFIT4 GGG2014 SFIT4
Retrieval windows (cm−1) 4208.7–4257.3 4262.0–4318.8 2057.7–2058.0 2069.56–2069.76 2157.5–2159.15 5872.0–5988.0 5996.45–6007.55 6007.0–6145.0 2611.6–2613.35 2613.7–2615.4 2835.55–2835.8 2903.82–2903.925 2941.51–2942.22
Interfering species CH4, H2O and HDO O3, N2O,
H2O, OCS and CO2
CO2, H2O and N2O, H2O, HDO, CO2and NO2
Spectroscopy ATM ATM ATM DLR H2O, ATM
A priori profile TCCON tool (daily) WACCM v4 (fixed) TCCON tool (daily) WACCM v4 (fixed)
Retrieval constraint Scaling of a priori
profile Optimal estimation DOF = 2.0 ± 0.2 (St Denis) DOF = 2.3 ± 0.2 (Maïdo) Scaling of a priori profile Optimal estimation DOF = 2.1 ± 0.2 (St Denis) DOF = 2.5 ± 0.3 (Maïdo)
Products Total column Profile Total column Profile
retrieved total column to the true partial column profile. Ide-ally, the AVK should be 1.0 at all altitudes, meaning that the retrieved total column is the same as the true column, with a perfect sensitivity to the whole atmosphere. However, in re-ality, the AVK is not always equal to 1.0. If the value is larger than 1.0 at an altitude, it means that the retrieved total column overestimates the contribution from that particular layer in the total column budget, and vice versa. As a result, the TC-CON retrieved CO total column underestimates a deviation from the a priori in the lower troposphere, and overestimates it at high altitudes. The TCCON retrieved CH4total column
is more sensitive to the whole troposphere and stratosphere. 2.3.2 NDACC
The NDACC (MIR) spectra at St Denis and Maïdo are an-alyzed with the SFIT4 algorithm, an evolution of SFIT2 (Pougatchev et al., 1995), to retrieve the profiles of CO and CH4. The H2O a priori profile is extracted from the National
Centers for Environmental Prediction (NCEP) 6-hourly re-analysis data, and a priori profiles of other species are derived from the Whole Atmosphere Community Climate Model (WACCM) version 4 (see Fig. 1). In order to reduce the in-fluence from the interfering species, profiles of O3and N2O
and columns of H2O, OCS and CO2are simultaneously
re-trieved in addition to the CO profile (see Table 2). Profiles of H2O and HDO, and columns of CO2and NO2are
simulta-neously retrieved in addition to the CH4profile. The retrieval
uncertainty of NDACC retrievals at Maïdo is slightly lower than that at St Denis, due to the higher signal-to-noise-Ratio (SNR) of the FTIR 125HR compared to the FTIR 120M. In addition, the H2O at Maïdo is less significant than that at St
Denis due to the higher altitude, which is an important in-terfering species for CO and CH4 retrievals. The NDACC
retrievals are performed using the same atmospheric line list (ATM) (Toon, 2014) used by TCCON with the exception of the H2O line list. The latest H2O line list (Birk et al., 2017;
Figure 1. The a priori profiles used for TCCON measurements on 20130201 (year, month and day), 20130501, 20130801, 20131101 and NDACC measurements for CO (a) and CH4(b). Note that NDACC uses a fixed a priori profile from WACCM model for all retrievals.
Figure 2. The top panels are the column averaging kernels of TCCON CO (a) and CH4(b) retrievals; the lower panels are the column averaging kernels of NDACC CO (c) and CH4(d) retrievals. All averaging kernels vary with the solar zenith angle (SZA). Note that the ranges of the x axes for CO and CH4are different.
Loos et al., 2017a, b) provided by the German Aerospace Center (DLR) in 2016 is adopted for NDACC CH4retrievals,
which allows us to get a better spectral fitting.
The AVK for NDACC CO and CH4retrievals are shown in
Fig. 2. Similar to TCCON, NDACC CO and CH4AVK vary
with SZA. NDACC CO retrievals have a good sensitivity to the whole troposphere and lower stratosphere. For CH4, the
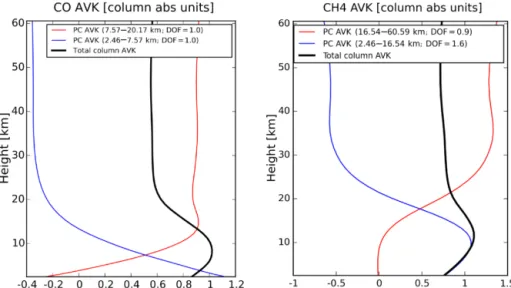
total column is sensitive to the whole troposphere and strato-sphere. Apart from the total column, NDACC provides some profile information of CO and CH4. Figure 3 shows a
typi-Figure 3. The total column averaging kernel (black) and the partial column averaging kernels of two individual layers (CO: surface–8 km and 8–20 km; CH4: surface–16 km and 16–60 km) of one typical NDACC retrieval at Maïdo.
cal AVK of CO and CH4 NDACC retrievals at Maïdo. The
averaged degrees of freedom for the signal (DOFs) of CO is 2.0 ± 0.2 (1σ ) at St Denis and 2.3 ± 0.2 (1σ ) at Maïdo, indicating that there are two individual layers of informa-tion (surface–8 km and 8–20 km) with the first layer having a strong sensitivity to the boundary layer. For CH4, the
aver-aged DOFs of CH4is 2.1±0.2 (1σ ) at St Denis and 2.5±0.3
(1σ ) at Maïdo, indicating that there are also two individual layers of information (about surface–16 km and 16–60 km).
3 Comparison between the ground-based in situ and the FTIR total column measurements
3.1 Methodology
In this section, we compare the CO and CH4 dry air
vol-ume mixing ratio (VMR) observed by in situ measurements at the surface, with the dry-air column-averaged mole frac-tions (Xgas) of FTIR (NDACC and TCCON) retrievals. For
TCCON products, the O2total column is simultaneously
re-trieved with the target species. Since atmospheric O2 mole
fractions are considered stable with a VMR of 0.2095, the Xgasis calculated using the ratio between the total column of
target species (TCgas) and O2(TCO2):
Xgas=0.2095 TCgas/TCO2. (1)
The advantage of dividing by O2abundance is that it reduces
the systematic uncertainties from the parameters, which have a similar effect on the retrievals of both species, e.g., instru-ment line shape (ILS) and the SZA (Yang et al., 2002). For NDACC spectra, there are no N2or O2absorption windows
that allow a sufficient accuracy of abundance to be achieved. Therefore, we use the dry-air total column (TCdryair) to
calcu-late the Xgas:
Xgas= TCgas TCdryair , (2) TCdryair = Ps gmdryair −TCH2O(mH2O/m dry air), (3)
where Ps is the surface pressure; g is the column-averaged
gravitational acceleration; mH2O and m
dry
air are the
molecu-lar mass of H2O and dry air, respectively; and TCH2O is the
total column of H2O from NCEP reanalysis data. The
sur-face pressures at St Denis and Maïdo are recorded by Vaisala PTB210 sensors, with an accuracy better than 0.1 hPa. The systematic uncertainty of H2O in the troposphere is about
5 %, and the TCH2O on Reunion Island is about 0.5 %–2 %
of the TCair. Consequently, the uncertainty of the TCdryair is
less than 0.1 %.
A regression model is applied to derive the trends of CO and CH4, which has been described in Zhou et al. (2018):
Y (t) = A0+A1·t + 3 X k=1 (A2kcos(2kπ t ) +A2k+1sin(2kπ t )) + ε(t ), (4)
where A0is the intercept, A1is the annual growth rate, A2
to A7are the periodic variations, ε(t ) is the residual between
the measurements and the fitting model, and Y (t ) is measure-ments with the t in fraction of year. After that, the detrended monthly means of the measurements are applied to obtain the seasonal variation, and the uncertainty (2σ/√n; σ and n are the standard deviation and the number of the measurements for each month).
For more quantitative comparisons, we also use the colo-cated daily means from the in situ and FTIR measurements at
each site (St Denis: CH4; Maïdo: CO and CH4). Note that the
FTIR instrument measures direct sunlight, and it depends on clear sky conditions. Therefore, we filter the in situ measure-ments to daytime measuremeasure-ments (06:00–18:00 local time) to reduce the impact of the diurnal variation.
3.2 CO
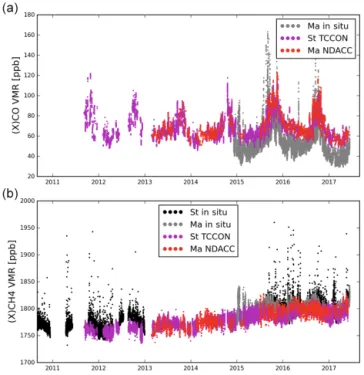
The time series and seasonal cycle of CO from the in situ and FTIR measurements are shown in Figs. 4–5. For each dataset, we use all the available data to get a robust detrended time series and then to obtain the seasonal cycle. Figure 4 shows that the TCCON XCO at St Denis is in good
agree-ment with the NDACC XCOat Maïdo, while the in situ CO
observations at Maïdo are generally lower than the FTIR measurements with the exception of few higher peaks. There is no distinct XCO trend derived from both FTIR datasets
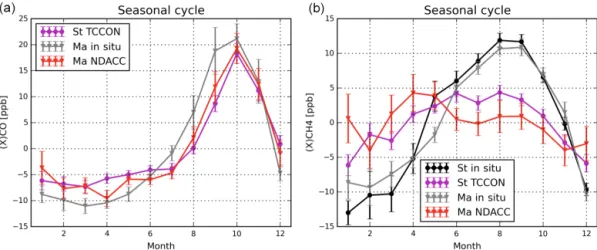
(TCCON: −0.09 ± 1.1 ppb yr−1(2σ ) for the 2011–2017 pe-riod; NDACC: −1.16 ± 2.08 ppb yr−1for 2013–2017), while a slight decreasing trend (−4.66 ± 3.16 ppb yr−1) is derived from the in situ measurements for the 2015–2017 period. The large uncertainty of the decreasing trend is due to the limited time coverage (about 2.5 years), and the signal may be due to year-to-year variability. More data need to be collected to investigate the trend of CO on Reunion Island. Figure 5 shows that the seasonal cycles of CO from the in situ and FTIR measurements are very similar with the maximum in September–November and the minimum in February–April. The peak-to-peak amplitudes from NDACC and TCCON re-trievals are very close (∼ 25–28 ppb), and slightly weaker than that from the in situ measurements (∼ 32 ppb). The high value corresponds to the period when the island is downwind of emissions coming from biomass burning in Africa and South America (Duflot et al., 2010; Vigouroux et al., 2012).
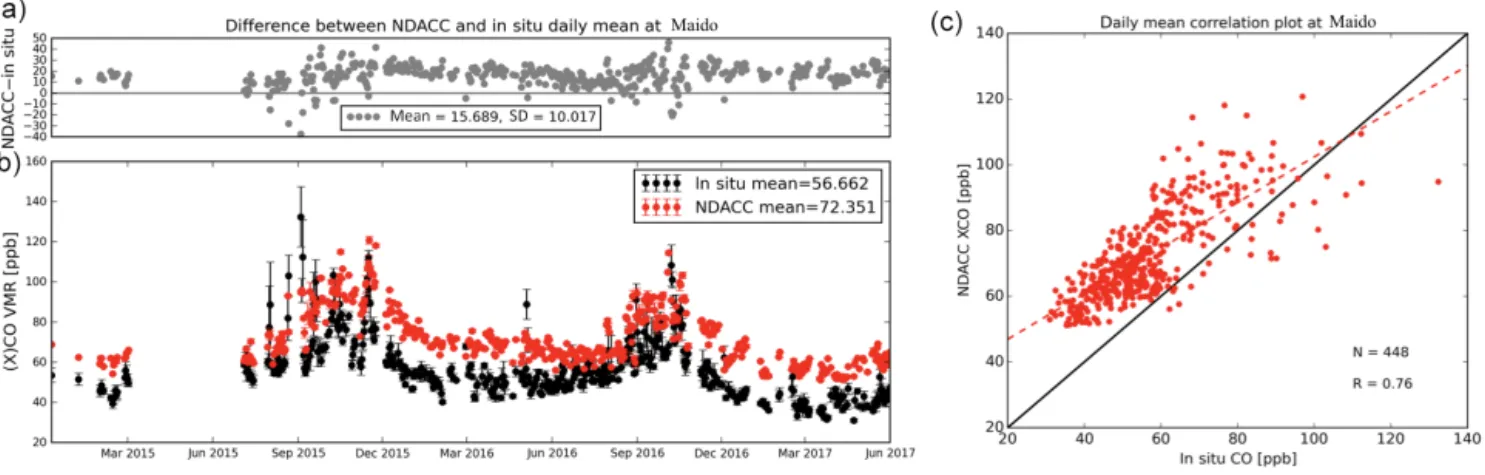
The time series and the correlation between the colocated in situ and NDACC daily means of CO measurements at Maïdo are shown in Fig. 6. There are 448 data pairs. The daily standard deviation of the in situ measurements is larger than that of the NDACC retrievals. The difference (mean and standard deviation) between NDACC retrieved XCO and in
situ CO is 15.69±10.02 ppb, which is beyond the systematic uncertainty of the NDACC retrievals (2–3 ppb). The correla-tion coefficient (R) between the NDACC and in situ measure-ments is 0.76. The slope (< 1.0) indicates that the absolute difference between the in situ and NDACC measurements is large (small) for the low (high) CO values.
3.3 CH4
A clear positive trend for CH4is recognized in Fig. 4. The
CH4 annual growth is 7.6 ± 0.4 ppb yr−1 for the TCCON
measurements for 2011–2017, and 7.4 ± 0.5 ppb yr−1for the in situ measurements for the same time period at St De-nis. Both estimations (at the surface and through the col-umn) of the annual growth rates are in agreement with CH4
Figure 4. The time series of CO (a) and CH4(b) from in situ and FTIR (NDACC and TCCON) measurements at St Denis and Maïdo. Note that there is no CO in situ measurement at St Denis. “St” and “Ma” in the legend represent St Denis and Maïdo, respectively. “(X)gas” is used in the y axes labels to present in situ VMR mea-surements and FTIR Xgasretrievals together.
trends observed at other locations after 2007 (Rigby et al., 2008; Bader et al., 2017). Although there is also a posi-tive trend (∼ 5.4 ppb yr−1) for the TCCON a priori CH4, it
has a weak effect on the trend of retrieved CH4 since
TC-CON has a good sensitivity to the atmosphere, especially in the troposphere (see Fig. 2). The CH4 annual growth is
9.2 ± 0.8 ppb yr−1from the NDACC retrievals from 2013 to 2017, and the annual growth of the TCCON measurements is 7.9 ± 0.4 ppb yr−1for the same time period. The annual growth of CH4in the 2013–2017 period is slightly larger than
that in the 2011–2017 period, which is consistent with the results from the NOAA/ESRL cooperative global air sam-pling network (https://www.esrl.noaa.gov/gmd/ccgg/trends_ ch4/, last access: 23 September 2018). The globally averaged marine surface CH4annual increases from the NOAA/ESRL
sites are 7.7 ± 0.6 ppb yr−1 in the 2011–2017 period and 8.8 ± 0.7 ppb yr−1in the 2013–2017 period.
The seasonal cycles of CH4 from the in situ
measure-ments at St Denis and Maïdo are very close to the mini-mum in December–February and the maximini-mum in August– September (see Fig. 5). This corresponds to the seasonal vari-ation of OH radicals, which are the major sink of CH4 in
the atmosphere (Kirschke et al., 2013). The seasonal cycles from the NDACC and TCCON retrievals are also similar, but different from those of the in situ measurements. Both
Figure 5. The seasonal cycles of CO (a) and CH4(b) from in situ and FTIR (NDACC and TCCON) measurements at St Denis and Maïdo. The error bar is 1σ for all of the detrended data within that month.
NDACC and TCCON XCH4 retrievals show high values in
April–September and low values in October–March, but the seasonal cycle of XCH4 from NDACC retrievals has a small
peak in the March–May period. The amplitude of the sea-sonal cycle from the in situ measurements (about ±10 ppb) is about 2 times larger than that from the FTIR measurements (about ±5 ppb). The reasons for the different seasonal pat-terns between FTIR and in situ measurements are discussed in Sect. 4.
The time series and the correlation between the colocated in situ and TCCON daily means of CH4measurements at St
Denis are shown in Fig. 7. The mean and standard deviation of the differences between the in situ and TCCON measure-ments are −6.63 and 9.78 ppb, respectively. The standard de-viation of 9.78 ppb is almost within the combination of the random uncertainties of the TCCON retrievals (∼ 9 ppb) and of the in situ measurements (∼ 1 ppb). Since there are no systematic uncertainties for both datasets, the mean value of −6.63 ppb is the difference between CH4 VMR at surface
and the total column averaged CH4at St Denis. As there is
a distinct positive annual growth for CH4for the 2011–2017
period, the correlation plot is labeled with the measurement year. The R between the TCCON XCH4and in situ CH4
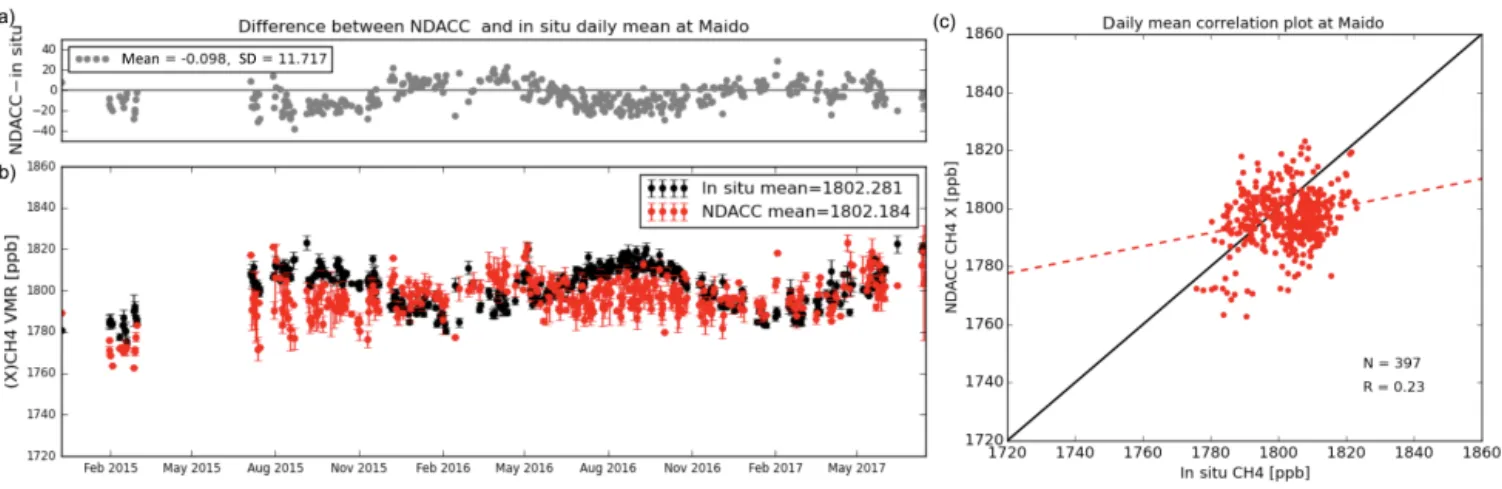
mea-surements is 0.86 for all of the data pairs. However, if we only take the data pairs after 2015, the R value drops to 0.48. The time series and the correlation between the colocated in situ and NDACC daily means at Maïdo are shown in Fig. 8. The averaged daily standard deviation of NDACC re-trievals is larger than that of in situ measurements, which is mainly due to the larger random error of NDACC retrievals (see Table 1). The mean and standard deviation of the differ-ences between the in situ and FTIR measurements are 0.62 and 11.90 ppb, respectively. The difference also shows a dis-tinct seasonal variation. The R value between daily NDACC XCH4 and in situ surface CH4 measurements is only 0.23.
The lower correlation value is believed to be caused by the
limited number of colocated measurements ( ∼ 2 years), and by the fact that NDACC CH4 has a reduced sensitivity to
the boundary layer and an increased sensitivity to the strato-sphere compared to the CO product.
4 Discussions 4.1 CO
Atmospheric CO is mainly produced by the incomplete combustion of carbon-based fuels (Kasischke and Bruh-wiler, 2002) and the oxidation of methane or other carbon-containing compounds (Cullis and Willatt, 1983). Maïdo ob-servatory, being located on a remote mountain, has low an-thropogenic CO emission nearby (European Commission, 2011); thus, there are very few spikes observed in the in situ measurements at this site in non-biomass-burning sea-sons (see upper panel in Figs. 4 and 6). Therefore, the CO molecules above Maïdo are either generated from oxidation processes in the atmosphere or transported from other places. FLEXible PARTicle dispersion model (FLEXPART) v9.02 (Stohl et al., 2005) backward simulations (see Fig. A1) are employed to understand the sources of air on Reunion Is-land. The settings of the FLEXPART run in this study are described in Appendix A. The results are consistent with Fig. 8 in Duflot et al. (2010). The air near the surface above Reunion Island mainly comes from the Indian Ocean and partly from southern Africa, whilst the air mass in the middle and upper troposphere mainly comes from Africa and South America. As CO emission on land is much larger than that from the ocean, FTIR XCOis systematically larger than the
in situ CO at the surface.
As we mentioned in Sect. 2.3.2, the NDACC retrievals provide CO profiles, which are comprised of approximately two individual layers of information (left panel in Fig. 3). We calculate the dry-air partial column averaged mole fractions
Figure 6. The time series of the daily means and standard deviations from FTIR (NDACC) XCOand daytime in situ CO measurements at Maïdo, in addition to the absolute difference (unit: ppb) between them (left lower and top, respectively) and their correlation (right).
Figure 7. The time series of the daily means and standard deviations from the daytime in situ and FTIR (TCCON) CH4measurements at St Denis, in addition to the absolute difference (unit: ppb) between them (left lower and top, respectively) and their correlation (right). Since there is a distinct annual growth for CH4, the dots are colored according to the measurement year in the right panel.
XCO,p in the vertical ranges of surface–8 km and 8–20 km
following Eq. (5):
XCO,p=PCCO,p/PCdryair,p=PCCO,p/(PCwetair,p−PCH2O,p), (5)
where PCCO,p, PCH2O,p, PC
dry
air,p and PCwetair,p are the partial
column of CO, H2O, dry air and wet air in that vertical range.
The in situ CO measurements are compared with the NDACC XCO,pin the vertical range of surface–8 km and 8–
20 km in Fig. 9. As we expected, the R value between the in situ and NDACC XCO,pin surface–8 km (0.81) is larger than
the value between the in situ and NDACC XCO,pin 8–20 km
(0.50). The large R value and the slope close to 1.0 between the in situ and NDACC XCO,p in surface–8 km confirm that
NDACC CO retrievals have a very good sensitivity to the lower troposphere. NDACC retrievals show that air in the upper troposphere and the lower stratosphere also captures the signal from biomass burning despite the weaker peak. In
general, the peaks of CO at the surface, in the surface–8 km and the 8–20 km ranges, all occur in September-November, which are months that are dominated by biomass burning emissions.
4.2 CH4
4.2.1 Different seasonal cycles in the troposphere and stratosphere
In Sect. 3.3, we found that the seasonal cycles of CH4from
the in situ and FTIR measurements are different. Ostler et al. (2016) pointed out that stratospheric CH4has an important
contribution to the variation of the total column. Since the NDACC CH4 retrievals have the ability to obtain two
indi-vidual collections of information in the troposphere and the stratosphere, in this section, we separate the total column into tropospheric and stratospheric parts. Figure 10 shows
Figure 8. The time series of the daily means and standard deviations from the daytime in situ and FTIR (NDACC) CH4measurements at Maïdo, in addition to the absolute difference (unit: ppb) between them (a and b, respectively) and their correlation (c).
Figure 9. The time series of the daily means and standard deviations from the daytime in situ CO measurements and NDACC XCOin vertical ranges from 8 to 20 km (b) and the surface to 8 km (e) at Maïdo, in addition to the absolute difference (unit: ppb) between them (a, d) and their correlation (c, f).
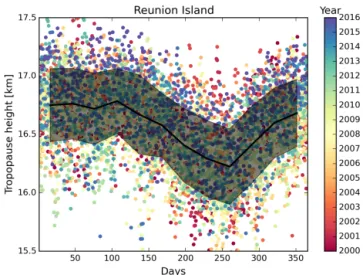
the tropopause height above Reunion Island from the NCEP reanalysis data from 2000 to 2016. The tropopause height is about 16–17 km with the maximum in February–April and the minimum in August–October. The in situ measurements are treated as a reference to compare with the FTIR retrievals in the troposphere.
For NDACC retrieved CH4 profiles, similar to XCO,p
(Eq. 5), we calculate the dry-air column averaged mole frac-tions of CH4 in the troposphere (XCH4,tr) and stratosphere
(XCH4,st), respectively: XCH4,tr=PCCH4,tr/PC dry air,tr =PCCH4,tr/(PC wet air,tr−PCH2O,tr), (6) XCH4,st=PCCH4,st/PC dry air,st, (7) where PCCH4,tr, PCH2O,tr, PC dry air,trand PC wet
air,trare the
respec-tive partial columns of CH4, H2O, dry air and wet air in the
troposphere; PCCH4,st and PC
dry
air,st are the respective partial
columns of CH4and dry air in the stratosphere. Note that the
H2O partial column in the stratosphere is ignored as the H2O
mole fraction is very low at high altitudes. We take the verti-cal range from the surface to 16.5 km as the troposphere and from 16.5 to 60 km as the stratosphere above Reunion Island. For TCCON XCH4 retrievals, it is not straightforward to
separate the total column into tropospheric and stratospheric parts, as GGG2014 uses the scaling profile retrieval method. Fortunately, previous studies have proved that the HF total column (Washenfelder et al., 2003) or the stratospheric N2O
(Wang et al., 2014) could be used as an estimator of the tro-pospheric CH4, since there is a good relationship between the
CH4 and HF or N2O in the stratosphere. The HF and N2O
total columns are also retrieved from the TCCON spectra by GGG2014. However, the retrieved HF is seriously affected by the H2O mole fraction, especially at humid sites such as
St Denis. Therefore, we use the N2O column to calculate
the stratospheric CH4 and the tropospheric CH4. The
rela-tionship between the stratospheric CH4and N2O is derived
from the Atmospheric Chemistry Experiment Fourier trans-form spectrometer satellite data. For a thorough description of the N2O proxy method, refer to Wang et al. (2014).
In the stratosphere, the MIPAS satellite observations are applied to compare with the FTIR retrievals (XCH4,st).
MI-PAS observed the global distributions of CH4profiles for the
2002–2012 period using the limb sounding technique. MI-PAS performed in full spectral resolution mode (FR) with a spectral resolution of 0.05 cm−1 from July 2002 to March 2004. After that, one of the interferometer sides was broken, and MIPAS switched to reduced spectral resolution mode (RR) with a spectral resolution of 0.121 cm−1(Fischer et al., 2008). In this section, we use the MIPAS level-2 version V5H (FR) and V5R (RR) data from the Institut für Meteo-rologie und Klimaforschung/Instituto de Astrofísica de An-dalucía (von Clarmann et al., 2003). The MIPAS CH4
pro-file covers the upper troposphere and the whole stratosphere (about 12–70 km). The DOFs of the CH4 profile retrieved
from MIPAS measurements is about 12 with a vertical res-olution of 3–5 km below 50 km and 6–10 km above 50 km. The MIPAS observations in the vertical range of 16.5–60 km around Reunion Island within ±3◦ latitude and ±5◦ longi-tude are selected for comparison with the FTIR retrievals in the same vertical range. MIPAS observations show that the CH4mole fraction decreases with increasing altitude in the
stratosphere.
Figure 10. The tropopause height monthly means along with their uncertainties (shadow, 1σ ) from the NCEP reanalysis data for the 2000–2016 period above Reunion Island.
The NDACC retrievals at St Denis for the 2004–2011 pe-riod are also analyzed in this section, because the MIPAS instrument stopped in April 2012. According to Rodgers (2003), the vertical sensitivity should be taken into account when comparing two remote sensing retrievals. As the ver-tical resolution of MIPAS observation is higher than that of FTIR measurement, a smoothing correction was carried out for the MIPAS profiles:
PC0M=PCa,N+A(PM−Pa,N), (8)
where Pa,N and PM are the NDACC a priori partial
col-umn profile and MIPAS retrieved partial colcol-umn profile, respectively; PCa,N is the NDACC a priori partial column
(16.5–60 km); PC0Mis the smoothed MIPAS retrieved partial column (16.5–60 km); and A is the partial column (16.5– 60 km) averaging kernel of NDACC retrieval at St Denis. The XCH4,st from the MIPAS measurements are calculated
to quantitatively compare with the FTIR retrievals, using Eq. (7).
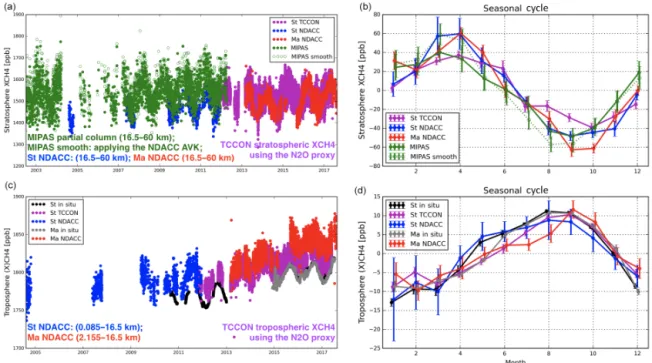
Figure 11 shows the time series and seasonal cycles of CH4 in the troposphere and stratosphere from the in situ,
FTIR (NDACC and TCCON) and MIPAS (with and without smoothing correction) measurements. In the stratosphere, the difference between NDACC and TCCON retrievals is less than 0.5 %, which is within their measurement uncertainties. The MIPAS observations are slightly larger (about 30 ppb) compared to the NDACC measurements. The difference be-tween MIPAS and NDACC measurements is within their er-ror budget, as the averaged measurement uncertainty of MI-PAS partial columns in the vertical range from 16.5 to 60 km is 3.5 % (∼ 50 ppb). The seasonal cycles of stratospheric CH4 from all measurements show a maximum in March–
April and a minimum in August–October. Since CH4 has a
indica-Figure 11. The time series and seasonal cycles of CH4from the in situ, FTIR (NDACC and TCCON) and colocated MIPAS measurements. (a) The time series of the stratospheric XCH4 from the TCCON retrievals (the N2O proxy method) at St Denis, NDACC and collocated MIPAS partial columns (16.5–60 km), and the smoothed MIPAS measurements using the St Denis NDACC AVK. (b) The seasonal cycles of all the data in the stratosphere. (c) The time series of the tropospheric (X)CH4from the in situ measurements at St Denis and Maïdo, NDACC retrievals at St Denis (0.085–16.5 km) and Maïdo (2.155–16.5 km), and TCCON retrievals (the N2O proxy method) at St Denis. (d) The seasonal cycles of the available data in the troposphere.
tive of stratosphere–troposphere exchange and circulation in the near tropopause region (Park et al., 2004a). The pattern of the stratospheric XCH4,stseasonal cycle is highly related to
the tropopause height (see Fig. 10), and the tropopause height is dominated by vertical transport (Holton et al., 1995). The enhanced CH4mole fraction during the March–April period
could be due to convection, which lifts air from the tro-posphere to the stratosphere. The minimum in the August-October period comes from the strengthened sink down in the stratosphere. In August–October the upwelling branch of the Brewer–Dobson circulation moves to the Northern Hemi-sphere and the sink down motion occurs in the stratoHemi-sphere above Reunion (Seviour et al., 2012). The amplitudes of the seasonal cycles from the TCCON and MIPAS measurements are about ±40 ppb, which are lower than those derived from NDACC measurements (about ±60 ppb). The AVK (the red line in the right panel of Fig. 3) shows that the retrieved par-tial column in the stratosphere from the NDACC retrieval overestimates the change in the stratosphere (AVK is about 1.3). After the smoothing correction, the amplitude of the seasonal cycle from the MIPAS measurements comes very close to the amplitudes from the NDACC retrievals at the two sites.
In the troposphere, the seasonal cycles of CH4 from the
in situ and the FTIR (both NDACC and TCCON) measure-ments have the same pattern with the maximum in August–
September and minimum in December–January, which is highly related to the OH seasonal variation (Bloss et al., 2005). In addition, all the amplitudes of the seasonal cycles are about ±10 ppb. The CH4mole fraction from the in situ
measurements at St Denis and Maïdo are very close. How-ever, the in situ measurement is about 17 ppb lower than the TCCON XCH4,tr and about 27 ppb lower than the NDACC
XCH4,tron average. In the next section, the simulations from
the GEOS-Chem model are used to understand the difference observed in absolute levels between the in situ, NDACC and TCCON CH4measurements in the troposphere.
4.2.2 GEOS-Chem model simulations in the troposphere
The 3-D chemistry transport model GEOS-Chem (Wecht et al., 2014) is applied to investigate the seasonal cycle of methane in the troposphere and the differences between the in situ and the FTIR measurements of tropospheric CH4.
This model is able to simulate the global vertical distribu-tions of trace gases and aerosols. The methane offline simu-lation is performed with GEOS-Chem version 11-01, driven here by MERRA-2 reanalysis meteorological fields produced by the Global Modeling and Assimilation Office (GMAO) at the Goddard Space Flight Center. OH fields are prescribed from a 3-D archive of monthly mean OH concentrations (Park et al., 2004b), and the methane loss is augmented by
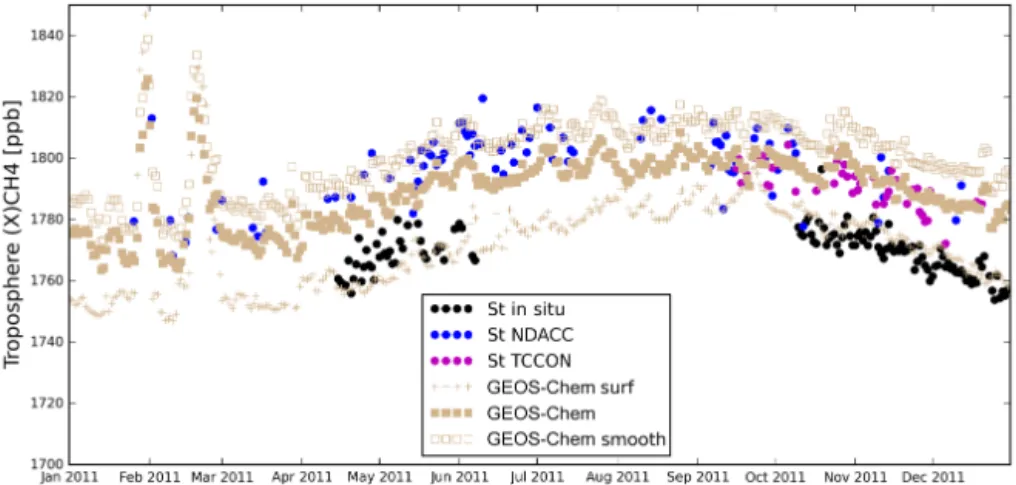
Figure 12. The time series of CH4daily means from the in situ measurements (black dots), NDACC tropospheric XCH4 (blue dots) and
TCCON tropospheric XCH4(purple dots) at St Denis, in addition to the GEOS-Chem model simulations of the VMR at the surface (brown
cross), tropospheric XCH4(brown filled squares) and tropospheric XCH4after smoothing with NDACC AVK (brown empty squares) in 2011.
soil absorption (Fung et al., 1991). The methane emissions are computed at run time by the HEMCO module (Harvard-NASA Emission Component; Keller et al., 2014), notably ac-counting for the EDGAR v4.2 anthropogenic emissions in-ventory which includes oil and gas, coal mining, livestock, waste, residential biofuel emissions (European Commission, 2011) and the GFED4 biomass burning inventory (Rander-son et al., 2015). We refer to Wecht et al. (2014) and Turner et al. (2015) for a description of the supplemental methane emission sources implemented in GEOS-Chem.
The whole year 2004 was used to spin-up the model simu-lation, adopting a 2◦×2.5◦horizontal resolution and 47 lev-els, and merging the levels above about 80 hPa. The simula-tion was subsequently extended to cover the 2005–2011 time period. The GEOS-Chem outputs are saved every 3 hours, and a mass-conservative interpolation provides re-gridded methane profiles on the NDACC retrieval altitude scheme (see Sect. 3.1.1 in Bader et al., 2017). These GEOS-Chem profiles are eventually smoothed with the NDACC averaging kernels to ensure a fair comparison with the methane mea-surements (Rodgers, 2003).
Figure 12 compares the tropospheric measurements and the model results for the year 2011 at St Denis, the site and year for which all the measurement types are available. For the model simulation, surface CH4as well as the smoothed
XCH4 in the troposphere (using the NDACC tropospheric
partial column averaging kernel in the 0.085–16.5 km al-titude range) are compared with the in situ, NDACC and TCCON measurements, respectively. We did not apply the smoothing correction for model simulations with the TC-CON AVK for the following two reasons: (1) TCTC-CON only provides the AVK for the total column, and we are looking at the tropospheric partial column; and (2) using the TCCON total column AVK to correct the smoothing error in the ver-tical range from the surface to 16.5 km has also been tested,
and the averaged difference between the smoothed and un-smoothed model data is within 0.5 ppb. This difference is much smaller than that for the NDACC data, as the a priori profile of TCCON is very close to the model simulation.
The smoothed XCH4 from GEOS-Chem is 11.5 ppb larger
than the XCH4on average without smoothing. This is because
the NDACC retrieved partial column in the troposphere is mostly sensitive to the vertical range of 5–13 km (see the blue line in the right panel of Fig. 3) and the modeled CH4
mix-ing ratios are 15-30 ppb larger in this layer, when compared to surface mole fractions. As a result, the NDACC retrieved XCH4is larger than the TCCON retrievals in the troposphere.
The GEOS-Chem simulation exhibits a clear seasonal mod-ulation, with the maximum (minimum) mole fractions in August–September (December–January), which is primarily influenced by the OH variation throughout the year. This fur-ther indicates that the averaged CH4VMR at the surface is
16.7 ppb lower than the tropospheric XCH4 (without
smooth-ing), which is in good agreement with the in situ and TCCON measurements. To summarize, the model simulation captures the differences between in situ and FTIR measurements (both NDACC and TCCON) as well as the seasonal variation of methane in the troposphere. Apart from that, two obvious spikes of CH4were simulated by the GEOS-Chem model in
January and February, and one was also observed by NDACC retrievals on 2 February 2011. The FLEXPART backward trajectories computed for this time period demonstrate that these spikes were due to the transport of air masses from the Northern Hemisphere to Reunion Island (see Fig. A2). Fig-ure A1 also shows that air parcels over Reunion Island dur-ing the local summertime (December–February) partly come from the Northern Hemisphere, indicating that the Intertrop-ical Convergence Zone (ITCZ) sometimes moves south over Reunion Island.
CO
situ measurements. The CO seasonal cycles observed from the in situ and NDACC and TCCON measurements are in good agreement with the maximum in September–November and the minimum in February–April. The CO maximum ob-served by both surface and total column measurements in the September–November period corresponds to the biomass burning period in Africa and South America. The NDACC CO retrievals have a strong sensitivity in the lower and mid-dle troposphere, and a good correlation (R = 0.81) is found between the colocated daily means from the in situ and NDACC partial column-averaged XCOin the vertical range
from the surface to 8 km. The averaged XCOfrom NDACC
retrievals is 15.7 ppb larger than the CO from in situ measure-ments at Maïdo. The different CO mole fraction between the surface and total column is related to the source of air on Re-union Island. FLEXPART simulations show that, during the entire year, the air near the surface mainly comes from the Indian Ocean and partly from southern Africa, while the air in the middle and upper troposphere is mainly from Africa and South America. The CO mole fraction from the ocean is much lower than that from the land. As a result, the XCO
from FTIR measurements at Maïdo is systematically about 15.7 ppb larger than the CO at the surface from in situ mea-surements.
The trend of CH4is 7.6 ± 0.4 ppb yr−1from the TCCON
measurements for the 2011–2017 period, which is consistent with the trend of 7.4 ± 0.5 ppb yr−1from the in situ measure-ments for the same time period at St Denis. However, the sea-sonal cycles of CH4from the in situ and FTIR measurements
are very different. The CH4mole fraction decreases rapidly
with altitude above the tropopause height (∼ 16.5 km on Re-union Island). According to the AVK, both NDACC and TC-CON retrieved XCH4 have a good sensitivity to the
tropo-sphere and stratotropo-sphere. The CH4seasonal cycles in the
tro-posphere and stratosphere are analyzed separately, based on the in situ measurements, FTIR measurements and the colo-cated MIPAS satellite observations. A very good agreement is observed in the tropospheric and stratospheric CH4
sea-sonal cycles between FTIR (NDACC and TCCON) measure-ments, and in situ and MIPAS measuremeasure-ments, respectively. In the troposphere, CH4VMR is high in August–September
retrieved XCH4 is mainly due to the difference in vertical
sensitivity. The averaged smoothed model simulation using the NDACC AVK is 11.5 ppb larger than the simulation without smoothing, which explains the difference between the NDACC and TCCON retrievals. In general, the in situ, NDACC and TCCON measurements are in good agreement with the GEOS-Chem model simulation.
Data availability. The TCCON data at St Denis are publicly avail-able through the TCCON wiki (https://tccondata.org/, last access: 25 September 2018). The NDACC data at St Denis and Maïdo are publicly available from the NDACC database (ftp://ftp.cpc. ncep.noaa.gov/ndacc/, last access: 25 September 2018). The in situ measurements from Reunion Island are not publicly available yet, but can be obtained by contacting the authors. The MIPAS satellite observations are publicly available from KIT/IMK (https: //www.imk-asf.kit.edu/english/308.php, last access: 25 Septem-ber 2018). The GEOS-Chem model data can be obtained from Em-manuel Mahieu ([email protected]).
Appendix A: FLEXPART backward simulation
The Lagrangian particle dispersion model FLEXPART v9.02 is capable of simulating a large range of atmospheric trans-port processes, taking mean flow, deep convection, and tur-bulence into account (Stohl et al., 2005). The backward simu-lation of FLEXPART provides the release–receptor resimu-lation- relation-ship, which is applied to study the source and transport of the observations from a measurement site. In this study, air par-ticles are released over Reunion Island at four vertical ranges in the troposphere, and a 4-D response function (sensitivity) to emission inventory is calculated. The model was driven by the meteorological data from the European Centre for Medium-Range Weather Forecast (ECMWF). The residence time of particles in output grid cells describes the sensitiv-ity of the receptor to the source. The detail settings of the FLEXPART backward run are listed in Table A1.
Table A1. The settings of FLEXPART v9.02 backward simulation used in this study.
Input meteorological data ECMWF data at 1◦×1◦global
Tracer Air
Release location horizontal ±0.2◦latitude/longitude around Reunion Island
Release location vertical 0–2000, 4000–6000, 8000–10000 and 12 000–14 000 m a.s.l.
Release time 06:00-18:00 local time for each day from 2011 to 2013
Number of days for backward running 20 days Number of particles for each release 20 000
Output grid horizontal 1◦×1◦global
Figure A1. Seasonal distributions of the emission response sensitivity in backward simulations of the air at four vertical ranges (0–2000, 4000–6000, 8000–10 000 and 12 000–14 000 m a.s.l.) in the troposphere above Reunion Island in the 2011–2013 period simulated with FLEXPART v9.02 (20 day backward run). Sensitivity is given in units of sm3kg−1.
Figure A2. The emission response sensitivity of the air mass above Reunion Island in the vertical range from 0 to 2000 m a.s.l. on 2 Febru-ary 2011 simulated with a 20 day backward run with FLEXPART v9.02.
Acknowledgements. Harmonization and characterization of the NDACC and TCCON data were supported by the EU FP7 project QA4ECV and H2020 project GAIA-CLIM. Minqiang Zhou is sup-ported by the Belgian Complementary Researchers program. The TCCON site at Reunion Island is operated by the Royal Belgian Institute for Space Aeronomy with financial support in 2014, 2015, 2016 and 2017 under the EU project ICOS-Inwire and the minis-terial decree for ICOS (FR/35/IC2); local activities are supported by LACy/UMR8105, Université de La Réunion. The surface mea-surements are supported by the SNO RAMCES/ICOS-France. We would like to thank Evelyn De Watcher (BIRA-IASB) for helpful discussions, Bart Dils and Francis Scolas (BIRA-IASB) for their contribution to the FTIR measurements, and Cyrille Vuillemin, Delphine Combaz, Roxanne Jacob and Joyce Marais (LSCE) for their contribution to the in situ instrument maintenance. The authors also wish to thank the European Communities, the Région Réunion, CNRS and Université de la Réunion for their support and contribution in the construction phase of the research infrastructure OPAR. OPAR is presently funded by CNRS (INSU) and Université de La Réunion and managed by OSU-R (Observatoire des Sciences de l’Univers de La Réunion, UMS 3365). This work was supported by the German Research Foundation (DFG, project PA 1714/2-2). The MERRA-2 data used in this study were provided by the Global Modeling and Assimilation Office (GMAO) at NASA Goddard Space Flight Center. Whitney Bader received funding from the European Union’s Horizon 2020 research and innovation programme under the Marie Sklodowska-Curie grant agreement no. 704951. The GEOS-Chem methane simulation at University of Liège was partly supported by the F.R.S.-FNRS (Brussels), under grant J.0093.15. Emmanuel Mahieu is a Research Associate with F.R.S.-FNRS.
Edited by: Andreas Richter
Reviewed by: two anonymous referees
References
Aschi, M. and Largo, A.: Reactivity of gaseous protonated ozone: A computational investigation on the carbon monox-ide oxidation reaction, Int. J. Mass Spectrom., 228, 613–627, https://doi.org/10.1016/S1387-3806(03)00134-9, 2003. Bader, W., Bovy, B., Conway, S., Strong, K., Smale, D., Turner, A.
J., Blumenstock, T., Boone, C., Collaud Coen, M., Coulon, A., Garcia, O., Griffith, D. W. T., Hase, F., Hausmann, P., Jones, N.,
and in situ measurements, Atmos. Meas. Tech., 6, 2865–2877, https://doi.org/10.5194/amt-6-2865-2013, 2013.
Birk, M., Wagner, G., Loos, J., Lodi, L., Polyansky, O. L., Kyu-beris, A. A., Zobov, N. F., and Tennyson, J.: Accurate line in-tensities for water transitions in the infrared: Comparison of theory and experiment, J. Quant. Spectrosc. Ra., 203, 88–102, https://doi.org/10.1016/J.JQSRT.2017.03.040, 2017.
Bloss, W. J., Evans, M. J., Lee, J. D., Sommariva, R., Heard, D. E., and Pilling, M. J.: The oxidative capacity of the tropo-sphere: Coupling of field measurements of OH and a global chemistry transport model, Faraday Discuss., 130, 425–436, https://doi.org/10.1039/b419090d, 2005.
Cullis, C. F. and Willatt, B. M.: Oxidation of methane over supported precious metal catalysts, J. Catal., 83, 267–285, https://doi.org/10.1016/0021-9517(83)90054-4, 1983.
De Maziere, M., Sha, M. K., Desmet, F., Hermans, C., Scolas, F., Kumps, N., Metzger, J.-M., Duflot, V., and Cammas, J.-P.: TCCON data from Reunion Island (La Reunion), France, Release GGG2014R0. TCCON data archive, hosted by Caltech-DATA, California Institute of Technology, Pasadena, CA, USA, https://doi.org/10.14291/tccon.ggg2014.reunion01.R0/1149288, 2017.
Deeter, M. N., Martínez-Alonso, S., Edwards, D. P., Emmons, L. K., Gille, J. C., Worden, H. M., Sweeney, C., Pittman, J. V., Daube, B. C., and Wofsy, S. C.: The MOPITT Version 6 product: al-gorithm enhancements and validation, Atmos. Meas. Tech., 7, 3623–3632, https://doi.org/10.5194/amt-7-3623-2014, 2014. Dils, B., Cui, J., Henne, S., Mahieu, E., Steinbacher, M., and
De Mazière, M.: 1997–2007 CO trend at the high Alpine site Jungfraujoch: a comparison between NDIR surface in situ and FTIR remote sensing observations, Atmos. Chem. Phys., 11, 6735–6748, https://doi.org/10.5194/acp-11-6735-2011, 2011. Duflot, V., Dils, B., Baray, J. L., De Mazière, M., Attié, J. L.,
Van-haelewyn, G., Senten, C., Vigouroux, C., Clain, G., and Delmas, R.: Analysis of the origin of the distribution of CO in the subtrop-ical southern Indian Ocean in 2007, J. Geophys. Res.-Atmos., 115, 1–16, https://doi.org/10.1029/2010JD013994, 2010. European Commission: Emission Database for Global
Atmo-spheric Research (EDGAR), release version 4.2, Tech. rep., Joint Research Centre (JRC)/Netherlands Environmental Assess-ment Agency (PBL), http://edgar.jrc.ec.europa.eu (last access: 22 February 2018), 2011.
Fischer, H., Birk, M., Blom, C., Carli, B., Carlotti, M., von Clar-mann, T., Delbouille, L., Dudhia, A., Ehhalt, D., EndeClar-mann, M.,
Flaud, J. M., Gessner, R., Kleinert, A., Koopman, R., Langen, J., López-Puertas, M., Mosner, P., Nett, H., Oelhaf, H., Perron, G., Remedios, J., Ridolfi, M., Stiller, G., and Zander, R.: MI-PAS: an instrument for atmospheric and climate research, Atmos. Chem. Phys., 8, 2151–2188, https://doi.org/10.5194/acp-8-2151-2008, 2008.
Folini, D., Kaufmann, P., Ubl, S., and Henne, S.: Region of influ-ence of 13 remote European measurement sites based on mod-eled carbon monoxide mixing ratios, J. Geophys. Res.-Atmos., 114, D08307, https://doi.org/10.1029/2008JD011125, 2009. Fung, I., John, J., Lerner, J., Matthews, E., Prather, M., Steele,
L. P., and Fraser, P. J.: Three-dimensional model synthesis of the global methane cycle, J. Geophys. Res., 96, 13033, https://doi.org/10.1029/91JD01247, 1991.
Hazan, L., Tarniewicz, J., Ramonet, M., Laurent, O., and Abbaris, A.: Automatic processing of atmospheric CO2 and CH4 mole fractions at the ICOS Atmosphere Thematic Centre, Atmos. Meas. Tech., 9, 4719–4736, https://doi.org/10.5194/amt-9-4719-2016, 2016.
Holton, J. R., Haynes, P. H., McIntyre, M. E.,
Dou-glass, A. R., Rood, R. B., and Pfister, L.:
Stratosphere-troposphere exchange, Rev. Geophys., 33, 403–439,
https://doi.org/10.1029/95RG02097, 1995.
IPCC: Climate change 2013: The physical science basis, Contribu-tion of Working Group I to the Fifth Assessment Report of the Intergovernmental Panel on Climate Change, 2013.
Kasischke, E. S. and Bruhwiler, L. P.: Emissions of car-bon dioxide, carcar-bon monoxide, and methane from boreal forest fires in 1998, J. Geophys. Res.-Atmos., 107, 8146, https://doi.org/10.1029/2001JD000461, 2002.
Keller, C. A., Long, M. S., Yantosca, R. M., Da Silva, A. M., Pawson, S., and Jacob, D. J.: HEMCO v1.0: a ver-satile, ESMF-compliant component for calculating emissions in atmospheric models, Geosci. Model Dev., 7, 1409–1417, https://doi.org/10.5194/gmd-7-1409-2014, 2014.
Kiel, M., Hase, F., Blumenstock, T., and Kirner, O.: Comparison of XCO abundances from the Total Carbon Column Observing Net-work and the NetNet-work for the Detection of Atmospheric Compo-sition Change measured in Karlsruhe, Atmos. Meas. Tech., 9, 2223–2239, https://doi.org/10.5194/amt-9-2223-2016, 2016. Kirschke, S., Bousquet, P., Ciais, P., Saunois, M., Canadell, J. G.,
Dlugokencky, E. J., Bergamaschi, P., Bergmann, D., Blake, D. R., Bruhwiler, L., Cameron-Smith, P., Castaldi, S., Chevallier, F., Feng, L., Fraser, A., Heimann, M., Hodson, E. L., Houweling, S., Josse, B., Fraser, P. J., Krummel, P. B., Lamarque, J.-F., Lan-genfelds, R. L., Le Quéré, C., Naik, V., O’Doherty, S., Palmer, P. I., Pison, I., Plummer, D., Poulter, B., Prinn, R. G., Rigby, M., Ringeval, B., Santini, M., Schmidt, M., Shindell, D. T., Simp-son, I. J., Spahni, R., Steele, L. P., Strode, S. A., Sudo, K., Szopa, S., van der Werf, G. R., Voulgarakis, A., van Weele, M., Weiss, R. F., Williams, J. E., and Zeng, G.: Three decades of global methane sources and sinks, Nat. Geosci., 6, 813–823, https://doi.org/10.1038/ngeo1955, 2013.
Laurent, O.: ICOS Atmospheric Station Specifications, https:// icos-atc.lsce.ipsl.fr/doc_public (last access: 28 September 2018), 2016.
Loos, J., Birk, M., and Wagner, G.: Measurement of air-broadening line shape parameters and temperature dependence parame-ters of H2O lines in the spectral ranges 1850–2280 cm−1
and 2390–4000 cm−1, J. Quant. Spectrosc. Ra., 203, 103–118, https://doi.org/10.1016/J.JQSRT.2017.03.033, 2017a.
Loos, J., Birk, M., and Wagner, G.: Measurement of posi-tions, intensities and self-broadening line shape parameters of H2O lines in the spectral ranges 1850–2280 cm−1 and 2390–4000 cm−1, J. Quant. Spectrosc. Ra., 203, 119–132, https://doi.org/10.1016/J.JQSRT.2017.02.013, 2017b.
Lopez, M., Schmidt, M., Ramonet, M., Bonne, J.-L., Colomb, A., Kazan, V., Laj, P., and Pichon, J.-M.: Three years of semi-continuous greenhouse gas measurements at the Puy de Dôme station (central France), Atmos. Meas. Tech., 8, 3941–3958, https://doi.org/10.5194/amt-8-3941-2015, 2015.
Messerschmidt, J., Geibel, M. C., Blumenstock, T., Chen, H., Deutscher, N. M., Engel, A., Feist, D. G., Gerbig, C., Gisi, M., Hase, F., Katrynski, K., Kolle, O., Lavric, J. V., Notholt, J., Palm, M., Ramonet, M., Rettinger, M., Schmidt, M., Suss-mann, R., Toon, G. C., Truong, F., Warneke, T., Wennberg, P. O., Wunch, D., and Xueref-Remy, I.: Calibration of TCCON column-averaged CO2: the first aircraft campaign over Euro-pean TCCON sites, Atmos. Chem. Phys., 11, 10765–10777, https://doi.org/10.5194/acp-11-10765-2011, 2011.
Novelli, P. C.: Reanalysis of tropospheric CO trends: Effects of the 1997–1998 wildfires, J. Geophys. Res., 108, 4464, https://doi.org/10.1029/2002JD003031, 2003.
Novelli, P. C., Masarie, K. A., and Lang, P. M.: Distribu-tions and recent changes of carbon monoxide in the lower troposphere, J. Geophys. Res.-Atmos., 103, 19015–19033, https://doi.org/10.1029/98JD01366, 1998.
Ostler, A., Sussmann, R., Rettinger, M., Deutscher, N. M., Dohe, S., Hase, F., Jones, N., Palm, M., and Sinnhuber, B.-M.: Multistation intercomparison of column-averaged methane from NDACC and TCCON: impact of dynamical variability, Atmos. Meas. Tech., 7, 4081–4101, https://doi.org/10.5194/amt-7-4081-2014, 2014. Ostler, A., Sussmann, R., Patra, P. K., Houweling, S., De Bruine,
M., Stiller, G. P., Haenel, F. J., Plieninger, J., Bousquet, P., Yin, Y., Saunois, M., Walker, K. A., Deutscher, N. M., Griffith, D. W. T., Blumenstock, T., Hase, F., Warneke, T., Wang, Z., Kivi, R., and Robinson, J.: Evaluation of column-averaged methane in models and TCCON with a focus on the stratosphere, Atmos. Meas. Tech., 9, 4843–4859, https://doi.org/10.5194/amt-9-4843-2016, 2016.
Park, M., Randel, W. J., Kinnison, D. E., Garcia, R. R., and Choi, W.: Seasonal variation of methane, water vapor, and ni-trogen oxides near the tropopause: Satellite observations and model simulations, J. Geophys. Res.-Atmos., 109, D03302, https://doi.org/10.1029/2003JD003706, 2004a.
Park, R. J., Jacob, D. J., Field, B. D., Yantosca, R. M., and Chin, M.: Natural and transboundary pollution influences on sulfate-nitrate-ammonium aerosols in the United States: Im-plications for policy, J. Geophys. Res.-Atmos., 109, D15204, https://doi.org/10.1029/2003JD004473, 2004b.
Pougatchev, N. S., Connor, B. J., and Rinsland, C. P.: Infrared mea-surements of the ozone vertical distribution above Kitt Peak, J. Geophys. Res., 100, 16689, https://doi.org/10.1029/95JD01296, 1995.
Randerson, J. T., van der Werf, G. R., Giglio, L., Collatz, G. J., and Kasibhatla, P. S.: Global Fire Emissions Database, Version 4, (GFEDv4), https://doi.org/10.3334/ORNLDAAC/1293, 2015.
Rodgers, C. D.: Inverse Methods for Atmospheric Sounding – The-ory and Practice, Series on Atmospheric Oceanic and Planetary Physics, vol. 2, World Scientific Publishing Co. Pte. Ltd, Singa-pore, https://doi.org/10.1142/9789812813718, 2000.
Rodgers, C. D.: Intercomparison of remote
sound-ing instruments, J. Geophys. Res., 108, 46–48,
https://doi.org/10.1029/2002JD002299, 2003.
Senten, C., De Mazière, M., Dils, B., Hermans, C., Kruglanski, M., Neefs, E., Scolas, F., Vandaele, A. C., Vanhaelewyn, G., Vigouroux, C., Carleer, M., Coheur, P. F., Fally, S., Barret, B., Baray, J. L., Delmas, R., Leveau, J., Metzger, J. M., Mahieu, E., Boone, C., Walker, K. A., Bernath, P. F., and Strong, K.: Technical Note: New ground-based FTIR measurements at Ile de La Réunion: observations, error analysis, and comparisons with independent data, Atmos. Chem. Phys., 8, 3483–3508, https://doi.org/10.5194/acp-8-3483-2008, 2008.
Sepúlveda, E., Schneider, M., Hase, F., Barthlott, S., Dubravica, D., García, O. E., Gomez-Pelaez, A., González, Y., Guerra, J. C., Gisi, M., Kohlhepp, R., Dohe, S., Blumenstock, T., Strong, K., Weaver, D., Palm, M., Sadeghi, A., Deutscher, N. M., Warneke, T., Notholt, J., Jones, N., Griffith, D. W. T., Smale, D., Brails-ford, G. W., Robinson, J., Meinhardt, F., Steinbacher, M., Aalto, T., and Worthy, D.: Tropospheric CH4 signals as observed by NDACC FTIR at globally distributed sites and comparison to GAW surface in situ measurements, Atmos. Meas. Tech., 7, 2337–2360, https://doi.org/10.5194/amt-7-2337-2014, 2014. Seviour, W. J. M., Butchart, N., and Hardiman, S. C.: The
Brewer-Dobson circulation inferred from ERA-Interim, Q. J. R. Meteor. Soc., 138, 878–888, https://doi.org/10.1002/qj.966, 2012. Stohl, A., Forster, C., Frank, A., Seibert, P., and Wotawa, G.:
Technical note: The Lagrangian particle dispersion model FLEXPART version 6.2, Atmos. Chem. Phys., 5, 2461–2474, https://doi.org/10.5194/acp-5-2461-2005, 2005.
Sussmann, R., Forster, F., Rettinger, M., and Bousquet, P.: Renewed methane increase for five years (2007–2011) observed by so-lar FTIR spectrometry, Atmos. Chem. Phys., 12, 4885–4891, https://doi.org/10.5194/acp-12-4885-2012, 2012.
Té, Y., Jeseck, P., Franco, B., Mahieu, E., Jones, N., Paton-Walsh, C., Griffith, D. W. T., Buchholz, R. R., Hadji-Lazaro, J., Hurtmans, D., and Janssen, C.: Seasonal variability of sur-face and column carbon monoxide over the megacity Paris, high-altitude Jungfraujoch and Southern Hemispheric Wol-longong stations, Atmos. Chem. Phys., 16, 10911–10925, https://doi.org/10.5194/acp-16-10911-2016, 2016.
Wennberg, P. O., and Wunch, D.: Estimating global and North American methane emissions with high spatial resolution us-ing GOSAT satellite data, Atmos. Chem. Phys., 15, 7049–7069, https://doi.org/10.5194/acp-15-7049-2015, 2015.
Vermeulen, A. T., Hensen, A., Popa, M. E., van den Bulk, W. C. M., and Jongejan, P. A. C.: Greenhouse gas observations from Cabauw Tall Tower (1992–2010), Atmos. Meas. Tech., 4, 617– 644, https://doi.org/10.5194/amt-4-617-2011, 2011.
Vigouroux, C., Stavrakou, T., Whaley, C., Dils, B., Duflot, V., Hermans, C., Kumps, N., Metzger, J.-M., Scolas, F., Van-haelewyn, G., Müller, J.-F., Jones, D. B. A., Li, Q., and De Mazière, M.: FTIR time-series of biomass burning products (HCN, C2H6, C2H2, CH3OH, and HCOOH) at Reunion Island (21◦S, 55◦E) and comparisons with model data, Atmos. Chem. Phys., 12, 10367–10385, https://doi.org/10.5194/acp-12-10367-2012, 2012.
von Clarmann, T., Ceccherini, S., Doicu, A., Dudhia, A., Funke, B., Grabowski, U., Hilgers, S., Jay, V., Linden, A., Lopez-Puertas, M., Martin-Torres, F. J., Payne, V., Reburn, J., Ridolfi, M., Schreier, F., Schwarz, G., Siddans, R., and Steck, T.: A blind test retrieval experiment for infrared limb emission spectrometry, J. Geophys. Res., 108, 4746, https://doi.org/10.1029/2003jd003835, 2003.
Wang, Z., Deutscher, N. M., Warneke, T., Notholt, J., Dils, B., Grif-fith, D. W. T., Schmidt, M., Ramonet, M., and Gerbig, C.: Re-trieval of tropospheric column-averaged CH4mole fraction by solar absorption FTIR-spectrometry using N2O as a proxy, At-mos. Meas. Tech., 7, 3295–3305, https://doi.org/10.5194/amt-7-3295-2014, 2014.
Washenfelder, R. A., Wennberg, P. O., and Toon, G. C.: Tropospheric methane retrieved from ground-based near-IR solar absorption spectra, Geophys. Res. Lett., 30, 2226, https://doi.org/10.1029/2003GL017969, 2003.
Wecht, K. J., Jacob, D. J., Frankenberg, C., Jiang, Z., and Blake, D. R.: Mapping of North American methane emis-sions with high spatial resolution by inversion of SCIA-MACHY satellite data, J. Geophys. Res., 119, 7741–7756, https://doi.org/10.1002/2014JD021551, 2014.
Wunch, D., Toon, G. C., Wennberg, P. O., Wofsy, S. C., Stephens, B. B., Fischer, M. L., Uchino, O., Abshire, J. B., Bernath, P., Biraud, S. C., Blavier, J.-F. L., Boone, C., Bowman, K. P., Brow-ell, E. V., Campos, T., Connor, B. J., Daube, B. C., Deutscher, N. M., Diao, M., Elkins, J. W., Gerbig, C., Gottlieb, E., Grif-fith, D. W. T., Hurst, D. F., Jiménez, R., Keppel-Aleks, G., Kort,
E. A., Macatangay, R., Machida, T., Matsueda, H., Moore, F., Morino, I., Park, S., Robinson, J., Roehl, C. M., Sawa, Y., Sher-lock, V., Sweeney, C., Tanaka, T., and Zondlo, M. A.: Cali-bration of the Total Carbon Column Observing Network us-ing aircraft profile data, Atmos. Meas. Tech., 3, 1351–1362, https://doi.org/10.5194/amt-3-1351-2010, 2010.
Wunch, D., Toon, G. C., Sherlock, V., Deutscher, N. M., Liu, C., Feist, D. G., and Wennberg, P. O.: The Total Carbon Column Observing Network’s GGG2014 Data Version, p. 43, https://doi.org/10.14291/tccon.ggg2014.documentation.R0/1221662, 2015.
Yang, Z., Toon, G. C., Margolis, J. S., and Wennberg,
P. O.: Atmospheric CO2 retrieved from ground-based
near IR solar spectra, Geophys. Res. Lett., 29, 53-1–53-4, https://doi.org/10.1029/2001GL014537, 2002.
Yokota, T., Yoshida, Y., Eguchi, N., Ota, Y., Tanaka, T., Watan-abe, H., and Maksyutov, S.: Global Concentrations of CO2and CH4 Retrieved from GOSAT: First Preliminary Results, Sola, https://doi.org/10.2151/sola.2009-041, 2009.
Yver Kwok, C., Laurent, O., Guemri, A., Philippon, C., Wastine, B., Rella, C. W., Vuillemin, C., Truong, F., Delmotte, M., Kazan, V., Darding, M., Lebègue, B., Kaiser, C., Xueref-Rémy, I., and Ramonet, M.: Comprehensive laboratory and field testing of cavity ring-down spectroscopy analyzers measuring H2O, CO2, CH4and CO, Atmos. Meas. Tech., 8, 3867–3892, https://doi.org/10.5194/amt-8-3867-2015, 2015.
Zhou, M., Vigouroux, C., Langerock, B., Wang, P., Dutton, G., Her-mans, C., Kumps, N., Metzger, J.-M., Toon, G., and De Maz-ière, M.: CFC-11, CFC-12 and HCFC-22 ground-based remote sensing FTIR measurements at Réunion Island and comparisons with MIPAS/ENVISAT data, Atmos. Meas. Tech., 9, 5621–5636, https://doi.org/10.5194/amt-9-5621-2016, 2016.
Zhou, M., Langerock, B., Vigouroux, C., Wang, P., Her-mans, C., Stiller, G., Walker, K. A., Dutton, G., Mahieu, E., and De Mazière, M.: Ground-based FTIR retrievals of SF6 on Reunion Island, Atmos. Meas. Tech., 11, 651–662, https://doi.org/10.5194/amt-11-651-2018, 2018.