Published in : Neuropsychological Rehabilitation (2005), vol. 15, n°3-4,
pp 381-388
DOI:10.1080/09602010443000524 Status : Postprint (Author’s version)
Bispectral analysis of
electroencephalogram signals
during recovery from coma:
Preliminary findings
Caroline Schnakers , Steve Majerus & Steven Laureys University of Liège, Liège, Belgium
ABSTRACT
The aim of this study was to investigate the accuracy of bispectral index (BIS), spectral edge frequency (SEF 95%), total power (TOTPOW) and frontal spontaneous electromyography (F-EMG) in monitoring consciousness in severely brain damaged patients. In 29 patients a total of 106 sedation-free and good quality EEG epochs were correlated with the level of consciousness as assessed by means of the Glasgow Liège Scale (GLS) and the Wessex Head Injury Matrix (WHIM). The strongest correlation with behavioural measures of consciousness was observed with BIS recordings. An empirically defined BIS cut-off value of 50 differentiated unconscious patients (coma or vegetative state) from conscious patients (minimally conscious state or emergence from minimally conscious state) with a sensitivity of 75% and specificity of 75%. These preliminary findings are encouraging in the search for electrophysiological correlates of consciousness in severe acute brain damage.
INTRODUCTION
Although the bedside examination is the standard method
of measuring neurological function, the
electroencephalogram (EEG) is an objective tool that permits continuous and online monitoring of brain function. Traditional EEG measures have also shown their efficacy in predicting outcome after anoxic or traumatic brain damage (Zandbergen et al., 1998). Because interpretation of the raw EEG signal requires considerable expertise and specialised training, simpler, more standardised measures of brain function are desired. The bispectral index (BIS) of the EEG is an empirical, statistically derived variable that provides information about the interaction of brain cortical and subcortical regions (Rampil, 1998). The BIS was designed as a measure of depth of anaesthesia and sedation. During the development of the monitor, the algorithm used to calculate the BIS was empirically derived and “normalised” on a scale of 0 – 100. A large number of EEG parameters were examined using statistical (discrimant) analysis to determine which of them provided useful information. Three main parameters were identified, and the BIS is calculated from the weighted sum of these three parameters: BetaRatio (the ratio of the power in the high and low beta ranges; i.e., frequency analysis), SynchFastSlow (calculated from the ratio of the bicoherence in fast and slower frequencies; i.e., bispectral analysis) (Barnett et al., 1971) and the BSR (burst suppression ratio—the proportion of each minute that the EEG is isoelectric; i.e., time domain analysis). Aside from amplifying, digitising and filtering the data, the main precursor step in calculation of the BIS is to apply a pattern recognition algorithm to determine the raw, time domain appearance of the EEG waveform. The weighting for the parameters is determined by this pattern recognition algorithm. In essence if the EEG has an activation appearance, the BIS is mostly determined by the BetaRatio. If the EEG shows signs of burst suppression, then the BIS is mostly determined by the BSR, whereas if
the EEG looks compatible with that found during “surgical anaesthesia”, then the BIS is mostly determined by SynchFastSlow. The exact weightings used have been determined by correlating the EEG pattern with anaesthetists’ clinical impressions of anaesthetic depth. It is important to stress that the BIS has thus only been calibrated for normal, anaesthetised patients, and not for patients with injured brains.
Increasing depth of anaesthesia results in decreasing BIS score. Typically, BIS values range from 40 to 55 during general anaesthesia (for a recent review see Drummond, 2000). It has also been shown to be an index of the degree of sedation during induction and recovery from anaesthesia (Glass et al., 1997) and a measure of the depth of natural sleep (Nieuwenhuijs et al., 2002; Sleigh, Andrzejowski, Steyn-Ross, & Steyn-Ross, 1999). Recently, attempts have been made to assess the usefulness of BIS monitoring in sedated (De Deyne et al., 1998; Simmons, Riker, Prato, & Fraser, 1999) and unsedated (Gilbert et al., 2001) patients in the intensive care unit (ICU). The purpose of the present study is to test the utility of the BIS as an objective index of cerebral function in severely brain damaged patients recovering from coma. Thus, EEG parameters were measured in a population of unsedated ICU patients and correlated with behavioural measures of consciousness. Given the small number of observations, this paper should be viewed as a preliminary record of ongoing research.
MATERIALS AND METHODS
This study was prospectively performed in 29 patients who were comatose on admission to our ICU unit. Only evaluations made when patients had not received sedation were included for analysis. Each data set comprised an EEG measurement and clinical assessments of consciousness. Datasets were generated periodically, two times a week, in test patients during the time from admission at the ICU until hospital discharge. Patients were classified according to internationally established criteria as being in: (1) coma (Plum & Posner, 1983); (2) vegetative state (VS) (Multi-Society Task Force on PVS, 1994); (3) minimally conscious state (MCS), or (4) exit from MCS (Giacino et al., 2002).
The study was approved by the ethics committee of the Medical Faculty of our University and written informed consent was obtained by the patients’ family.
CLINICAL MEASUREMENTS
In this study, we used the Glasgow Liège Scale (GLS; Born et al., 1982) and the Wessex Head Injury Matrix (WHIM; Shiel et al., 2000) as behavioural measurements of consciousness. The GLS combines the Glasgow Coma Scale (GCS) (Teasdale & Jennett, 1974) with a quantified analysis of five brainstem reflexes: fronto-orbicular, vertical cephalic, pupillary, horizontal cephalic, and oculo-cardiac (Born et al., 1982). The GLS is calculated as the sum of eye opening, motor response, verbal response, and brainstem reflex subscores and is scored from 3 (worst) to 20 (best) (Laureys, Majerus, & Moonen, 2002). The WHIM score represents the rank order of the most advanced behaviour observed and was designed for the assessment of patients in and emerging from coma and in the vegetative and minimally conscious states. It has been shown to be superior to the GCS and GLS scales for detecting subtle changes in patients emerging from vegetative state and for patients in a minimally conscious state (Majerus & Van der Linden, 2000) and is scored from 1 (worst) to 62 (best) (Schnakers, Majerus, & Laureys, 2004).
EEG MEASUREMENTS
EEG pads were placed in a two-channel referential standard frontal montage after a skin preparation with isopropyl alcohol. Measurement electrodes were placed on the temple and on the centre of the forehead. All leads were connected to a portable EEG monitor (A-2000, Aspect Medical Systems, Newton, USA). Data were sampled at 256 Hz, and high-frequency (70 Hz) and low-frequency (0.3 Hz) filters were used for EEG measurements. The A-2000 monitor provides a continuous output of the raw EEG pattern and divides the raw EEG data, sampled at 256 Hz, into 2 second epochs. At least eight epochs of “clean” EEG data are required to calculate the BIS (the minimum “smoothing period” is 15 seconds). Because sleep is
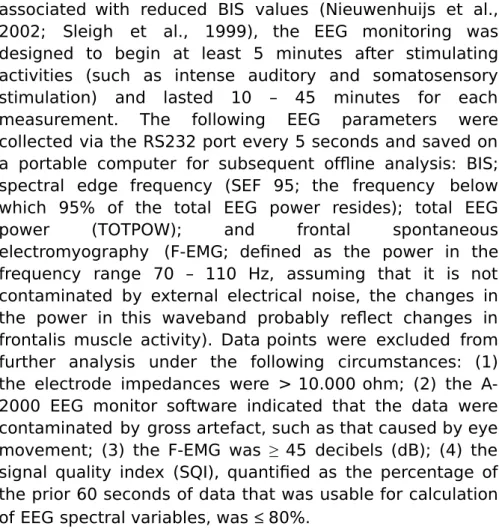
associated with reduced BIS values (Nieuwenhuijs et al., 2002; Sleigh et al., 1999), the EEG monitoring was designed to begin at least 5 minutes after stimulating activities (such as intense auditory and somatosensory stimulation) and lasted 10 – 45 minutes for each measurement. The following EEG parameters were collected via the RS232 port every 5 seconds and saved on a portable computer for subsequent offline analysis: BIS; spectral edge frequency (SEF 95; the frequency below which 95% of the total EEG power resides); total EEG
power (TOTPOW); and frontal spontaneous
electromyography (F-EMG; defined as the power in the frequency range 70 – 110 Hz, assuming that it is not contaminated by external electrical noise, the changes in the power in this waveband probably reflect changes in frontalis muscle activity). Data points were excluded from further analysis under the following circumstances: (1) the electrode impedances were > 10.000 ohm; (2) the A-2000 EEG monitor software indicated that the data were contaminated by gross artefact, such as that caused by eye movement; (3) the F-EMG was ≥ 45 decibels (dB); (4) the signal quality index (SQI), quantified as the percentage of the prior 60 seconds of data that was usable for calculation of EEG spectral variables, was ≤ 80%.
DATA ANALYSIS
All variables were expressed as mean + standard deviation of the mean. The two behavioural measures were plotted against each of the EEG variables and the Pearson univariate correlation coefficient calculated. Results were considered significant at p < .001.
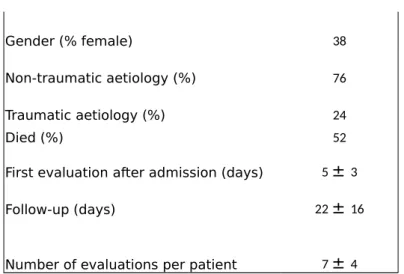
Table 1 : Patients’ demographic data (mean + standard deviation)
Patients M ± SD
Number of patients 29
Gender (% female) 38 Non-traumatic aetiology (%) 76 Traumatic aetiology (%) 24
Died (%) 52
First evaluation after admission (days) 5 ± 3 Follow-up (days) 22 ± 16
Number of evaluations per patient 7 ± 4
Note : Non-traumatic cases included anoxic encephalopathy (n=9), cerebrovascular accidents (n=10), encephalitis (n=2), and metabolic encephalopathy (n=1).
RESULTS
The demographic characteristics of the 29 patients enrolled in this study are shown in Table 1. A total of 193 datasets comprising EEG measurements and behavioural evaluations were collected; 38 were excluded because patients had received intravenous sedation within the prior 24 hours; 49 were excluded because EEG data were of sub-optimal quality (see above). Hence, 106 datasets were used for further study. Table 2 summarises the obtained mean behavioural and EEG data. Correlation coefficients between behavioural and EEG assessments are shown in Table 3. BIS most strongly correlated with both GLS and WHIM measurements (Figure 1).
A post-hoc Receiver Operating Characteristic (ROC) analysis (Zweig & Campbell, 1993) showed that at a BIS cut-off value of 50 the sensitivity (i.e., the proportion of unconscious patients who have a BIS below cut-off) was 75% and the specificity (i.e., the proportion of conscious patients who have a BIS above cut-off) also was 75%.
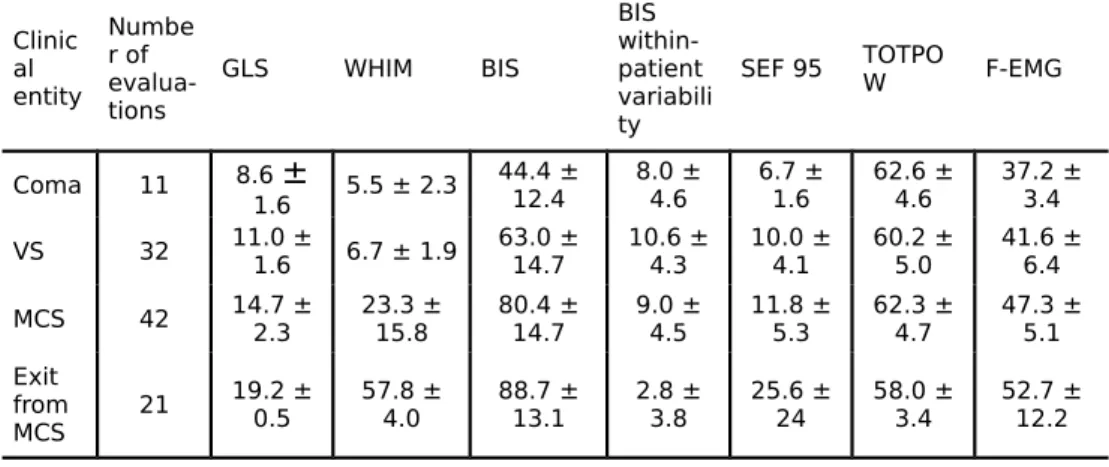
Table 2 : EEG and behavioural measurements in the different clinical
Clinic al entity Numbe r of evalua-tions GLS WHIM BIS BIS within-patient variabili ty
SEF 95 TOTPOW F-EMG
Coma 11 8.6 ± 1.6 5.5 ± 2.3 44.4 ± 12.4 8.0 ±4.6 6.7 ±1.6 62.6 ±4.6 37.2 ±3.4 VS 32 11.0 ±1.6 6.7 ± 1.9 63.0 ±14.7 10.6 ±4.3 10.0 ±4.1 60.2 ±5.0 41.6 ±6.4 MCS 42 14.7 ±2.3 23.3 ±15.8 80.4 ±14.7 9.0 ±4.5 11.8 ±5.3 62.3 ±4.7 47.3 ±5.1 Exit from MCS 21 19.2 ± 0.5 57.8 ±4.0 88.7 ±13.1 2.8 ±3.8 25.6 ±24 58.0 ±3.4 52.7 ±12.2 VS = vegetative state, MCS = minimally conscious state, GLS = Glasgow Liège Scale, WHIM = Wessex Head Injury Matrix, BIS = bispectral index (arbitrary values), SEF = 95% spectral edge frequency (in decibels), TOTPOW = total EEG power, F-EMG = frontal spontaneous electromyography (power in the low EMG waveband, 70 – 110 Hz).
Table 3 : Univariate correlation coefficients between behavioural and EEG
measurements
BIS SEF 95 TOTPOW F-EMG
GLS score 0.60* 0.41** 20.13† 0.49* WHIM score 0.57* 0.44** 20.14† 0.49* WHIM number of behaviours 0.54* 0.49* 20.17† 0.54* *p < 001; **p < 05; †non-significant.
DISCUSSION
The major finding of this study is that BIS significantly correlates with the behavioural evaluation of consciousness as assessed by the GLS or WHIM in brain damaged patients. The easy accessibility of continuous EEG-BIS monitoring makes it a promising alternative to the interpretation of the raw EEG signal, which requires considerable expertise. The use of EEG parameters in general and of BIS in particular for evaluating levels of consciousness has been a subject of intense investigation in recent years. In several studies, BIS has been shown to significantly correlate with the level of consciousness in anaesthetised patients (for review see Glass et al., 1997).
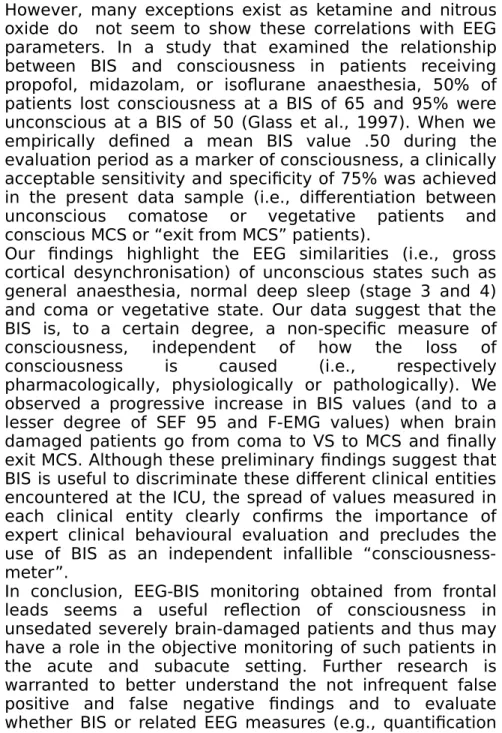
However, many exceptions exist as ketamine and nitrous oxide do not seem to show these correlations with EEG parameters. In a study that examined the relationship between BIS and consciousness in patients receiving propofol, midazolam, or isoflurane anaesthesia, 50% of patients lost consciousness at a BIS of 65 and 95% were unconscious at a BIS of 50 (Glass et al., 1997). When we empirically defined a mean BIS value .50 during the evaluation period as a marker of consciousness, a clinically acceptable sensitivity and specificity of 75% was achieved in the present data sample (i.e., differentiation between unconscious comatose or vegetative patients and conscious MCS or “exit from MCS” patients).
Our findings highlight the EEG similarities (i.e., gross cortical desynchronisation) of unconscious states such as general anaesthesia, normal deep sleep (stage 3 and 4) and coma or vegetative state. Our data suggest that the BIS is, to a certain degree, a non-specific measure of consciousness, independent of how the loss of consciousness is caused (i.e., respectively pharmacologically, physiologically or pathologically). We observed a progressive increase in BIS values (and to a lesser degree of SEF 95 and F-EMG values) when brain damaged patients go from coma to VS to MCS and finally exit MCS. Although these preliminary findings suggest that BIS is useful to discriminate these different clinical entities encountered at the ICU, the spread of values measured in each clinical entity clearly confirms the importance of expert clinical behavioural evaluation and precludes the use of BIS as an independent infallible “consciousness-meter”.
In conclusion, EEG-BIS monitoring obtained from frontal leads seems a useful reflection of consciousness in unsedated severely brain-damaged patients and thus may have a role in the objective monitoring of such patients in the acute and subacute setting. Further research is warranted to better understand the not infrequent false positive and false negative findings and to evaluate whether BIS or related EEG measures (e.g., quantification of complexity or approximate entropy) contain independent prognostic information for comatose and vegetative patients.
Figure 1. Scatter plot and linear regression between GLS, scores
from 3 (brain death) to 20 (best), and BIS, scores from 0 (iso-electrical) to 100 (“fully conscious”) (r = .60; p < 001).
Published in : Neuropsychological Rehabilitation (2005), vol. 15, n°3-4, pp. 381-388
DOI: https://doi.org/10.1080/09602010443000524 Status : Postprint (Author’s version)
REFERENCES
Barnett, T. P., Johnson, L. C., Naitoh, P., Hicks, N., & Nute, C. (1971). Bispectrum analysis of electroencephalogram signals during waking and sleeping. Science, 172(981), 401 – 402.
Born, J. D., Hans, P., Dexters, G., Kalangu, K., Lenelle, J., Milbouw, G., et al. (1982). Practical assessment of brain dysfunction in severe head trauma. Neurochirurgie, 28(1), 1 – 7.
De Deyne, C., Struys, M., Decruyenaere, J., Creupelandt, J., Hoste, E., & Colardyn, F. (1998). Use of continuous bispectral EEG monitoring to assess depth of sedation in ICU patients. Intensive Care Medicine, 24(12), 1294 – 1298.
Drummond, J. C. (2000). Monitoring depth of anesthesia: With emphasis on the application of the bispectral index and the middle latency auditory evoked response to the prevention of recall. Anesthesiology, 93(3), 876 – 882.
Giacino, J. T., Ashwal, S., Childs, N., Cranford, R., Jennett, B., Katz, D. I., et al. (2002). The minimally conscious state: Definition and diagnostic criteria. Neurology, 58(3), 349 – 353. Gilbert, T. T., Wagner, M. R., Halukurike, V., Paz, H. L., & Garland, A. (2001). Use of bispectral electroencephalogram monitoring to assess neurologic status in unsedated, critically ill patients. Critical Care Medicine, 29(10), 1996 – 2000.
Glass, P. S., Bloom, M., Kearse, L., Rosow, C., Sebel, P., & Manberg, P. (1997). Bispectral analysis measures sedation and memory effects of propofol, midazolam, isoflurane, and alfentanil in healthy volunteers. Anesthesiology, 86(4), 836 – 847.
Laureys, S., Majerus, S., & Moonen, G. (2002). Assessing consciousness in critically ill patients. In J. L. Vincent (Ed.), 2002 Yearbook of intensive care and emergency medicine (pp. 715 – 727). Heidelberg: Springer-Verlag.
Majerus, S., & Van der Linden, M. (2000). Wessex Head Injury Matrix and Glasgow/Glasgow - Liège Coma Scale: A validation and comparison study. Neuropsychological Rehabilitation, 10(2), 167 – 184.
Multi-Society Task Force on PVS (1994). Medical aspects of the persistent vegetative state (1). New England and Journal of Medicine, 330(21), 1499 – 1508.
Nieuwenhuijs, D., Coleman, E. L., Douglas, N. J., Drummond, G. B., & Dahan, A. (2002). Bispectral index values and spectral edge frequency at different stages of physiologic sleep. Anesthesia and Analgesia, 94(1), 125 – 129.
Plum, F., & Posner, J. B. (1983). The diagnosis of stupor and coma (3rd ed.). Philadelphia: F.A. Davis.
Rampil, I. J. (1998). A primer for EEG signal processing in anesthesia. Anesthesiology, 89(4), 980 – 1002.
Schnakers, C., Majerus, S., & Laureys, S. (2004). Diagnosis and investigation of altered states of consciousness. Reanimation, 13, 368 – 375.
Shiel, A., Horn, S. A., Wilson, B. A., Watson, M. J., Campbell, M. J., & McLellan, D. L. (2000). The Wessex Head Injury Matrix (WHIM) main scale: A preliminary report on a scale to
Published in : Neuropsychological Rehabilitation (2005), vol. 15, n°3-4, pp. 381-388
DOI: https://doi.org/10.1080/09602010443000524 Status : Postprint (Author’s version)
assess and monitor patient recovery after severe head injury. Clinical Rehabilitation, 14(4), 408 – 416.
Simmons, L. E., Riker, R. R., Prato, B. S., & Fraser, G. L. (1999). Assessing sedation during intensive care unit mechanical ventilation with the Bispectral Index and the Sedation-Agitation Scale. Critical Care Medicine, 27(8), 1499 – 1504.
Sleigh, J. W., Andrzejowski, J., Steyn-Ross, A., & Steyn-Ross, M. (1999). The bispectral index: A measure of depth of sleep? Anesthesia and Analgesia, 88(3), 659 – 661.
Teasdale, G., & Jennett, B. (1974). Assessment of coma and impaired consciousness. A practical scale. Lancet, 2(7872), 81 – 84.
Zandbergen, E. G., de Haan, R. J., Stoutenbeek, C. P., Koelman, J. H., & Hijdra, A. (1998). Systematic review of early prediction of poor outcome in anoxic-ischaemic coma. Lancet, 352(9143), 1808 – 1812.
Zweig, M. H., & Campbell, G. (1993). Receiver-operating characteristic (ROC) plots: A fundamental evaluation tool in clinical medicine. Clinical Chemistry, 39(4), 561 – 577.