Cost Model for Low Income Detached Houses By Alejandro V. Hanono B.S. in Civil Engineering Tulane University (1993)
Submitted to the Department of Civil Engineering in Partial Fulfillment of the Requirements for the Degree of
MASTER OF SCIENCE in Civil Engineering
at the
Massachusetts Institute of Technology
February 1995
© 1995 Alejandro V. Hanono All rights reserved
The author hereby grants to MIT permission to reproduce and to distribute publicly paper and electronic copies of this thesis document in whole or in part.
Signature of Author
Certified by
Accepted by
/7 Department of Civil Engineering December 1, 1994 Robert Logcher Professor of Civil and Environmental Engineering
Joseph M. Sussman Chairman, Departmental Committee on Graduate Studies
eark; tag
Cost Model for Low Income Detached Houses
byAlejandro V. Hanono
Submitted to the Department of Civil and Environmental Engineering on December 1, 1994 in partial fulfillment of the requirements for the Degree of Master of Science in
Civil and Environmental Engineering
ABSTRACT
It is known that the earlier a decision is taken during a design process, the more influence this decision has on the overall cost of a project. This is why methods that aid the early evaluation of the impact decisions have on the cost of a project must be developed. This thesis discusses the method of cost modeling, which can be used to evaluate decisions and their impact at an early stage. As part of this thesis, an example of a cost model for low income houses built in Panama is developed. This cost model uses embedded knowledge, in the form of mathematical formulas and IF THEN statements, to expand the input of two variables into a detailed cost estimate. These two variables are the area of the lot where the house will be constructed and the quality level of the house. Within the text, the development process of the model is explained. The cost model is implemented in Timberline Precision Estimating Plus, an estimating software. The tools and advantages of using this software are discussed. Finally, the accuracy of the cost model is computed by comparing its output cost to the cost of five actual projects built in Panama. The results show that a deviation of six percent is achieved in the worse cases. Also, recommendations for future research are given. Thesis Supervisor: Robert Logcher
Acknowledgement
The author wishes to thank the Massachusetts Institute of Technology and the
Center for Construction Research and Education for this educational experience. In
particular, to Professor Robert Logcher, who supervised this thesis.
I will also like to thank the following persons: My parents, Victor and Toni
Hanono, for all their support. My classmates and friends here at M.I.T. for their
companionship.
Table of contents
ABSTRACT ... Acknowledgement ... Table of contents ... List of Figures ... List of Tables ... Chapter 1 Introduction 1.1 1.2 1.3 1.4 1.5to Parametric and Design Based Cost Modeling Introduction ...
Previous work on cost modeling ... The Estimating Process ...
Timberline Precision Estimating Plus ... The concept of a work package ... Chapter 2
Cost Model 2.1 2.2
for Single Family Detach Houses . Introduction ...
Basic assumptions ... 2.2.1 Introduction to the Truss 2.2.2 Architectural description c
2.3 Description of the cost model . 2.3.1 Description of the primary
Panel System )f the houses
i variables .
2.3.2 Hierarchical tree structure of the components . ...
2.3.3 The parametric part of the model . . 2.3.4 The design based part of the model 2.4 Creating a Work Package using the model
2.4.1 Phases, Items, Formulas, and Tables 2.4.2
2.4.3 2.4.4
Implementing the cost model using Adjusting the price book ... Calibrating the model for a future
a work package
...
Chapter 3
R esults and Conclusions ... 3.1 Results ... 3.2 C onclusions ... ... ... 3 8 ... ... 4 5 ... 5 2 ... 6 7 ... . 67
Appendix A
Curve Fitting Output ... Appendix B
Estimating Formulas Report ... Appendix C
Form ula Tables ... Appendix D
Work Package Item Tables ... Appendix E
Estimating Work Package Report Appendix F Items Report ... ... 8 7 ... ... 8 9
List of Figures
Figure 1.1: The level of influence concept. ... 8
Figure 2.1: Section of the Truss Panel ... 24
Figure 2.2: On site construction of a low rise structure using the Truss Panel System. ... 25
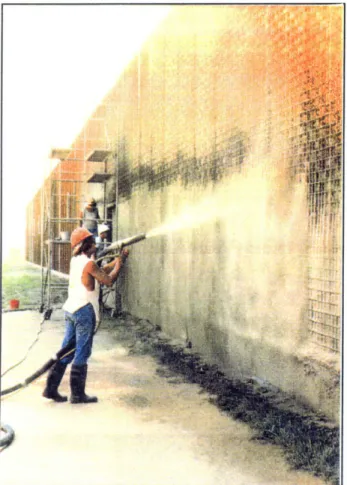
Figure 2.3: A construction worker spraying the Truss Panels with light weight concrete ... ... ... .. ... 26
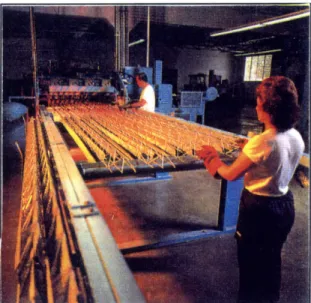
Figure 2.4: Truss Panel assembly line. Trusses being spot welded to the cross wires... 26
Figure 2.5: Truss Panel assembly line. Trusses are being put in place for spot welding ... 27
Figure 2.6: Truss Panel assembly line. The foam core is put in place after all the reinforcing is welded. ... 27
Figure 2.7: Plan view of a typical low income house. ... 30
Figure 2.8: Front and back view of a typical low income house. ... 31
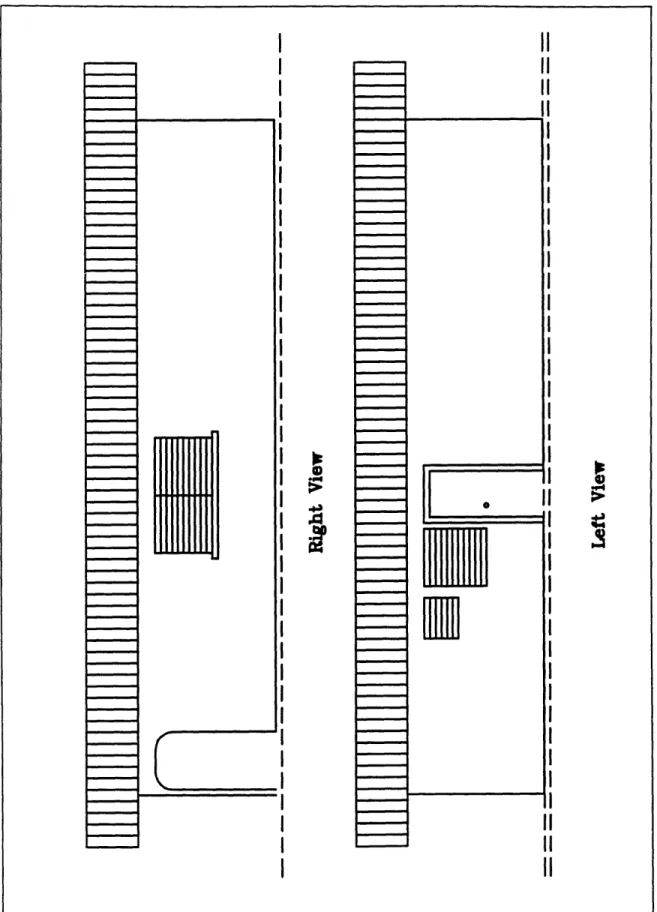
Figure 2.9: Side views of a typical low income house. ... 32
Figure 2.10: A graphical interpretation of the cost model ... 34
Figure 2.11: A hierarchical tree structure ... 38
Figure 2.12: Hierarchical tree of the components of a low income house. ... 40
Figure 2.13: Hierarchical tree of the components of a low income house (cont.) ... 41
Figure 2.14: Hierarchical tree of the components of a low income house (cont.) ... 42
Figure 2.15: Hierarchical tree of the components of a low income house (cont.) ... ... 43
Figure 2.16: Hierarchical tree of the components of a low income house (cont.) ... .... ... 44
Figure 2.17: Footprint vs. Area of the lot ... 48
Figure 2.18: Linear meters of wall vs. Footprint ... 48
Figure 2.19: Area of the bathrooms vs. Footprint ... 49
Figure 2.20: Area of bedrooms vs. Footprint ... 49
Figure 2.21: Area of the Living rooms vs. Footprint ... ... 50
Figure 2.22: Area of Kitchen vs. Footprint ... 50
Figure 2.23: Area of Porch vs. Footprint ... 51
List of Tables
Table 2.1: House features vs. Quality levels ... 37
Table 2.2: Data collected from actual projects ... 46
Table 3.1: Total cost for different quality levels and lot areas ... 72
Chapter 1
Introduction to Parametric and Design Based Cost Modeling
1.1 Introduction
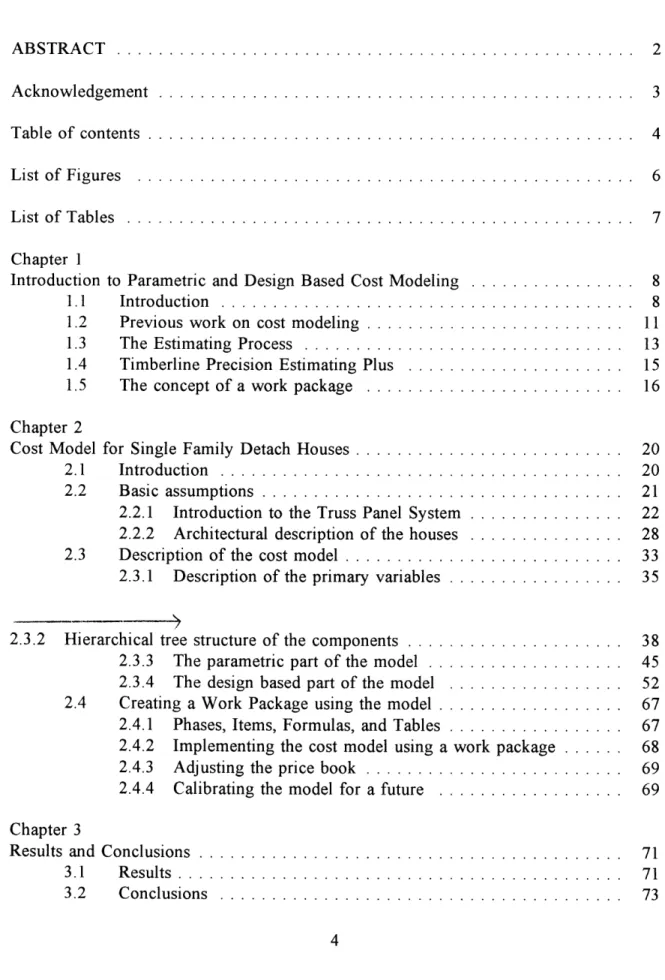
Design is known to be an iterative process where a rough estimate is done only to be refined at a later stage. This refinement or iteration happens many times during the planning process of a construction project. These iterations and the time they take have a cost impact on the design and development of a project. It is known that the earlier a decision is taken during this design process, the more influence it has on the overall cost of a project. This concept is known as the Level of Influence on Project Cost'. Figure 1.1 illustrates essential features of the level of influence concept.
Figure 1.1: The level of influence concept.
1 From Boyd C. Paulson, Jr., "Designing to Reduce Construction Cost", Journal of the Construction Division, ASCE, vol. 102, no. C04, December 1976, p. 588.
The lower portion of figure 1.1 simplifies the life of a project to a three activity bar chart consisting of (1) engineering and design, (2) procurement and construction, and (3) utilization or operation. The upper portion of the figure plots two curves. The curve ascending to the right tracks cumulative project expenditures. The curve descending from the left shows the decreasing level of influence that an individual decision has on total project cost. The bar chart and both curves are plotted against the same horizontal abscissa: project time.
In the early phases of a project, that is, during the feasibility studies, preliminary design, and even detail design, the relative expenditures are small compared with those of the project as a whole. Typically, engineering and design fees amount to well under ten percent of total construction cost2. However, although actual expenditures during the
early phases of the project are comparatively small, decisions and commitments made during that period have far greater influence on what later expenditures will in fact be. As these decisions evolve and commitments are made, the remaining level of influence on what the project cost will ultimately become drops precipitously.
This is why many have tried, with some success, to develop a method to estimate construction costs and cost impacts for decision alternatives in an early stage of projects. Two approaches have been tried, parametric estimating and cost modeling. Parametric estimating uses simple comparisons between a proposed project and the cost for existing similar projects. Cost are adjusted from differences in simple parameters. Cost modeling
2 C.A.P.A.C., Camara Panamefia de la Construcci6n. Informe del grupo de trabajo tecnico
-Sub Grupo de Costos. Comisi6n Especial de la vivienda. Panamni, 30 de Julio 1990.
simulates the design and develops a disaggregate estimate. The use of computers has definitely promoted this approach.
Cost modeling simulates the planning process by forecasting what different components will become part of the project, and then estimating the cost for these components. The advantage is that a cost model helps calculate the cost of the project with only a few project descriptions. But to develop a cost model involves experience and knowledge.
This thesis will explain the use of a cost model for early planning and preparation of the feasibility study of a construction project. It will focus on how a cost model can be constructed and used to evaluate the impact that design decisions have on cost. It will use as an example a cost model implemented for low income single family detached houses to be built in Panama. Although this model is simple and straightforward, the
author believes that this method can be used in larger and more complicated projects. The model developed in this thesis first uses a parametric model to calculate the architectural spaces and layout. These spaces are abstractly represented as the areas of different components in a house. Examples of these components are: the bedrooms, bathrooms, kitchen, living room, walls, parking space, etc. Once these components and their attributes are known, a design based model is used to design, select items, and
estimate the material and labor quantities and their cost for construction.3
See figure 2.1: The graphical interpretation of the model, on page 32.
1.2 Previous work on cost modeling
An example of an early computer estimating system is COBESTO (Computer Based Estimating Technique for Contractors)4. This system, developed in the mid 1960's,
used the quantities from a quantity survey and multiplied these by unit costs. This is the common method used in detailed estimating. Not only did COBESTO computerize this manual process, but it also allowed cost to be totalled both by activities and by contract items. In this system, an activity is a collection of contract items necessary to produce the identifiable object. For example, the activity Foundations can be composed of contract items like excavation, concrete, reinforcing steel, forming, etc. At the end of the estimate the user would have the total volume of concrete to be used in the entire project as well as the volume of concrete to be used in an individual activity such as the foundations.
The term activity is analogous to that used in CPM. In theory, this program was able to interface with CPM networks in order to monitor the performance of a project. One problem with COBESTO was that it could only be used when the design was completed, because a complete set of plans was needed. Therefore it could not be used as a tool to measure the impact and influence of the different decisions during the design stage but only to add takeoff quantities and multiply them by a respective unit cost.
Further development lead to a program named CACE (Computer Assisted Cost Estimating)5. This program allowed the user to estimate cost at various stages of the
Kramer, P., and L.R. Shaffer, COBESTO, Computer Based Estimating Technique for Contractors, University of Illinois Publication, 1965.
Billick, John P., and Mazuchowski, Thomas J., Computer Assisted Cost Estimating User's Manual, Smith, Hinchman & Grylls Associates, Inc., Detroit, 1972.
design process. The concept behind this system was that construction projects can be grouped into classes of projects (i.e. industrial, commercial, office buildings, high rise apartments, etc.) where each class can be represented by a model. A model is a group of activities linked together in the form of a hierarchical tree structure. The principal property of a hierarchical tree structure is that as the tree expands more detail is included. Even though projects of the same class may differ in size, the logical order in which the components are designed and the logic of the hierarchical tree remain constant. Therefore, a hierarchical tree functions as a template of steps needed to design a project. Based on this concept, CACE breaks activities down into components. Components and activities are then organized into a hierarchical tree structure where descending the tree leads to greater detail. The major drawback of CACE was its inability to model classes of projects since it was unable to alter component characteristics, like quantity and cost, from project to project. In summary, CACE ended up being just a template to model different classes of projects but lacked the tools to
actually do it.
In the mid 1970's, COSTMOD6, was developed by MIT as a tool for building and
operating estimating models for classes of projects and calculating cost at early stages of the design. COSTMOD operates a dynamic model, which gives the designer options to redesign the model. This type of computer model embeds design experience, practice, and decision rules in mathematical terms. The goal of the model is to reduce the amount
6 Logcher, R.D. , Hauber, A. , and Schild, W. ,
COSTMOD, A Cost Modeling System, user's manual., M.I.T. Publication, April 1977.
of project data required to produce a level of estimating accuracy by simulating design to create data at a higher level of detail.
One important aspect to remember is that it was not easy to develop or use these systems. This is because the computer tools that we have today were not available at that time. These tools include computer programming languages, software packages, faster and smaller computers, graphical interfaces, etc.
1.3 The Estimating Process
Estimating is the process of determining with some level of accuracy the materials, labor, and equipment that are needed to build a project. There are numerous methods with different levels of accuracy for preparing a cost estimate for a construction project. Each method has its appropriate application and limitations. It is very important to recognize that all estimates are approximations based upon judgement, experience, and a description of the project to be built at some level of detail. "Even the final reported cost figures on completed projects will differ in detail from what the true cost really were, because considerable judgement is required in recording and allocating cost figures while operations are in progress."7
Estimates range in scope and detail varies from an educated guess to a contractor bid estimates. The type of project also influences the scope of the estimate. For example, the construction of an estimate for a house can consist of applying historical unit cost to computed quantities. In contrast, an estimate used in heavy and industrial
Donald S. Barrie and Boyd C. Paulson , Professional Construction Management.
construction will deal with the design of the construction processes and facilities. Normally, this type of estimate is much broader in concept than merely determining costs. To get the cost, the estimator must practically build the project on paper. He must assess not only the contract materials reflected in the drawing but also the temporary materials, such as formwork for concrete.
An accurate estimate requires accurate information, including a complete set of blueprints, because the estimator needs to visualize building the project as a whole. Estimating usually requires a person with experience and knowledge who can interpret the project plans in order to include details not found in the product description. The experience and knowledge is required to suggest alternative methods of construction, to evaluate productivity to determine the resources needed to build the different components of the project, and to evaluate the cost.
During the planning process of a construction project, estimates evolve from conceptual and preliminary estimates to detailed estimates and only when they are finished do they become definitive estimates.
Conceptual and preliminary estimates are generally made in the early phases of a project. Initially they tell an owner whether a contemplated project scope is anywhere near to being feasible. Once under way, successively refined estimating techniques incorporate new information and thus keep a continuously updated estimate or budget available for control purposes. This provides a feedback to designers that helps keep the overall project within budget. It is in this stage of conceptual and preliminary estimates
that design decisions have more influence on the cost of the project.8
After conceptual design has been approved and after most or all of the detail design is completed, approximate estimates are supplemented by detailed estimates. These normally require a careful tabulation of all the quantities for a project. This is called quantity takeoff. These quantities are then multiplied by selected or developed unit costs, and the sum of the resulted products represents the estimated direct cost for the project.
As the overall project evolves from the owner's standpoint, initial approximate estimates become more refined and more accurate as additional information is developed. Finally, there comes the time when a definitive estimate can be prepared that will forecast the final project cost within a 2 to 3 percent margin of error.
1.4 Timberline Precision Estimating Plus
Timberline Precision Estimating Plus is a typical modern cost estimating software that makes the estimating process a simple task. It is a powerful computerized estimating system that blends the characteristics and tools of a spreadsheet software and a database software. The spreadsheet allows the user to work with an estimate in a format he/she is familiar with and provides reporting capabilities in any desired format. The database provides the tools for archiving historical cost information which can be accessed for future estimates.
Precision Estimating has several tools that facilitate the estimating process. These
tools can be divided in two groups depending on their characteristics: a database group and a spreadsheet group. In the database group, different libraries, such as the phases and items library, the unit price library, and the work package library, help the user to catalog and retrieve information rapidly. The phases and items library is where the user sets up, saves, and retrieves the different phases and items to be used in the type of construction involved. The phases and items involved in the different types of construction projects are organized in a special numbering scheme. This scheme consists of listing the different phases in a numerical order. Then, under each phase, the different items belonging to the respective phase are listed in an alphanumerical order. Alphanumerical order is used because words can be used to abbreviate the item description. For example, concrete of 4000 psi can be abbreviated as C4000. The unit price library of resource costs is where the user can assign and store the unit cost for resources used in individual items. The costs can be separated by labor, material, equipment, etc. Resource usage rates are specified in the item, leading to resource costs per item unit cost. The work package library is where the individual work packages created by the users are stored and accessed when needed. The spreadsheet provides tools to input and modify quantities, add items, and change individual prices for a specific project estimate.
1.5 The concept of a work package
When estimating the cost of a particular structure, it is useful to have a detailed list of quantities of materials to be installed and the items of work needed for its construction. A work package facilitates this takeoff process. A work package is a
logical grouping of work items that make up a particular structure, such as a foundation or a slab. A work package can also have embedded knowledge of how structures are constructed. This knowledge, embedded in the form of formulas, automates the takeoff process. For example, when estimating the cost of constructing a column, by specifying the geometry the work package can calculate the volume of concrete and the surface area of the formwork needed.
Work packages cross the boundaries of the regular item database numbering scheme by grouping items from different phases in one group. For example, suppose a database is numbered according to the CSI coding standards9. When thinking about
estimating a slab, all the items required to takeoff and estimate the slab must be considered. Under the CSI coding structure, the materials for the slab are located in various phases throughout the database, such as steel, concrete products, and wood. Rather than working with these items separately to do the takeoff of the slab, one can group them in a work package. After the estimating is done using the work packages, the sum of the various items in the different work packages can be seen in the CSI format. The model developed for this thesis was implemented as a work package on Precision Estimating Plus. This software was used because of its work package feature. The work packages automate the takeoff process by forecasting the items to be included in a project and their quantities. For example, consider a work package for reinforced concrete slabs. When calculating the slab cost, you select the reinforced concrete slab
9 Master format for construction classifications, as published by the Construction Specification
Institute (CSI), 601 Madison Street, Alexandria, Virginia 22314-1791.
work package. Then, instead of entering the dimensions for each item individually involved in this construction, you enter one set of common dimensions and specifications (for example: slab length, slab width, and depth) for the slab. Precision Estimating automatically calculates the individual quantities for the items in the work package that compose the slab, like the volume of concrete and tons of rebar, as well as the total work package quantity, cost, and cost per unit. The software will convert the takeoff quantity units to the order quantity units. For example, if concrete is ordered in cubic yards, it will automatically calculate how many cubic yards are needed even if the dimensions entered were in feet. Also the material and labor costs of the different items are calculated for the project using the prices in the cost database. When finished, the software generates the work package items and their quantities into the estimate spreadsheet. Once on the spreadsheet, the items can be seen organized under their respective CSI phases. Finally, the spreadsheet information can be modified or adjusted if needed.
Precision Estimating is known for its intelligent work packages. An intelligent work package is one that not only calculates quantities but also chooses between different items in order to satisfy a specification. An example of this is in estimating the cost of the roof of a house which is constructed using steel channels. Depending on the span of the roof, different sizes of channel may be chosen. Therefore, the work package must choose from different items depending on the span of the roof. An intelligent work package will calculate the size of the required channels and choose the proper items to build the roof. An intelligent work package can select an item by using equations given
by the modeler who constructed the work package.
The concept of a work package and an intelligent work package are used to implement the cost model for low income housing in this thesis.
Chapter 2
Cost Model for Single Family Detach Houses
2.1 Introduction
This thesis describes the development of a parametric and design based model for the estimating of material and labor costs for the construction of a typical low income house in Panama. The houses studied to develop this model are single family detached with lot sizes ranging from 150 to 300 square meters. Five construction plans were studied in order to develop the model. Architecture and the layouts were used to develop the model, but the structural system, which originally was a conventional concrete structure, is replaced in the model by a prefabricated structural panel system.
In order to construct any model, the object being modeled has to be visualized. In this case, the house needs to be broken into components. These components are the bedrooms, the bathrooms, the living room, the kitchen, the parking space, and the walls. From the five housing plans that were analyzed, the area and lengths of the components were measured. Equations relating the lot size to these areas, which represent the architecture of the house, were developed using regression analysis.10 These equations
represent the parametric part of the model.
After defining the areas and spaces using the equations developed by regression, a preliminary design and selection of the individual items (e.g. the roof, windows, doors, etc.) involved in the construction of a house is done. This is the design based part of the
iee data, regression output, and graphs. see
model. This part of the model chooses from different items and sizes in order to automate design decisions and meet quality criteria. For example, the roof, which is a component of a house, is composed of steel channels and zinc decking. The size of the channel which can adequately support the roof load is calculated based on the roof span. This step, which normally must be made before takeoff and estimating, is modeled in order to facilitate the construction of the preliminary estimate. The next component, the zinc decking, does not require a design decision. But certainly, the quality of the zinc or its gauge must be known before doing a preliminary estimate. To meet a quality criteria, the model also chooses from different items, such as different type of tiles, toilets, doors, etc..
The model facilitates the preliminary construction estimate by providing, despite limited input, a detailed output on material, equipment, and labor cost. The implementation of the model in Timberline Precision Estimating allows the user to modify any item of this preliminary estimate in spreadsheet format.
2.2 Basic assumptions
The structural system used in the model is a prefabricated system. This differs from the original plans of the houses studied. The original structural system is a conventional concrete structure, walls of concrete block, and either concrete roof beams or steel beams. This model uses the Truss Panel System". This system facilitates
11 The Truss Panel System: Cortina Systems de Panama, S.A. Urb. Industrial Orillac, Calle 2da, No. 27. P.O. Box 2937, Panama 3, Panama.
construction and reduces time and costs by replacing labor intensive construction.
2.2.1 Introduction to the Truss Panel System
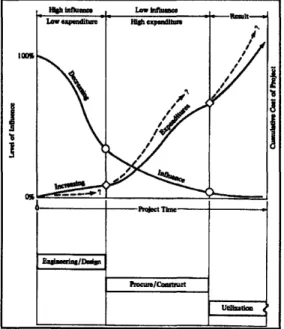
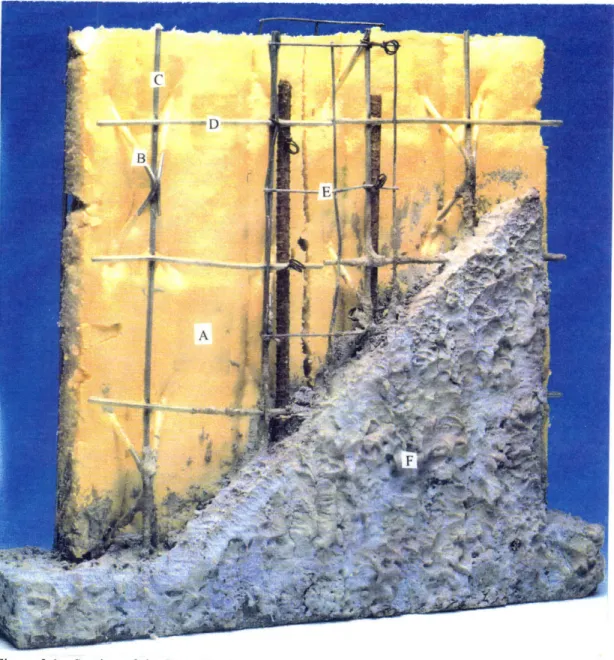
The Truss Panel System (shown in figures 2.1 to 2.6) is an innovative method for construction used in low rise structures. It consists of light weight components which provide insulation and, when put in place, serves as formwork and reinforcing for structural concrete. The on-site construction process consists of erecting the panel sections and tying them together by using a light wire mesh. Mechanical conduits can be installed between the steel and the foam core (A of figure 2.1). The panels have to be braced against lateral movement before they can be sprayed with light weight concrete. Because of the foam core, there is no need for expensive concrete forms. The final product is a light weight reinforced concrete structure. The system has all the advantages of time savings, cost savings, and good quality when compared to conventional block or timber frame construction.
The panels, 4 feet wide by 3, 4, 5, or 6 inches of thickness, are made of a three dimensional welded wire space frame. They come in any lengths ranging from 8 to 40 feet. This welded wire space frame is assembled using 10 longitudinal triangular trusses across their four feet width. They are held together by a foam core that functions as a form.
Each truss consists of three cord wires (C in figure 2.1) and two continuous web wires (B in figure 2.1), spaced eight inches off center. The web wires are spot welded to the truss chords forming a triangular matrix. The ten trusses are assembled in a reverse
pattern with cross wires (D in figure 2.1) spot welded across the truss chords, creating a 3" x 4" welded wire mesh pattern at each face of the frame. A foam core of 2 parts polyurethane insulation is sprayed into the panel to create a foam core in the middle of the wire frame.
There are two raw materials for the truss panels: (1) structural wire of 65,000 psi
min. in compliance with the standard specifications for cold drawn steel wire for concrete reinforcement and (2) insulation of polyurethane foam of class 1, with a minimum density of 1.8 lbs/ ft3.
The wire used ranges from 10 gauge (W 1.4) to 2 gauge (W 5.4) and their finish can be bright or galvanized. The panel are available in thickness of 3", 4", 5", or 6" depending on the required structural capacity. A 4" panel is strong enough for the houses being consider here.
Figure 2.1 shows a cross section of the truss panel. Figure 2.2 and 2.3 show the on-site construction of a low rise structure using the panels. Figure 2.4 to 2.6 show the factory assembly line for the Truss Panels.
Figure 2.1: Section of the Truss Panel.
A- Foam Core
B- Continuous web wire C- Cord Wire
D- Cross Wire
E- Wire mesh to hold the panels together F- Light weight concrete
Figure 2.3: A construction worker spraying the Truss Panels with light weight concrete.
Figure 2.4: Truss Panel assembly line. Trusses being spot welded to the cross wires.
Figure 2.5: Truss Panel assembly line. Trusses are being put in place for spot welding.
Figure 2.6: Truss Panel assembly line. The foam core is put in place after all the reinforcing is welded.
2.2.2 Architectural description of the houses
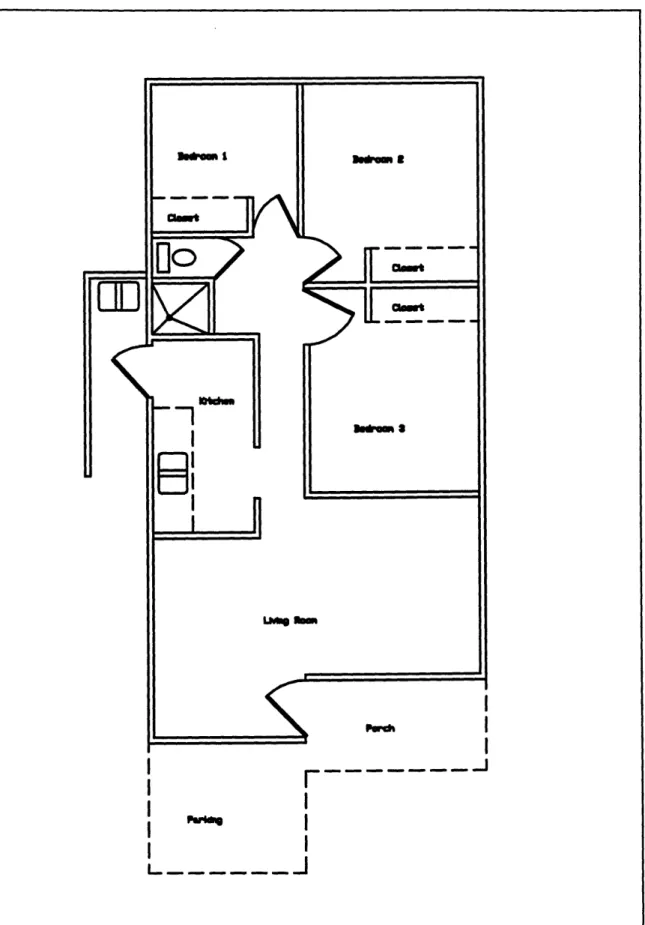
The five houses studied were constructed on lots ranging from 150 to 300 square meters. It was observed that the houses have different levels of quality. All the houses have a similar architectural layout that includes three bedrooms, one or two bathrooms (depending on the area), a kitchen, and a living room.
The bedrooms have a square geometry with an average area of nine square meters each. The bedroom floors can be either finished with smooth concrete or with carpet depending on the quality of the house. Every bedroom has a 1.8 m x 1.24 m window. The bedrooms include a closet or wardrobe made out of wood built along one of the walls.
The bathrooms have an average size of four square meters. The larger houses have two bathrooms. The bathrooms are very simple. They contain a shower, a sink, and a toilet. The floors and walls are finished with tiles. The bathrooms include fixtures such as soap holders, mirrors, etc.. The quality of these items vary according to the quality of the house.
The kitchens in these houses are composed of a stove, a sink, and a closet. Again, the quality of these items changes according to the quality of the house. The kitchens range from 6 to 12 square meters and with length to width ratios of 2:1. The walls of the high quality kitchen are finished with tiles while the walls of a low quality kitchen are finished with wall paper. The floors of the kitchens are finished with tiles or with a smooth concrete finish, depending on quality. The kitchens include a 1.3 m X 1.06 m window. Refrigerators ares not included in the house.
The living rooms in these houses have an average area of 27 square meters. The floors are finished with tiles or plain concrete, again depending on the quality of the house. In each living room there is an average of three windows: one 1.8 m X 1.24 m window and two 1.2 m X 1.6 m windows in most cases.
The doors used in the houses are of two types: solid core wooden doors and hollow core wooden doors. Houses of better quality have solid doors while houses with lower quality have hollow doors.
The roofs on the houses are made out of zinc and steel channels and fiberglass insulation. The inside of the houses have suspended ceilings. The size of the ceiling tiles vary accordingly to quality. It was found that low quality houses have larger ceiling tiles than good quality houses. In some cases, where the houses have a high quality, the roof extends all the way to cover the parking area. The average height of the houses (from slab to roof) is 2.8 meters.
The parking area consists of one or two parking spaces. The houses also have a small porch area separating the entrance from the parking area.
r---I
~e
I
i
I
Figure 2.7: Plan view of a typical low income house.
3
3
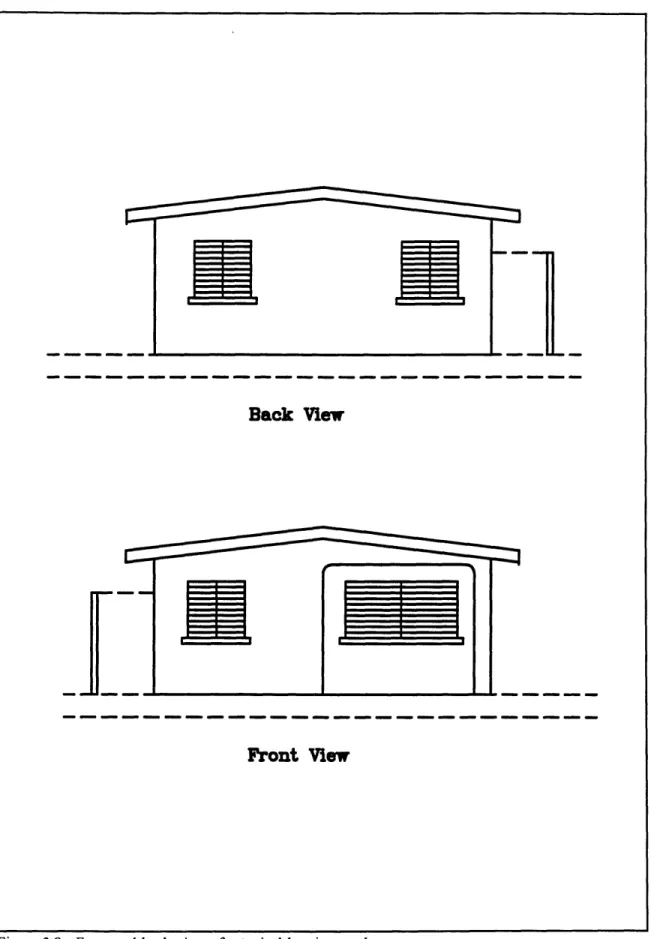
Back
View
3
Front View
Figure 2.8: Front and back view of a typical low income house.
IL
F
| d b bc~
~
-~Z`c I 1r
2.3 Description of the cost model
The cost model described in this thesis is a mathematical and logical representation of the design and construction process of a low income single family detached house. It follows formulas and rules to select and design components involved in the construction of a house. These components are organized in a logical hierarchy. While navigating along the hierarchy, the model uses rules of design and selection to expand the detail of the components. The level of detail becomes sufficient to compute takeoff quantities. It is after this that the takeoff quantities are multiplied by their respective unit price from the unit price library to arrive to a final detailed cost estimate.
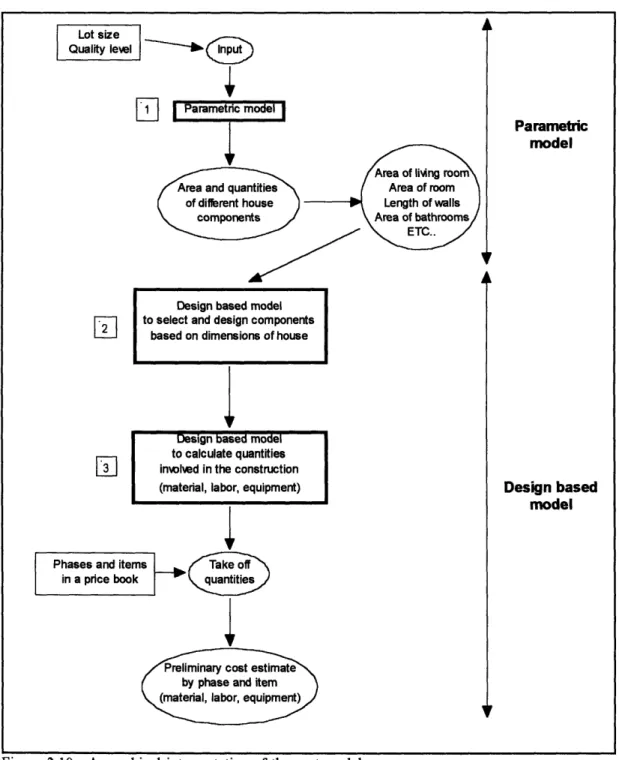
Figure 2.10 shows a graphical interpretation of the model. The user first inputs the level of quality needed and the area of the lot where the house will be constructed. These are the two input needed. These two variables are referred in the model as the primary variables. These variables are used in equations that estimate the areas of the different spaces in the house. Examples of these spaces are the bathroom area, the bedrooms area, etc. This part is referred in figure 2.10 as the parametric model (1 in fig. 2.10).
After the area of the spaces are known the design of some components, such as the roof beams, is done. Other quality decisions, like selecting between floor tiles or plain concrete finishes, is also done. This part is referred in figure 2.10 as the design and selection of items (2 in fig. 2.10).
After the different items have been selected and designed, a takeoff of the quantities is done. The individual dimension of the items are modeled to estimate the
quantities. It is necessary to know the quantities of the materials in order to assign a unit cost. Here is where the total cost is computed by adding up the individual costs (3 in fig
2.10).
Lot size Quality level
El
Parametric modelArea and quantities of difibferent house
components
Parametric model
Design based model to select and design components
based on dimensions of house
3
Design based model to calculate quantities involved in the construction (material, labor, equipment)
Phases and items
Take off
in a price book quantities
Preliminary cost estimate by phase and item (material, labor, equipment)
Design based model
Figure 2.10: A graphical interpretation of the cost model
- - - -
-Area of living room
Area of room
Length of walls Area of bathrooms
2.3.1 Description of the primary variables
In order to develop a cost model, variables that help interpret the requirements of the users need to be established. The author found that two basic characteristics describe a low income single family detached house. These are the size of the lot and the quality of the items in the house. This is why two variables, Lot Size and Quality are the only input needed in the model. These two variables are referred as the primary variables.
Lot Size represents the area available to built the house. The value for the Lot Size must range from 150 to 300 m2 in order to give results that are consistent with the plans studied. The Lot Size is the only input used to determine the size of the house, but several variables are derived from this value. The footprint of the house, which is the area that the construction occupies in the lot, is derived from the lot size. The area of the different spaces in the house (area of rooms, area of bathrooms, area of the kitchen, etc.), are derived from the footprint of the house. This process is explained in more detail in section 2.3.3 Parametric Part of the Model.
The variable quality is used to express the degree of quality that the user wants in the house. The variable quality has three possible values. These are: 1 for low quality, 2 for medium quality, and 3 for high quality (the highest quality level in the model). Some items are only included when the quality level is high, for example the tiles on the porch's floor. Other items are always included in the house, but the quality of these items may change accordingly to the quality level. For example, the number of parking spaces and the type of toilets used in the bathrooms vary according the quality level.
and selection of the different items in a house. Therefore, the final construction cost is related to the quality level as well as the size of the house.
In the cost model developed as part of this thesis, a house of low quality (Quality = 1) has the following characteristics. Only one parking space is considered in the design. This parking space is not covered. Hollow core wooden doors are used everywhere but on the main door. Because of security reasons, the main door is a solid wood door. These houses do not have a back door in the kitchen. The zinc that is used in the roof is a 26 gauge zinc. The suspended ceiling inside the house is assembled using
5/8" x 2' x 4' tiles. No tiles or carpet is installed in the floor, instead a smooth concrete finish is used. The floor in the bathrooms are the only ones the are finished with tiles. The bathrooms include the fixtures necessary such as a toilet, sink, paper holder, mirror, etc. These fixtures are, in general, of low quality. The walls have a smooth concrete finish. The kitchen includes a sink, stove, and a closet, and its walls are finished with wall paper.
A house with medium quality (Quality = 2) has one or two parking spaces depending on the size of the footprint. If the footprint area is greater than 100 square meters, then two parking spaces are included. The parking spaces are not covered. Like the low quality houses, hollow core doors are used except on the main door. There is a back exit in the kitchen. The roof is also constructed using 26 gauge zinc but the suspended ceiling is assembled using 5/8" x 2' x 2' since the smaller tiles reflect better quality. The bedrooms' floors are finished with carpets. The fixtures in the bathrooms are the same as the low quality houses. The walls of the bathrooms are finished with
tiles. The floors in the kitchen and living room are finished with tiles. Like the low quality houses, wall paper is used in the kitchen walls. The kitchen includes a sink, stove, and a closet.
A house with high quality (Quality = 3) has two covered parking spaces. The roof is built with 24 gauge zinc. Solid doors are used everywhere including the back door. The tiles used in the suspended ceiling are of better quality than the tiles used in the medium quality houses. In this case they are 3/4" X 2' X 2'. The bathroom fixtures are of better quality and the bathroom walls are finished with tiles. Also the kitchen is very similar to the medium quality but the walls are finished with tiles. A better sink, stove, and closet is used. The porch's floor is finished with exterior tiles.
Table 2.1 compares different features vs. the three quality levels.
Quality
Item 1 2 3
Low Medium Hi Number of parking spaces 1 1 or 2 2
overed parking no no yes
olid doors no no yes
econd door on the kichen no no yes
Zin auge 26 26 24
Susperdedceiling tile size 5)8x 2x 4 58x 2x2 3x 2x2
Bedroomcarpet no $14An2 $18/n2
Bedroomcloset $90m $901m $1051•m
Bathroomfloor tile $23ain2 $23/n2 $28_n2
Bahroom fixtures (in general) Lowquality Lowquality Hi quality
Balhroomuml tile no $1&5/M2 $225/tn2
Kitchen floor tile no $25/n2 $28/n2
ithen tile or vUl paper W $4/n2 W $4An2 $22.5n2
Kitchen sink $130 $130 $170
chen closet $70im $70,Dm $85,m
love $100 $100 $180
Porch floor tile no no $1&8.5)n2
Living roomfloor tile no $25AA2 $28Ax2
2.3.2 Hierarchical tree structure of the components
A hierarchical tree of the components for a house is a logical list of components that are involved in the construction of a house. One property of a hierarchical tree is that it starts at a level where the main components of a house are listed without much detail. But, as the tree expands it explains the previous level with more detailed information. Figure 2.11 is an illustration of a generic hierarchical tree. Here an abstract item (A), is explained with more detail (A1.1 and A1.2 etc.) as the tree expands.
Figure 2.11: A hierarchical tree structure
The components of a house can be put together in a hierarchical tree structure. This tree can be used to model the design process of a house. It helps by guiding the designer through the components that are needed in a house. With this same principle, it can be used to construct a cost model.
The hierarchical tree structure of the components of a house is describe in figures 2.12 to 2.16. It can be seen that the first level of components include site preparations,
I
-Level of detail
More
I `
foundations, walls, floors, roof, doors and windows, fixtures, plumbing, and electrical. The levels of the tree that follow give more information about the previous level. For example, the next level under foundations contains excavation, steel reinforcing, and concrete, which are the steps and items involved in the construction of the foundation of the house. The items in figures 2.12 to 2.16 enclosed by broken circles involve logic or
Figure 2.12: Hierarchical tree of the components of a low income house.
Figure 2.13: Hierarchical tree of the components of a low income house (cont.)
I I I I I I
-i
Ogj
tr
CL
CD
Figure 2.14: Hierarchical tree of the components of a low income house (cont.)
Figure 2.15: Hierarchical tree of the
house (cont.) components of a low income
1 r I r r r I I I r I I r
Figure 2.16: Hierarchical tree of the components of a low income house (cont.) I r c r r T _·r ~______-C I I I
I
2.3.3 The parametric part of the model
It was discussed in section 2.1 that in order to model the design and materials' takeoff of a house, the house needed to be broken into components. It was also discuss in section 2.3.1 that the area of the spaces involved in a low income house is closely related to the size of the lot it occupies. This relationship is expanded and explained in this section. The first step to develop equations that model the relationship is to recognize what are the spaces and dimensions required to model a house. It was determined earlier that these spaces and dimensions are the footprint area, the area of the bedrooms, the area of the bathrooms, the area of the living room, the area of the kitchen, the area of parking, and the total length of the walls.
A regression analysis was used to develop the equations needed. A linear and inverse relation were found to be the best fits. The regression was divided in two parts. The first part correlates the area of the lot to the foot print area of the house. The second part correlates the other spaces and dimensions to the foot print of the house. These spaces and dimensions, expressed as a function of the footprint in this step, are the area of the bedrooms, area of bathrooms, area of living rooms, area of the kitchen, area of porch, and linear meters of walls.
The data was collected from five different construction plans. The data is shown in table 2.2. The regression and curve fitting was done using SPSS for Windows, a statistical software.
Project Lot size Footprint Area of Area of Area of Area of Area of Lin.meters
bedrooms bathrooms kitchen iving room porch of walls (M-2) (M 2) (M2) (M2) (M 2) (M2) (M2) (M) Americ a 1 160.0 82.7 38.2 6.6 7.3 23.7 4.5 63.0 Pancalco 170.0 2.0 28.6 3.7 .8 26.3 4.8 62.1 Landa 192.0 72.8 31.6 3.6 7.2 24.0 5.0 58.5 tucasa 1 250.0 101.0 40.6 9.1 10.0 30.6 6.0 71.3 Altos de Panama 300.0 119.0 43.3 11.0 12.3 35.3 ._ 78.9
Table 2.2: Data collected from actual projects
The statistical analysis resulted in the following equations: Footprint = 21.3919 + .3177 * Lot Size Area of bedrooms = 64.7451 + (-2437.2 / Footprint) Area of bathrooms = 22.5116 + (-1354.3 / Footprint)
Area of Kitchen = -2.8236 + .1264 * Footprint Area of living room = 7.5934 +.2277 * Footprint
Area of porch = 0.4511 + .0570* Footprint Linear mts of walls = 30.9360 +.4002 * Footprint
Figures 2.17 to 2.23 show the graphs of the fitted data. Appendix A shows the output of the statistical results.
The parking area was not statistically determined because it could not be modeled into an equation. The parking area fits more into a step function. From the plans, an area of 15 square meters for each parking space was determined to be suitable. Therefore, the following IF THEN statement is used to model the area of the parking.
Area of parking: IF quality = 3 , Area of parking = 30 m2
If quality = 2 and footprint >100 m2, Area of parking = 30 m2, otherwise = 15 m2 ;
If quality = 1 Area of parking = 15 m2
.
It was also found that large houses have two bathrooms. Therefore, if the area of the bathroom is greater than 6 m2 then the number of bathrooms is equal to 2 otherwise the number of bathrooms is 1.
#of bathrooms: If Area of bathrooms > 6.0 m2 then # of bathrooms = 2. otherwise, # of bathrooms = 1.
Footprint Vs. Area of Lot
o Observed
o Linear
Area of Lot
Figure 2.17: Footprint vs. Area of the lot
Linear Meters of Walls Vs. Footprint
80 -r
Figure 2.18: Linear meters of wall vs. Footprint
70 1 70. m 4) .E ..1 60• r0 Observed 50 0 Linear 70 80 90 10o 110 120 Footprint
Figure 2.19: Area of the bathrooms vs. Footprint
Area of Bedrooms Vs. Footprint
46
-Figure 2.20: Area of bedrooms vs. Footprint
Area of Bathroom Vs. Footprint
Observed o Inverse 120 Footprint 44 -42 40 E 0 38 In 0 36 34 32 30 o Observed zI28 , Inverse 70 80 90 100 110 120 Footprint I120
Figure 2.21: Area of the Living rooms vs. Footprint
Area of Kitchen Vs. Footprint
13-Figure 2.22: Area of Kitchen vs. Footprint
Area of Living Room Vs. Footprint
0 Observed O Linear 80 90 100 110 Footprint 12- 11-S 10, 9 8. 7 6 13 ODservea 5, Linear 70 8) 90 100 110 120 Footprint '"'"
Arao iin omV. otrn
75 7.0-6.5 r-0 a. "- 6.0. 5.5 5.0 45 4.01 ____ 70 60 Footprint
Figure 2.23: Area of Porch vs. Footprint
Area of Porch Vs. Footprint
0U .^---120 o Observed 0 Linear > Footprint 12
2.3.4 The design based part of the model
Having determined the attributes of the spaces of the house, the decision on the selection of materials and the determination of material quantities is done. The best way to illustrate this is by analyzing each group of items separately. One can think as how a low income house is usually built and then model the process of estimating the amount of material needed for construction. For example, if a continuous footing supports the walls, then the length of the continuous footings is the same as the length of the walls. Then if the continuous footing is 0.3 meters wide and it is constructed 0.8 meters below grade, then the volume of excavation can be express as ( linear meters of walls * 0.8 *
0.3 ) cubic meters. Using the same approach, the volume of concrete needed can be estimated.
The following is a list of phases and items generally used in the construction of low income houses. Each phase is listed along with its items. The first four underlined letters are the item codes used in the Timberline database. An explanation for each individual item and how the design and takeoff were modeled is given.
1.00 Site work
1.1 Site Preparations:
Clea Clearing: This item comprehends all the clearing, grubbing, and possible tree removals from the soil. The total area of clearing is equal to the lot size.
2.00 Foundations:
2.1 Excavation:
Excv Footing trench excavation: The footings used in this type of construction are continuous. The trenches usually have a cross section of 0.4 X 0.8 meters. Because of the small depth of the excavation, no forms are required to cast the footing. The earth is used as the forms. The volume of excavation is equal to the linear meters of footings times the cross section of the excavation. The linear meters of footings is the same as the linear meters of walls, since the wall panels rest on the footings.
Footing trench excavation = Linear mts. of walls * (0.4 m X 0.8 m)
2.2 Reinforcing steel rods:
RS#3 Reinforced steel #3 Grade 60: The continuous footings are constructed with 2 #3 steel bars to prevent shrinking and cracking of the concrete. Therefore the total reinforcing steel can be calculated.
Reinforcing steel #3 grade 60 = Linear mts. of walls * 2 bars
2.3 Concrete
C30 Concrete 3000 psi: The footings are poured using 3000 psi concrete. The wall panels are embedded in the footings. The dimensions of the continuous footings are 0.4 meters deep and 0.4 meters wide. The cubic meters of concrete can be calculated as follows:
Concrete 3000 psi = Linear mts. of walls * (.4 m X .4 m )
3.00 Walls
3.1 Truss panels
Pann Truss Panels: The truss panels come in any lengths (8-40 feet) and 4 feet width. The Total quantity of truss panels needed for a house can be calculated from the total linear meters of walls. Then, the total area of truss panels can be calculated by multiplying the linear meters of walls by the average height plus the embedment length (2.7 + 0.8 meters).
Truss panels (M2) = Linear mts. of walls * 3.5 m
Tpwm Truss panel wire mesh: The wire mesh is use to tie the panels together before spraying the concrete. This wire mesh assures the continuity of the reinforcement. It is placed on both sides of every junction. The total linear meters of wire mesh can be estimated as 2 times the number of junctions times the average height of 3.5 meters.
Truss Panel Wire Mesh = 2 * 3.5 m * (Linear mts. of walls)/1.2192 m
Tpcu Truss Panel Cutting: The apertures of the windows need to be cut from the panels before spraying the panels with concrete. The openings are equal to the total area of windows. These openings have been found to be fixed in size because the number of windows do not vary. The total area is estimated to be 14.7 m2 or 47 linear
meters.
3.2 Shortcrete
Cemt Cement: This item is calculated from the area of truss panels. The area to be sprayed with cement and sand is two times the total area of the truss panels (both sides). Experience has shown that one sack of cement yields 3.3 square meters .
yard of sand
Sand Sand: See CEMT above. Experience has shown that one cubic yields 0.85 square meters.
Sce Shortcrete equipment: The equipment consists on a compressor and a mixer that prepares the concrete to be sprayed. Experience has shown that 200 square meters of panels can be sprayed per day. A house of a large size can be sprayed in two days. The rental cost of the equipment can be estimated to be one to three days using a productivity rate of 200 m2 per day.
4.00 Slabs
4.1 Slab on Grade
Comp Compaction: The total slab on grade area must be compacted. The total slab on grade area is estimated as:
SOG Area (m2) = Area of bathrooms + Area of kitchen + Area of living room + Area of porch + Area of bedrooms + Area of parking.
All the variables in the equation are described above. The Area of parking varies according to quality.
W4x4 SOG wire mesh: The type of wire mesh used in this type of slabs is a 4 x 4 (W 2.9 x W 2.9). The area of wire mesh is equal to the slab on grade area (above).
C40 Concrete 4000 psi: A 4000 psi concrete is used on the slab. The thickness of these slabs on grade are 10 cm. The total concrete volume is estimated as
Concrete 4000 psi = SOG area (m2 ) * (.1 m)
Wood Wood use to form the slab: Usually the slabs have a length to width ratio of 2:1. Therefore the total linear meters of wood could be estimated as
Wood for the SOG = 2* Sqrt (SOG area / 2) + 2 * Sqrt (2 * SOG area) The wood has a width of 0.1 meters.
5.00 Roof: The Area of roof is estimated to be equal to the SOG area if quality is equal to 3 but the parking area is subtracted if quality is equal to 1 or 2. This is because houses with low or medium quality do not have covered parking.
5.1 Roof Channels
assumption of the roof having a length to width ratio of 2:1 when quality is equal to 1 or 2 and a length to width ratio of 2.35 when quality is equal to 3 was used. This is because the roof is longer when it covers the parking area, as is the case when quality is equal to 3. Also the channels span the roof from side to side on the short direction as simple beams with a spacing of 1.5 meters. The section modules (S) equation derived from the geometry of the roof and the imposed loads came out to be
S (in3) = Area of the roof / Roof 1/w ratio * .1625 where the area of the roof is in m2.
Based on the range of the lots on which this model works, the following channels (items) can be chosen:
6X4.4 8X6.5 10X7.5 10X8 10X9 12X10 12X11 M 6X4.4 M 8X6.5 M 10X7.5 M 10X8 M 10 X9 M 12X10 M 12X11 S=2.4 S=4.62 S=6.57 S=6.94 S=7.76 S=10.3 S=12 (in3)
The number of channels to be used is estimated as the length of the roof divided by 1.5 meter (spacing) plus one. Their length is equal to the number of channels times the width of the roof.
Number of channels = ( Sqrt (Roof 1/w ratio * Area of roof) /1.5) + 1
Total Igt of Channels = Number of channels * ( Sqrt (Area of roof / Roof 1/w ratio ))
- ~ " " '
5.2 Insulation:
insl Fiber glass insulation: The quantity is equal to the area of the roof excluding the parking area.
wire Insulation wire: This quantity in linear meters is estimated using the length to width ratio of 2:1.
Insulation wire = (Sqrt (Area of roof q2,1 / 2) / 1 + 1) * Sqrt (2 Area of roof q2,1) +
(Sqrt (2 * Area of roof q2,1 ) / 1 +1)* Sqrt(Area of roof q2,1 / 2)
5.3 Zinc Roof: The roof on this type of houses is made out of 24 or 26 gauge zinc. In this model, 26 gauge zinc will be used unless quality is equal to 3 were 24 gauge zinc will be use to reflect higher quality. The area of zinc to be used is estimated to be equal to the roof area.
Z24 Zinc 24 gauge
Z26 Zinc 26 gauge
5.4 Suspended Ceiling:
Sti3 Suspended ceiling tile (3/4"x2'x2') Sti2 Suspended ceiling tile (5/8"x2'x2')
Stil Suspended ceiling tile (5/8"x2'x4')
The area of the suspended ceiling tiles is equal to the area of the roof minus the parking area if covered. The number of tiles needed is equal to the area of the roof divided by the area of the tile. The different type of tiles reflect the quality of the house.
For example, Sti3 is used on quality 3, Sti2 is used on quality 2, and Stil is used on quality 1.
Lrai Aluminum rails (long direction)
The linear meters of aluminum tee rails in the long direction can be estimated as the area of the roof divided by the area of the chosen tile times the dimension of the long side of the tile. This tee is more expensive than the short dimension tee because they have to be cut into individual pieces. They run on the long side of the tiles.
Length of Lrai (m) = Area of roof q2,1 / Area of ceiling tile * long side of ceiling tile
Srai Aluminum rails (short direction)
The linear meters of this item can be calculated as the area of the roof with suspended ceiling divided by the area of the tile times the short length of the tile chosen.
Length of Srai (m) = Area of roof q2,1 / Area of ceiling tile * short side ceil tile
Erai Aluminum edge rails
It was found that interior walls represent about 45% of the total walls. Since the edge rails are attached to the top edge on each side of the interior walls and to the top edge on one side of the exterior walls, the linear meters of edge rails are estimated to be equal to the linear meters of walls times 1.45.
Wire Iron wire for suspended ceiling
The wire is used to hang the rails to the roof. The normal spacing of the hooks is 1 m. The average length of the wires is 30 cm. Therefore the linear meters of wire is estimated to be equal to the number of hooks times 30 cm.
Hook Hooks for suspended ceiling
The number of hooks to be used is estimated as the linear meters of tee rail in the short direction of the tile (Srai) divided by the spacing of the hooks. The spacing of the hooks is normally 1 m.
Hooks for suspended ceiling = Length of Srai (m) / 1 m.
6.00 Doors and Windows: It was observed from the different plans that all the houses have almost the same type of windows and doors. Variation on quantities were related to the quality level. Also the doors can be solid or hollow core also depending on the quality level.
6.1 Doors: There are two types of doors. The solid door and the hollow core door. For a house of quality 3 all the doors are solid.
Sdta Solid Door 1 X 2.1 meters If quality is equal to 1 or 2 then use 1 unit , if quality is equal to 3 then 2 units.
if quality is equal to 3 then 3 units.
Hdtb Hollow Door 0.9 X 2.1 meters If quality is equal to 1 then 3 units, if quality is equal to 2 then 4 units.
Sdtc Solid Door 0.7 X 2.1 meters If quality is equal to 1 or 2 then 0, if quality is equal to 3 then the number of doors equals the number of baths.
Hdtc Hollow Door 0.7 X 2.1 meters If quality is equal to 1 or 2 then the number of doors is equal to the number of baths, if quality is equal to 3 then 0.
Bdtd Shower Door 0.6 X 2.0 meters Use one shower door for every bathroom.
6.2 Windows:
The choice of windows is fixed because it was observed that in all the houses the position of the windows and the number were almost the same.
There is one window 0.9 X 0.61 meters for every bathroom, one window 1.8 X 1.24 meters for every room (3 rooms), 2 window 1.2 X 1.60 meters and one window 1.8 X 1.24 meters for the living room, and one window 1.3 X 1.06 meters for the kitchen.
WTA Window 1.2 X 1.60 meters (2) WTB Window 1.8 X 1.24 meters (4) WTC Window 1.3 X 1.06 meters (1) WTD Window 0.9 X 0.61 meters (1 or 2)
7.00 Floor Finishes
7.1 Carpeting: The rooms will have carpet if they are quality 2 or 3. Houses with quality 1 will have smooth cement finish on all the floors (except on the bathroom).
Car3 Room Carpet (Quality 3) Car2 Room Carpet (Quality 2)
The quantity of carpet is estimated to be equal to the area of the rooms.
7.2 Tile: Til3 Til2 Tib3 Tib2 Tilp Tik3 Tik2 Ceme
Tile for the living room (Quality 3) Tile for the living room (Quality 2) Tile for the bathroom floor (Quality 3) Tile for the bathroom floor (Quality 1 or 2) Tile for the porch (Quality 3)
Tile for the kitchen floor (Quality 3) Tile for the kitchen floor (Quality 2) Cement used for tile installation Sand Sand used for tile installation
The quantities of these items can be estimated to be equal to the area where they will be installed (living room, bathroom, porch, or kitchen depending on individual cases). The cement quantity will be the total amount use for the installation of the tiles (i.e. the