HAL Id: hal-01202668
https://hal-mines-paristech.archives-ouvertes.fr/hal-01202668
Submitted on 29 Sep 2015HAL is a multi-disciplinary open access archive for the deposit and dissemination of sci-entific research documents, whether they are pub-lished or not. The documents may come from teaching and research institutions in France or abroad, or from public or private research centers.
L’archive ouverte pluridisciplinaire HAL, est destinée au dépôt et à la diffusion de documents scientifiques de niveau recherche, publiés ou non, émanant des établissements d’enseignement et de recherche français ou étrangers, des laboratoires publics ou privés.
Isothermal phase (vapour + liquid) equilibrium data for
binary mixturesof propene (R1270) with either
1,1,2,3,3,3-hexafluoro-1-propene (R1216) or
2,2,3-trifluoro-3-(trifluoromethyl)oxirane in the
temperature range of (279 to 318) K range.
Shalendra Clinton Subramoney, Wayne Michael Nelson, Xavier Courtial,
Paramespri Naidoo, Christophe Coquelet, Dominique Richon, Deresh
Ramjugernath
To cite this version:
Shalendra Clinton Subramoney, Wayne Michael Nelson, Xavier Courtial, Paramespri Naidoo, Christophe Coquelet, et al.. Isothermal phase (vapour + liquid) equilibrium data for binary mix-turesof propene (R1270) with either 1,1,2,3,3,3-hexafluoro-1-propene (R1216) or 2,2,3-trifluoro-3-(trifluoromethyl)oxirane in the temperature range of (279 to 318) K range.. Journal of Chemical Thermodynamics, Elsevier, 2015, 90, pp.100-105. �10.1016/j.jct.2015.06.017�. �hal-01202668�
Isothermal vapor-liquid equilibrium data for
binary mixtures of propene (R1270) with either
1,1,2,3,3,3-hexafluoro-1-propene (R1216) or
2,2,3-trifluoro-3-(trifluoromethyl)oxirane in the
(279 to 318) K range.
Shalendra Clinton Subramoneya, Wayne Michael Nelsona, *, Xavier Courtiala, Paramespri Naidooa, Christophe Coqueleta,b, Dominique Richona,c and Deresh Ramjugernatha,
a
Thermodynamics Research Unit, School of Engineering, University of KwaZulu-Natal, Howard College Campus, Durban, South Africa
b
MINES ParisTech, CTP - Centre Thermodynamique des Procédés, 35 Rue Saint Honoré, 77305 Fontainebleau Cedex, France
c
FiDiPro, Department of Biotechnology and Chemical Technology, Aalto University, Kemistintie 1, PO Box 16100, Fi-00076 Aalto, Finland
*Corresponding author: E-mail: nelsonw@ukzn.ac.za; Tel.: +27 31 2603121; Fax: +27 31 2601118
Abstract
Isothermal vapor-liquid equilibrium data (P-x-y) are presented for the 1-propene +1,1,2,3,3,3-hexafluoroprop-1-ene and the 1-propene + 2,2,3-trifluoro-3-(trifluoromethyl)oxirane binary systems. Both binary systems were studied at five temperatures, ranging from (279.36 to 318.09) K, at pressures up to 2 MPa. The experimental vapor-liquid equilibrium data were measured using an apparatus based on the "static-analytic" method incorporating a single movable Rapid On-Line Sampler-Injector to sample the liquid and vapor phases at
equilibrium. The expanded uncertainties are approximated on average as 0.07 K, 0.008 MPa, and 0.007 and 0.009 for the temperature, pressure, and both the liquid and vapor mole
fractions, respectively. A homogenous maximum-pressure azeotrope was observed for both binary systems at all temperatures studied. The experimental data were correlated with the Peng-Robinson equation of state using the Mathias-Copeman alpha function, paired with the Wong-Sandler mixing rule and the Non-Random Two Liquid activity coefficient model. The model provided very satisfactory representation of the phase equilibrium data measured.
1. Introduction
This study is part of an on-going research programme investigating the thermodynamic properties of fluorocarbons and their mixtures [1; 2; 3; 4; 5; 6], and more specifically isothermal phase behaviour for binary mixtures involving either 1,1,2,3,3,3-hexafluoroprop-1-ene or 2,2,3-trifluoro-3-(trifluoromethyl)oxirane [6; 7; 8; 9; 10; 11; 12]. Vapor-liquid equilibrium (VLE) data play an integral part in the design process of numerous unit operations and chemical processes. Furthermore, VLE data is a core necessity for the development and validation of correlative and predictive thermodynamic models. Accordingly, accurate VLE data are required for the calculation of interaction energies between functional groups for group contribution methods such as PSRK [13].
VLE data were measured for the binary systems of propene (R1270) +
1,1,2,3,3,3-hexafluoroprop-1-ene (R1216), and R1270 + trifluoro-3-(trifluoromethyl)oxirane. Trifluoro-3-(trifluoromethyl)oxirane is more commonly known as hexafluoropropylene oxide (HFPO). To the best of our knowledge no VLE data have been published for the R1270 + HFPO binary system, and thus, all data presented herein for this system are new data. Concerning the R1270 + R1216 binary system, isothermal VLE data have been measured by Coquelet et
al. [6] in the temperature range from (263.17 to 353.14) K. The data corresponding to this
work were measured within same temperature range but at different isothermal conditions. Consequently, they may considered as useful complementary data. These two binary systems exhibit homogenous pressure-maximum (positive) azeotropes within the investigated
temperature range. The new experimental data were correlated with the Peng-Robinson (PR) [14] equation of state (EoS) integrating the Mathias-Copeman (MC) alpha function [15], the Wong-Sandler (WS) mixing rule [16] and the Non-Random Two Liquid (NRTL) activity coefficient model [17].
2. Experimental
2.1 Materials
Propene was supplied by Air Products (South Africa) with a certified purity greater than 0.9995 in volume fraction. 1,1,2,3,3,3-Hexafluoro-1-propene and 2,2,3-Trifluoro-3-(trifluoromethyl)oxirane were supplied by Pelchem (South Africa) with a certified purity greater than 0.999 in volume fraction. Apart from degassing via periodic vapor withdrawal, no further purification was undertaken. Gas chromatographic (GC) analysis is a classical method to validate the purities of each component. Unfortunately, all the impurities in each “pure” component are not known, and thus exact quantification was not possible. However, by GC analysis with a thermal conductivity detector (TCD) one can determine the ratio of peak areas of the impurities to the “pure” compound and thus give an indication of the purity of the sample. The Chemical Abstract Service (CAS) numbers, critical properties and
molecular formulae of the relevant compounds are listed in table 1.
2.2 Apparatus
The apparatus used for the phase equilibrium measurements has been described in detail in previous works [10; 18], and thus, will only be discussed briefly herein. The apparatus follows the principle of the "static-analytic" method, and is conceptually similar to that of Laugier and Richon [19] and Valtz et al. [20]. The equilibrium cell (60 cm3) is constructed of
stainless steel 316 and is equipped with two sapphire sights. Isothermal conditions are attained by submerging the equilibrium cell into a thermo-regulated liquid solution. The temperature of this liquid solution is controlled via a immersion circulator (Grant; GR 150). The liquid phase within the equilibrium cell is agitated via a Teflon-coated magnetic stirrer bar driven by an external rotating magnet using a variable speed stirring device (Heidolph; RZR 2021).
The temperature within the equilibrium cell was measured by two 100 Ω platinum resistance thermometer (Pt100) probes inserted into cavities located at the top and base of the
equilibrium cell respectively. The pressure within the equilibrium cell was measured via a 0 - 10 MPa gauge transmitter (WIKA; P-10). The pressure transmitter was housed within a thermo-regulated aluminium block, to ensure that fluctuations in the ambient temperature would not influence the output signal of the pressure transmitter. The line connecting the pressure transmitter to the equilibrium cell was heat-traced as it protrudes above the thermo-regulated liquid solution.
The signals from both the Pt100 probes and the pressure transmitter are recorded in real-time via a data acquisition unit (Agilent ; HP 34970A). Samples of both the liquid and vapor phases are withdrawn individually from the equilibrium cell via a single mobile Rapid On-Line Sampler-Injector (ROLSITM) [21]. The vaporized samples are transferred directly to the
GC (Shimadzu; GC-17A) using a carrier gas (helium). The lines connecting the ROLSITM to
the GC are heat-traced to ensure that the sample flushed to the GC remains homogenous. The GC is fitted with a stainless steel 316 packed column (Porapak Q, 3 m in length) and
equipped with a TCD. Chromatograph peak analyses and integrations are performed using GC solutions V. 2.3 (Shimadzu).
2.3 Calibrations
The Pt100 probes were calibrated against a standard CTH 6500 calibration unit (WIKA). The P-10 pressure transmitter was calibrated against a CPH 6000 reference transmitter (WIKA). The reference instruments (CTH 6500 and CPH 6000) were calibrated by WIKA. The response of the TCD was calibrated by injecting known amounts of each component (direct injection method) via gastight syringes (SGE Analytic Science). The volumes of the gaseous components injected into the GC for calibration of the TCD ranged from 100 μL to 1 mL. The volume of injected gas was converted to the number of moles of component using the
ideal gas equation. The pressure and temperature of the injected gas were assumed to be equal to the ambient conditions.
2.4 Experimental procedure
The loading lines and equilibrium cell were evacuated and the heavier component (R1216 or HFPO) was introduced first. Then the lighter component, propene, was subsequently charged into the equilibrium cell corresponding to the desired pressure for the first measurement. The cell contents were agitated, to ensure attainment of equilibrium. The line connecting the pressure transmitter to the equilibrium cell was heated to a temperature ten degrees above the cell temperature. Phase equilibrium was assumed to have been reached when the pressure readings stabilized, i.e. the pressure was constant for a period of at least 10 minutes, within the uncertainty of measurement. At equilibrium, both the vapor and liquid phases were sampled individually using the ROLSITM. At least five samples for both the liquid and the
vapor phases were analysed to check for measurement repeatability. Further equilibrium mixtures were prepared by adding additional amounts of propene; the abovementioned sampling procedure was repeated for each new mixture at equilibrium. The full procedure was repeated for the measurement of each P-x-y isotherm.
2.5 Experimental uncertainty
The estimation of experimental uncertainty has been detailed in communications by the National Institute of Standards and Technology (NIST) [22]. Furthermore, we have described in detail the procedures used to estimate the uncertainty with regard to VLE measurements in our previous work [12]. Briefly, the uncertainties are combined were necessary via the law of
propagation of errors, which is based on a first-order Taylor series approximation [22]. The
standard uncertainties for the variables in question are listed in table 2. The combined uncertainties 𝑢 𝜃𝑖 were converted to the combined expanded uncertainties 𝑈 𝜃𝑖 by
pressure are: U(T) = 0.07 K and U(P) = 0.008 MPa respectively. Regarding phase composition, the expanded uncertainty for the liquid and vapor phase compositions were estimated on average as: U(x) = 0.007 and U(y) = 0.009.
2.6 Data treatment
Modeling of the high-pressure VLE data was undertaken using in-house thermodynamic software developed at the Mines ParisTech CTP laboratory [23]. The experimental data were regressed using the symmetric phi-phi approach, by coupling the PR equation of state with the NRTL activity coefficient model and WS mixing rule. The representation of vapor pressures with the PR-EoS was improved using the MC alpha function. Regression of the VLE data involves the adjustment of three binary interaction parameters; two associated with the NRTL activity coefficient model (τ12, τ21), and one associated with the WS mixing rule
(k12). The NRTL parameters (τ12, τ21) arethose originally proposed by Renon and Prausnitz
[17]:
𝜏𝑖𝑗 =𝑔𝑖𝑗 −𝑔𝑗𝑗
𝑅𝑇 (2)
In order to reduce the number of parameters correlated, the non-randomness parameter α of the NRTL model was set to 0.3. The remaining model parameters were adjusted to the VLE data using a flash-type objective function, as the largest uncertainty is associated with both the vapor and liquid phase compositions. The flash-type objective function is:
𝐹 = 100 𝑁𝑝 𝑥𝑒𝑥𝑝−𝑥𝑐𝑎𝑙 𝑥𝑒𝑥𝑝 2 𝑁𝑝 1 + 𝑦𝑒𝑥𝑝−𝑦𝑐𝑎𝑙 𝑦𝑒𝑥𝑝 2 𝑁𝑝 1 (3)
where Np is the number of data points, x and y are the liquid and vapor phase compositions
respectively, and the subscripts exp and cal denote the measured and calculated quantities. The objective function was minimized and the model parameters adjusted using the Levenberg-Marquardt algorithm [24]. We statistically analyze the quality of the data-fit using
the average absolute deviation (AAD), average absolute relative deviation (AARD) and the Bias. The AAD is:
𝐴𝐴𝐷 𝜃 = 1
𝑁𝑝 𝜃 𝑒𝑥𝑝 − 𝜃 𝑐𝑎𝑙𝑐
𝑁𝑝
1
(4)
where 𝜃 𝑒𝑥𝑝 and 𝜃 𝑐𝑎𝑙𝑐 are the experimental and calculated values of a measurand 𝜃 (in this case x1 and y1), and Np is the total number of data points. The AARD and Bias are defined as:
𝐴𝐴𝑅𝐷 𝜃 = 1 𝑁𝑝 𝜃 𝑒𝑥𝑝 − 𝜃 𝑐𝑎𝑙𝑐 𝜃 𝑒𝑥𝑝 𝑁𝑝 1 (5) 𝐵𝑖𝑎𝑠 𝜃 = 1 𝑁𝑝 𝜃 𝑒𝑥𝑝 − 𝜃 𝑐𝑎𝑙𝑐 𝜃 𝑒𝑥𝑝 𝑁𝑝 1 (6)
3. Results and discussion
Experimental vapor pressure data for R1270 are reported in table 3. The P-T data were modelled using the PR equation of state with the MC alpha function. The deviations of the data correlated by the model from experimental data are listed in table 3. The model accurately represents the vapor pressure data for R1270. The experimental vapor pressure data for R1270 were also compared to reference values from REFPROP [25], the resulting average absolute deviation for pressure is 0.33%.
P-x-y data are reported for the binary system of R1270 (1) + R1216 (2) at five temperatures, T = (288.07, 293.09, 299.47, 308.09 and 318.09) K in table 4. P-x-y data are reported for the
binary system of R1270 (1) + HFPO (2) at five temperatures, T = (279.36, 288.19, 298.35, 308.18 and 317.12) K in table 5. Positive deviation from Raoult’s law is observed for both binary systems, resulting in the formation of pressure-maximum azeotropes for all of the measured isotherms (figures 1 and 2). The previously measured P-x-y data of Coquelet et al. [6] for the binary system of R1270 (1) + R1216 (2) at 293.12 K are plotted and compared to our experimental data at 293.09 K in figure 1. The data agree with that of Coquelet et al. [6] to within the experimental uncertainties.
The model parameters and deviations between the experimental and modelled data using the PR equation of state coupled with the WS mixing rule and NRTL activity coefficient model are listed in table 6. The model parameters were fitted, firstly, individually to each isothermal data of each binary system, and secondly, simultaneously to data of all isotherms of each binary system respectively. The latter is more useful as it results in a single set of model parameters which can be used to describe all measured isotherms for a particular system in this study. The model parameters as well as the AAD, AARD and Bias are listed in table 6. The performance of the model is similar for both systems; an average AAD of approximately 0.003 for both the liquid and vapor phase compositions is achieved. For comparison, we
present P-x-y data predicted for the binary system of R1270 (1) + R1216 (2) using model parameters regressed from the data measured by Coquelet et al. [6]. Although, there is slight disagreement between the data, the data agrees to within the experimental uncertainty. The calculated azeotropic compositions and pressures for both binary systems are given in table 7. The azeotropic conditions agree well with those defined by Coquelet et al. [6]. Lastly, the relative volatility plots are displayed in figures 3 and 4 for the R1270 (1) + R1216 (2) and R1270 (1) + HFPO (2) binary systems respectively.
Conclusion
P-x-y data are reported for binary mixtures of propene with either
1,1,2,3,3,3-hexafluoroprop-1-ene or 2,2,3-trifluoro-3-(trifluoromethyl)oxirane at temperatures ranging from (279.36 to 318.09) K. The two binary systems exhibit a pressure-maximum azeotrope at all measured temperatures. The data are well correlated using a single set of binary interaction parameters across the entire temperature range for each system using the Peng-Robinson equation of state including the Mathias-Copeman alpha function, the Wong-Sandler mixing rule and the Non-Random Two Liquid activity coefficient model.
References
[1] C. Coquelet, D. Ramjugernath, H. Madani, A. Valtz, P. Naidoo, A.H. Meniai, J. Chem. Eng. Data 55 (2010) 2093-2099.
[2] M. Dicko, G. Belaribi-Boukais, C. Coquelet, A. Valtz, F.B. Belaribi, P. Naidoo, D. Ramjugernath, Ind. Eng. Chem. Res. 50 (2011) 4761-4768.
[3] E. El Ahmar, A. Valtz, P. Naidoo, C. Coquelet, D. Ramjugernath, J. Chem. Eng. Data 56 (2011) 1918-1924.
[4] A. Valtz, X. Courtial, E. Johansson, C. Coquelet, D. Ramjugernath, Fluid Phase Equilib. 304 (2010) 44-51.
[5] D. Ramjugernath, A. Valtz, C. Coquelet, D. Richon, J. Chem. Eng. Data 54 1292-1296.
[6] C. Coquelet, A. Valtz, P. Naidoo, D. Ramjugernath, D. Richon, J. Chem. Eng. Data 55 (2010) 1636-1639.
[7] S.C. Subramoney, A. Valtz, C. Coquelet, D. Richon, P. Naidoo, D. Ramjugernath, J. Chem. Thermodyn. 61 (2013) 18-26.
[8] W.M. Nelson, S.C. Subramoney, A. Valtz, C. Coquelet, D. Richon, P. Naidoo, D. Ramjugernath, J. Chem. Eng. Data. 56 (2011) 74-78.
[9] S.C. Subramoney, W.M. Nelson, A. Valtz, C. Coquelet, D. Richon, P. Naidoo, D. Ramjugernath, J. Chem. Eng. Data 55 (2010) 411-418.
[10] S.C. Subramoney, X. Courtial, P. Naidoo, C. Coquelet, D. Richon, D. Ramjugernath, Fluid Phase Equilib. 353 (2013) 7-14.
[11] S.C. Subramoney, A. Valtz, C. Coquelet, D. Richon, P. Naidoo, D. Ramjugernath, J. Chem. Eng. Data 57 (2012) 2947-2955.
[12] W.M. Nelson, M. Williams-Wynn, S.C. Subramoney, D. Ramjugernath, J. Chem. Eng. Data 60 (2015) 568-573.
[13] B. Holderbaum, J. Gmehling, Fluid Phase Equilib.70 (1991) 251-265. [14] D.Y. Peng, D.B. Robinson, Ind. Eng. Chem. Fundam. 15 (1976) 59-64. [15] P.M. Mathias, T.W. Copeman, Fluid Phase Equilib. 13 (1983) 91-108. [16] D.S.H. Wong, S.I. Sandler, AIChE J. 38 (1992) 671-680.
[17] H. Renon, J.M. Prausnitz, AIChE J. 14 (1968) 135-144.
[18] M.M. Tshibangu, High pressure vapor-liquid equilibrium data of fluorochemical systems for various temperatures using a new static apparatus, M.Sc. Thesis, Chemical Engineering, University of KwaZulu-Natal, South Africa, 2010.
[19] S. Laugier, D. Richon, Rev. Sci. Instrum. 57 (1986) 469-472.
[20] A. Valtz, C. Coquelet, A. Baba-Ahmed, D. Richon, Fluid Phase Equilib. 202 (2002) 29-47.
[21] P. Guilbot, A. Valtz, H. Legendre, D. Richon, Analusis 28 (2000) 426-431.
[22] P.J. Mohr, B.N. Taylor, D.B. Newell, "The 2010 CODATA Recommended Values of the Fundamental Physical Constants" (Web Version 6.0), Available:
http://physics.nist.gov/constants, National Institute of Standards and Technology, Gaithersburg, MD 20899, 2011.
[23] C. Coquelet, A. Baba-Ahmed, THERMOPACK version 1.10, 2005. [24] D.W. Marquardt, J. Soc. Ind. Appl. Math. 11 (1963) 431-441.
[25] E.W. Lemmon, M.L. Huber, M.O. McLinden, Reference Fluid Thermodynamic and Transport Properties (REFPROP), NIST Standard Reference Database 23, Physical and Chemical Properties Division, National Institute of Standards and Technology, Gaithersburg, 2007.
[26] C. Coquelet, D. Ramjugernath, H. Madani, P. Naidoo, A.H. Meniai, J. Chem. Eng. Data 55 (2010) 2093 - 2099.
Acknowledgements
This work is based upon research supported by the National Research Foundation of South Africa under the South African Research Chair Initiative of the Department of Science and Technology.
TABLE 1
Pure-component parameters and properties for propene (R1270), hexafluoropropylene (R1216) and hexafluoropropylene oxide (HFPO).
R1270[6] R1216 [26] HFPO[2]
Component characterization
CAS no. 115-07-1 116-15-4 428-59-1
Molecular formula C3H6 C3F6 C3F6O
Supplier and purity 99.95 (Air Products) 99.9 (Pelchem) 99.9 (Pelchem)
GC Area >99.95 >99.9 >99.9
Purification method Degassed Degassed Degassed
Critical properties and acentric factor
Tc (K) 364.9 358.9 359.3 Pc (MPa) 4.600 3.136 2.931 ω 0.1376 0.3529 0.3338 Matthias-Copeman (MC) coefficients c1 0.6920a 0.8926 0.8749b c2 -2.105 -0.5100 -0.3222 c3 11.253 3.1585 1.422 a
MC parameters for R1270 regressed from our experimental vapor pressure data.
b
TABLE 1
Standard uncertainty estimates and influences for the variables (pressure (P), temperature (T) and the liquid (x) and vapour (y) phase compositions) of this work.
source of uncertainty estimatea distribution influence
P from CPH 6000 /kPa 0.2 rectangular P
correlation for P/kPa 8 rectangular P
T from CTH 6500/K 0.02 rectangular T
correlation for T/K 0.05 rectangular T
correlation for nof R-1270b 1.5 % rectangular x, y
correlation for nof R-1216b 1.5 % rectangular x, y
correlation for nof HFPOb 2.0 % rectangular x, y
Volume of injected gas from syringec 2 % rectangular x, y
T of injected gas from syringec /K 2 rectangular x, y
P of injected gas from syringec /kPa 1 rectangular x, y
repeatability (average) of xi 𝜎 𝑥 = 0.002 Gaussian x repeatability (average) of yi 𝜎 𝑦 = 0.002 Gaussian y
a Estimate treated as either a type A or type B distribution
b Correlation of the number of moles (n) versus TCD peak area obtained by injecting known
volumes of gas.
TABLE 2
Experimental vapor pressure data for R1270, including a comparison of the data to REFPROP [25] and data fitted to the PR equation of state using the MC alpha function.
REFPROP/MPa PR-MC/MPa
Texp/K Pexp/MPa Pcal/MPa ΔP/MPaa (ΔP/Pexp)/% Pcal/MPa ΔP/MPaa (ΔP/Pexp)/%
282.97 0.769 0.775 -0.006 -0.78 0.768 0.001 0.07 287.57 0.873 0.878 -0.005 -0.57 0.875 -0.002 -0.19 293.48 1.028 1.026 0.002 0.24 1.025 0.003 0.27 298.02 1.152 1.151 0.002 0.13 1.152 0.000 0.01 302.83 1.291 1.295 -0.004 -0.29 1.298 -0.007 -0.50 307.67 1.458 1.453 0.005 0.36 1.456 0.002 0.14 314.06 1.691 1.683 0.008 0.50 1.685 0.006 0.35 318.36 1.854 1.852 0.003 0.15 1.853 0.001 0.06 322.91 2.039 2.043 -0.004 -0.21 2.044 -0.004 -0.22 327.27 2.239 2.240 -0.002 -0.08 2.239 0.000 -0.02 a ∆𝑃 = 𝑃
𝑒𝑥𝑝 − 𝑃𝑐𝑎𝑙, where 𝑃𝑒𝑥𝑝 and 𝑃𝑐𝑎𝑙 are the experimental and calculated vapor pressures respectively.
TABLE 3
Experimental P-x-y data, including the temperature (T), pressure (P) and the liquid and vapour phase compositions (x1 and y1), for the binary system of R1270 (1) + R1216 (2) and
the combined expanded uncertainty (U) (k = 2) for x1 and y1.
T/K P/MPa x1 y1 U(x1) U(y1)
288.07 0.627 0.076 0.182 0.003 0.006 288.07 0.723 0.193 0.359 0.007 0.010 288.07 0.801 0.298 0.468 0.009 0.011 288.07 0.862 0.421 0.562 0.011 0.011 288.07 0.915 0.589 0.665 0.011 0.010 288.07 0.932 0.684 0.723 0.009 0.009 288.07 0.938 0.802 0.797 0.007 0.007 288.07 0.929 0.896 0.876 0.004 0.005 288.07 0.906 0.960 0.943 0.002 0.002 293.09 0.734 0.089 0.199 0.004 0.007 293.09 0.821 0.182 0.334 0.006 0.010 293.09 0.891 0.261 0.421 0.008 0.011 293.09 0.932 0.320 0.471 0.009 0.011 293.09 0.972 0.391 0.532 0.010 0.011 293.09 1.021 0.512 0.612 0.011 0.010 293.09 1.069 0.692 0.722 0.009 0.009 293.09 1.072 0.792 0.788 0.007 0.007 293.09 1.066 0.870 0.848 0.005 0.006 293.09 1.042 0.939 0.921 0.003 0.003 299.47 0.854 0.072 0.153 0.003 0.006 299.47 0.939 0.141 0.266 0.005 0.008 299.47 0.982 0.182 0.320 0.006 0.009 299.47 1.042 0.241 0.388 0.008 0.010 299.47 1.092 0.303 0.446 0.009 0.011 299.47 1.142 0.371 0.505 0.010 0.011 299.47 1.204 0.491 0.590 0.011 0.011 299.47 1.218 0.521 0.610 0.011 0.010 299.47 1.266 0.831 0.816 0.006 0.007
299.47 1.238 0.930 0.910 0.003 0.004 308.09 1.134 0.112 0.210 0.004 0.007 308.09 1.242 0.203 0.328 0.007 0.009 308.09 1.333 0.290 0.416 0.009 0.011 308.09 1.432 0.405 0.512 0.010 0.011 308.09 1.512 0.537 0.610 0.011 0.010 308.09 1.551 0.692 0.714 0.009 0.009 308.09 1.556 0.832 0.815 0.006 0.007 308.09 1.539 0.896 0.869 0.004 0.005 308.09 1.511 0.953 0.933 0.002 0.003 318.09 1.423 0.096 0.173 0.004 0.006 318.09 1.542 0.178 0.277 0.006 0.009 318.09 1.692 0.291 0.401 0.009 0.010 318.09 1.852 0.457 0.538 0.011 0.011 318.09 1.950 0.642 0.670 0.010 0.010 318.09 1.965 0.711 0.721 0.009 0.009 318.09 1.964 0.803 0.790 0.007 0.007 318.09 1.948 0.862 0.841 0.005 0.006 318.09 1.916 0.924 0.901 0.003 0.004
TABLE 4
Experimental P-x-y data, including the temperature (T), pressure (P) and the liquid and vapour phase compositions (x1 and y1), for the binary system of R1270 (1) + HFPO (2) and
the combined expanded uncertainty (U) (k = 2) for x1 and y1.
T/K P/MPa x1 y1 U(x1) U(y1)
279.36 0.643 0.243 0.448 0.008 0.011 279.36 0.690 0.354 0.516 0.010 0.011 279.36 0.719 0.445 0.566 0.012 0.011 279.36 0.737 0.516 0.605 0.012 0.011 279.36 0.755 0.617 0.661 0.011 0.010 279.36 0.763 0.698 0.708 0.010 0.010 279.36 0.764 0.759 0.745 0.009 0.009 279.36 0.755 0.860 0.816 0.006 0.007 279.36 0.749 0.891 0.842 0.004 0.006 279.36 0.736 0.931 0.882 0.004 0.005 279.36 0.723 0.962 0.918 0.002 0.004 288.19 0.694 0.104 0.282 0.004 0.009 288.19 0.759 0.156 0.349 0.006 0.010 288.19 0.823 0.238 0.419 0.008 0.011 288.19 0.867 0.320 0.470 0.010 0.012 288.19 0.904 0.399 0.520 0.011 0.011 288.19 0.941 0.508 0.583 0.012 0.011 288.19 0.963 0.586 0.637 0.011 0.010 288.19 0.975 0.655 0.682 0.010 0.010 288.19 0.970 0.836 0.805 0.006 0.007 288.19 0.963 0.863 0.828 0.005 0.007 288.19 0.956 0.886 0.852 0.005 0.006 288.19 0.928 0.949 0.918 0.002 0.004 298.35 0.814 0.050 0.164 0.002 0.006 298.35 0.890 0.091 0.241 0.004 0.008 298.35 0.975 0.151 0.318 0.006 0.010 298.35 1.057 0.237 0.390 0.008 0.011 298.35 1.119 0.314 0.449 0.010 0.011
298.35 1.187 0.425 0.523 0.011 0.011 298.35 1.243 0.553 0.611 0.012 0.011 298.35 1.273 0.717 0.722 0.009 0.009 298.35 1.259 0.841 0.823 0.006 0.007 298.35 1.253 0.869 0.840 0.005 0.006 298.35 1.232 0.913 0.889 0.004 0.004 308.18 1.230 0.149 0.289 0.006 0.009 308.18 1.297 0.201 0.336 0.007 0.010 308.18 1.363 0.265 0.386 0.009 0.011 308.18 1.446 0.356 0.453 0.010 0.011 308.18 1.543 0.495 0.555 0.012 0.011 308.18 1.584 0.583 0.622 0.011 0.011 308.18 1.606 0.659 0.683 0.010 0.010 308.18 1.598 0.822 0.810 0.007 0.007 308.18 1.592 0.849 0.827 0.006 0.007 308.18 1.584 0.861 0.845 0.005 0.006 308.18 1.558 0.908 0.894 0.004 0.005 308.18 1.536 0.945 0.927 0.002 0.003 317.12 1.363 0.082 0.175 0.005 0.007 317.12 1.519 0.160 0.272 0.006 0.009 317.12 1.661 0.265 0.359 0.009 0.010 317.12 1.752 0.337 0.421 0.010 0.011 317.12 1.820 0.406 0.475 0.011 0.011 317.12 1.877 0.481 0.531 0.011 0.011 317.12 1.916 0.540 0.580 0.012 0.011 317.12 1.932 0.569 0.604 0.011 0.011 317.12 1.965 0.668 0.687 0.010 0.010 317.12 1.949 0.835 0.821 0.006 0.007 317.12 1.924 0.878 0.867 0.005 0.005 317.12 1.895 0.921 0.908 0.003 0.005
TABLE 5
Model parameters regressed for the PR equation of state (MC alpha function) involving the WS mixing rule (kij) and NRTL activity coefficient
model (τij), and statistical analysis of the data-fit for the liquid and vapour phase compositions (x1 and y1).
model parameters statistical analysis
Temperature/K 𝜏12/J.mol-1 𝜏21/J.mol-1 𝑘12 AAD(x1) AARD(x1)/% Bias(x1)/% AAD(y1) AARD(y1)/% Bias(y1)/% R1270 (1) + R1216 (2) 288.07 2522 697 0.120 0.003 1.44 -0.47 0.004 1.18 -0.48 293.09 2557 726 0.109 0.004 0.98 0.07 0.004 0.75 -0.10 299.47 2547 686 0.120 0.001 0.58 0.38 0.002 0.57 -0.47 308.09 2619 666 0.108 0.005 1.13 0.50 0.004 0.81 0.27 318.09 2701 303 0.138 0.002 0.71 0.15 0.002 0.41 0.13 (298.07 – 308.09)a 2634 678 0.112 0.004 1.25 0.47 0.005 1.05 0.11 R1270 (1) + HFPO (2) 279.36 5971 5073 -0.303 0.004 0.63 0.14 0.004 0.56 -0.28 288.19 5230 4888 -0.247 0.003 1.17 0.76 0.002 0.35 -0.14 298.35 5150 4489 -0.225 0.002 0.70 -0.37 0.003 0.48 0.48 308.18 5205 4248 -0.217 0.003 0.76 -0.68 0.003 0.39 0.39 317.12 4923 3971 -0.184 0.002 0.66 -0.52 0.003 0.48 0.37 (279.36 – 317.12)a 5406 4556 -0.244 0.004 0.93 -0.21 0.005 0.97 0.30 a
TABLE 6
Azeotropic pressures (P) and compositions (x1) calculated via the PR equation of state
coupled with the WS mixing rule and NRTL equation of state. Azeotropic conditions calculated from the correlations given by Coquelet et al. [6] for the binary system of R1270 (1) + R1216 (2) appear in the parentheses.
T/K P/MPa x1 R1270 (1) + R1216 (2) 288.07 0.939 (0.939) 0.785 (0.787) 293.09 1.076 (1.074) 0.780 (0.781) 299.47 1.269 (1.267) 0.773 (0.775) 308.09 1.566 (1.566) 0.763 (0.765) 318.09 1.970 (1.973) 0.750 (0.754) R1270 (1) + HFPO (2) 279.36 0.764 0.740 288.19 0.980 0.739 298.35 1.274 0.734 308.18 1.613 0.729 317.12 1.971 0.722
FIGURE 1. P-x-y data for the R1270 (1) + R1216 (2) binary system. Experimental data at: , 288.07 K; , 293.09 K; , 299.47 K; , 308.09 K; , 318.09 K; , Coquelet et al. [6] at 293.12 K. Modelled data using the PR equation of state, MC alpha function, WS mixing rule and NRTL activity coefficient model: this work is represented by the solid black line; data predicted using the parameters of Coquelet et al. [6] are represented by the dashed line. Error bars indicate the expanded uncertainty (k = 2) for composition only.
0,5 0,8 1,1 1,4 1,7 2,0 0,0 0,2 0,4 0,6 0,8 1,0 P /MP a x1,y1
FIGURE 2. P-x-y data for the R1270 (1) + HFPO (2) binary system. Experimental data at: , 279.36 K; , 288.19 K ; , 298.35 K; , 308.18 K; , 317.12 K. Modelled data using the PR equation of state, MC alpha function, WS mixing rule and NRTL activity coefficient model are represented by the solid black line. Error bars indicate the expanded uncertainty (k = 2) for composition only.
0,3 0,6 1,0 1,3 1,6 2,0 0,0 0,2 0,4 0,6 0,8 1,0 P /MP a x1,y1
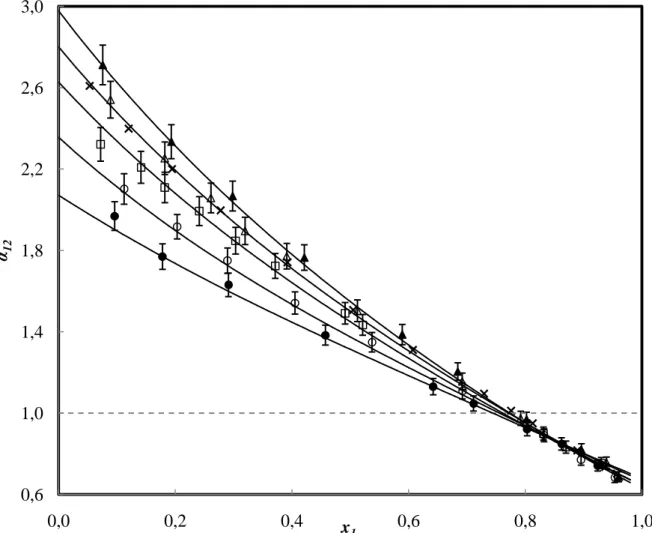
FIGURE 3. Plot of the relative volatility for the R1270 (1) + R1216 (2) binary system. Experimental data at: , 288.07 K; , 293.09 K; , 299.47 K; , 308.09 K; , 318.09 K; , Coquelet et al. [6] at 293.12 K. Modelled data using the PR equation of state, MC alpha function, WS mixing rule and NRTL activity coefficient model are represented by the solid black line. The dashed black line represents where the relative volatility is equal to unity. Error bars indicate the expanded uncertainty (k = 2) for the relative volatility only.
0,6 1,0 1,4 1,8 2,2 2,6 3,0 0,0 0,2 0,4 0,6 0,8 1,0 α12 x1
FIGURE 4. Plot of the relative volatility for the R1270 (1) + HFPO (2) binary system. Experimental data at: , 279.36 K; , 288.19 K ; , 298.35 K; , 308.18 K; , 317.12 K. Modelled data using the PR equation of state, MC alpha function, WS mixing rule and NRTL activity coefficient model are represented by the solid black line. The dashed black line represents where the relative volatility is equal to unity. Error bars indicate the expanded uncertainty (k = 2) for the relative volatility only.
0,0 1,0 2,0 3,0 4,0 5,0 6,0 7,0 0,0 0,2 0,4 0,6 0,8 1,0 α12 x1