Titre:
Title
:
Discovering and assessing fields of expertise in nanomedicine: a
patent co-citation network perspective
Auteurs:
Authors
: Ahmad Barirani, Bruno Agard et Catherine Beaudry
Date: 2013
Référence:
Citation
:
Barirani, Ahmad, Agard, Bruno et Beaudry, Catherine (2013). Discovering and assessing fields of expertise in nanomedicine: a patent co-citation network perspective. Scientometrics, 94(3), p. 1111-1136. doi:10.1007/s11192-012-0891-6
Document en libre accès dans PolyPublie
Open Access document in PolyPublie URL de PolyPublie:
PolyPublie URL: http://publications.polymtl.ca/2346/
Version: Version finale avant publication / Accepted versionRévisé par les pairs / Refereed Conditions d’utilisation:
Terms of Use: CC BY-NC-ND
Document publié chez l’éditeur commercial
Document issued by the commercial publisher Titre de la revue:
Journal Title: Scientometrics
Maison d’édition:
Publisher: Springer
URL officiel:
Official URL: http://dx.doi.org/10.1007/s11192-012-0891-6
Mention légale:
Legal notice: The final publication is available at Springer via http://dx.doi.org/10.1007/s11192-012-0891-6
Ce fichier a été téléchargé à partir de PolyPublie, le dépôt institutionnel de Polytechnique Montréal
This file has been downloaded from PolyPublie, the institutional repository of Polytechnique Montréal
1
Discovering and Assessing Fields of Expertise in
Nanomedicine: A Patent Co-Citation Network
Perspective
Ahmad Barirani, Bruno Agard, Catherine Beaudry École Polytechnique de Montréal
ABSTRACT
Discovering and assessing fields of expertise in emerging technologies from patent data is not
straightforward. First, patent classification in an emerging technology being far from complete, the definitions of the various applications of its inventions are embedded within communities of practice. Because patents must contain full record of prior art, co-citation networks can, in theory, be used to identify and delineate the inventive effort of these communities of practice. However, the use patent citations for the purpose of measuring technological relatedness is not obvious because they can be added by examiners. Second, the assessment of the development stage of emerging industries has been mostly done through simple patent counts. Because patents are not all valuable, a better way of evaluating an industry’s stage of development would be to use multiple patent quality metrics as well as economic activity agglomeration indicators. The purpose of this article is to validate the use of 1) patent citations as indicators of technological relatedness, and 2) multiple indicators for assessing an industry’s development stage. Greedy modularity optimization of the ‘Canadian-made’ nanotechnology patent co-citation network shows that patent citations can effectively be used as indicators of technological relatedness. Furthermore, the use of multiple patent quality and economic agglomeration indicators offers better assessment and forecasting potential than simple patent counts.
Keywords: Knowledge discovery, nanomedicine, self-organization, trend analysis, citation network analysis,
S-curve
1 Introduction
Bibliometric data can be used to assess and forecast technological progress (Martin 1995; Watts and Porter 1997; Daim et al. 2006). Among the many purposes it serves, bibliometric data can be used for trend analysis. Such analysis can show how a given field has evolved over time, help to forecast future technological
directions, identify promising research areas and support new product development decisions. Trend analysis often consists in fitting the progress and growth of bibliometric data with technology diffusion models. In this regard, cumulative technology development is generally recognized to follow an S-shaped curve over time (Andersen 1999; Daim et al. 2006). In this model, development in a discipline grows exponentially until an inherent upper limit is reached. At this point, growth slows down and eventually saturates. These two phases of growth and saturation are representative of technological opportunities in a given disciplines (Andersen 1999). An emerging discipline initially offers great opportunities and thus exhibits exponential growth in terms of bibliometric indicators. As novelties accumulate and occupy the technological landscape, smaller areas of opportunities are left available which leads into a slowing down of bibliometric indicators. This process is self-propagated and results from the collective effort of opportunity seeking innovators.
2
Within the available bibliometric data sources, patents have been extensively used to measure innovative activity (Pavitt 1985; Narin 1994; Narin and Hamilton 1996). Because patents must be novel, non-obvious and useful, they are indicators of technological progress and change (Acs and Audretch 1989; Archibugi and Pianta 1996). Moreover, the accumulation of patent stocks in a discipline takes place because of interactions between scientists, inventors and entrepreneurs. Changes in patenting activity can therefore be used to assess the development stage of various technological sectors (Andersen 1999). Naturally, the analysis of trends and patterns of patenting activity in emerging industries is a popular subject of research. Among these,
nanotechnology has been experiencing rapid development which leaves traces through growth in research grants, the publication of academic papers and the granting of patents (Hullmann 2006; Kostoff et al. 2007; Alencar et al. 2007; Takeda et al. 2009; Porter et al. 2008; Dang et al. 2010; Grieneisen 2010). Numerous countries have put in place initiatives to foster their scientific and technological capabilities in this field (Alencar et al. 2007; Li et al. 2009). Nanotechnology results from the combination and integration of scientific and technological concepts from different fields such as physics, chemistry, biology, material sciences, mechanics and electronics. In this regard, it can also be viewed as a multidisciplinary field (Meyer and Persson 1998). This intrinsic nature of nanotechnology makes its definition, the identification of its field as well as the delineation of its boundaries difficult to achieve.
Within all applications of nanotechnology, nanomedicine is of particular interest, because it may partly be the result of nanotechnology and biotechnology convergence. Freitas (2005) for instance defines the concept as the medical application of nanotechnology. According to the European Science Foundation, this field aims at “ensuring the comprehensive monitoring, control, construction, repair, defense and improvement of all human biological systems, working from the molecular level using engineered devices and nanostructures, ultimately to achieve medical benefit” (ESF 2005, p. 8). It has various application fields in drug delivery, cancer treatment, surgery and medical imaging to name a few. Given the importance of these various applications to human healthcare, nanomedicine is one of the most promising fields of nanotechnology. So far, the bibliometric literature has been mainly concerned with the study of trends in nanotechnology as a whole. Although a few studies have concentrated on sub-disciplines within nanotechnology, nanomedicine has not yet been tackled in a great deal of details. Two quantitative studies can be associated with
nanobiosciences. The first is by Pei and Porter (2011) who use the relevant WOS subject categories to extract nanobioscience articles from a nano-dataset. In a similar fashion, Li et al. (2007a) identify patent classes that can be potentially associated with nanomedicine, but these classes are not reserved for nanomedicine and could also contain patents for the nanobiotechnology sector. Furthermore, patent classes do not reveal much detail about the nature of applications that are developed in an emerging field. By definition, emergent disciplines are continuously growing and are redefined through what the communities of practice (Wenger 1999) believe are promising applications or technological paths. This makes it difficult for observers such as those within the USPTO in setting up standard classification of patents in nanotechnology. Of course, the USPTO has reserved class 977 to nanotechnology patents, but this class only contains a small proportion of
nanotechnology patents. The lexical query of Porter et al. (2008) returns nearly 50,000 patents between 1990 and 2005, while the USPTO currently (as of June 2012) classifies only 4,193 patents in class 977 for the same period.
The second quantitative study is by Takeda et al. (2009) which focused on nanobioscience articles as the unit of analysis and uses a very general lexical query (‘bio*’ and ‘nano*’). The authors use greedy modularity optimization to discover major fields of scientific research in nanobiosciences from scientific paper citation networks. They find that the discipline is divided into four fields: nanostructures, drug delivery, bio-imaging
3
and biosensors. For the period 1990 to 2005, theses field all show exponential growth indicating that nanobiosciences have not yet reached the inflection point associated with the abovementioned S-shaped growth curve. While the adoption of such unsupervised learning techniques to the case of patents seems attractive, certain theoretical issues need first to be raised. Indeed, if one can easily conclude that paper citations can indicate knowledge flows, it is not so obvious in the case of patents, mainly due to the existence of examiner citations. As a result, the study of the commercial applications of nanomedicine are mostly qualitative in nature. In a study of the most promising application fields for nanomedicine (therapeutics, drug delivery, tissue reconstruction and imaging and diagnosis), Perkel (2004) states that nanomedicine
development is still in its infancy as it will be decades before dominant firms that are equivalents to the “IBMs, Intels, or Microsofts of the world” emerge in this new sector.
Another issue related to the use of patent data as progress indicators is in the sole reliance upon patenting activity trends for the assessment of emerging industries. Porter et al. (2008) show that nanotechnology patent production experienced three major leaps for the years 1998, 2001-2002 and 2005 at the international level. Dang et al. (2010) find similar results when looking at international patent applications. Fitting these trends against logistic curves could indicate that nanotechnology has yet to reach its inflection point where growth starts slowing down. However, this is not always true about nanotechnology sub-fields. In a study of nanotube field emission display patents between the years 1994 to 2007, Chang et al. (2010) show that the number of patent applications has slowed down after 2004. Meyer (1994) introduces the concept of bi-logistic growth. This model describes a system that contains two S-shaped curves: a first period of stagnation can be followed by new period of growth and stagnation manifested through two serial logistic curves. This second growth leap is due to environmental changes that lead to a new carrying capacity of the technology. From this perspective, curve fitting of simple patent counts against a logistic curve might miss the complex relationship that technological development has with other economic phenomena that could predict changes in the carrying capacity.
Furthermore, although the use of patenting activity is attractive for industries in which commercial data is not yet easily available, their use for evaluating proximity to commercialization is not straightforward because patents are not all valuable as only a small percentage succeed in generating income (Allison et al. 2004; Moore 2005). It should also be noted that patents are not always filed with the intention of building new products. For instance, firms can license patents for defensive or plain trolling purposes (Hall and Ziedonis 2001; Gallini 2002; Moore 2005; Reitzig et al. 2007). Even though strategic patenting is less often employed for discrete
products such as chemicals, pharmaceuticals and biotechnology applications (Cohen et al. 2000; Hall and
Ziedonis 2001), it is customary enough to justify for the analysis of trends in cumulative patent stocks in tandem with other metrics to control for the variance in patent quality (Lanjouw and Schankeman 2004) and have a better understanding of the technological landscape.
This article fulfills the need to answer the two abovementioned issues. Our first objective is to verify whether patent citations be used as a measure of technological relatedness. Our second objective is to verify if multiple patent metrics and economic indicators can offer better insight about the stage of development of an
emerging industry. Our methodology consists in partitioning projected patent co-citation networks of the Canadian nanomedicine industry and to verify partition quality in order to validate the use of patent citations as indicators of technological relatedness. We then perform trends analysis on the top partitions, which represent leading Canadian fields of expertise in nanomedicine. The use of ultiple indicators will validate that they can contain useful information not conferred by simple patent counts.
4
The remainder of the article goes as follows: Section 2 presents some of the implementation issues regarding patent citation networks partitioning and our approach to test their validity ; Section 3 presents the
conceptual framework used for assessing emerging fields of expertise; Section 4 describes the data used; Section 5 explains the methodology used; Section 6 presents the results of our analysis; and finally Section 7 concludes.
2 Discovering Know-How: Implementation Issues
Given the difficulties of identifying the nature of technological development – and thus national competences – in an emerging discipline, the first objective of this article is to provide a method for characterizing the self-organized nature of technological development in the Canadian nanomedicine community of practice. Inventive activity can be viewed as a complex dynamic system involving the collective effort of autonomous opportunity seeking agents (Fleming and Sorenson 2001). Another aspect of knowledge creation is that it is a path dependent process, where new knowledge is built on top of old knowledge (Rosenberg 1994). Thus, inventors evolve in a community which is constantly combining existing knowledge to create new ones. This search-and-combine effort results in a complex system where pieces of old knowledge and new knowledge are interlinked. This linkage does not follow a random pattern as ideas that solve common problems are linked to at a higher rate (Fleming 2001). This self-organized behavior leads to the formation of small-world and scale-free networks (Watts and Strogatz 1998; Barabasi and Albert 1999). In such settings, communities which exhibit dense inter-linkage of ideas emerge. Finding these communities can thus indicate the kind of knowledge that practicians in a technological discipline are producing. Since our intention is not to study the progress of disciplines that fall within predefined classes, unsupervised learning methods for knowledge discovery seem to be a natural choice for this purpose.
Because patents must contain references to all relevant prior art, patent citations can, theoretically, be used to build a network in which communities represent major fields of technological development. Finding such communities can come down to finding areas of high inter-citation between patents. Among unsupervised learning methods, cluster analysis can be performed on network data in order to identify areas, in which case it can be viewed as a way to achieve community detection in graphs (Girvan and Newman 2002). Cluster quality functions – such as the network modularity – can be used to detect an optimal number of communities (Newman and Girvan 2004). Modularity computes the degree to which vertices inside a community are interconnected compared to the probability of them being interconnected in a random graph of similar density.
Community detection algorithms have been used by scientometricians to map scientific papers and identify scientific disciplines (Wallace et al. 2009; Takeda et al. 2009). These studies rely on the principle that co-citations can be viewed as a measure of similarity between documents (Small 1973). Other studies have extended this principle to patent citations in order to group technologically similar patents together (Breitzman & Mogee 2002; Breitzman 2005; Li et al. 2007b; Barirani et al. 2011). Thus, these studies have extended the principle used for papers to patents. It is worthwhile to mention that this assumption cannot be readily made without considering the difference between patent and paper citations. In fact, co-citation classification of scientific articles finds justification in the fact that citations in scientific publications can be easily associated with knowledge flows (Meyer 2000b; Leydesdorff 2008). However, the interpretation of patent citations must be put in context due to the fact that 1) a large proportion are added by examiners, and 2) that applicants can add them for strategic reasons (Sampat 2005). Meyer (2000a) also points out that time constraints can also lead to examiners adding citation than are only remotely linked to the filed patent.
5
Therefore, patent citations do not automatically indicate knowledge flows from cited to citing patent and thus the argument used for scientific publications cannot be automatically used for patents. However, one can interpret citations as indicators of technological relatedness due to the fact that they result from and are strongly related to USPTO’s patent classification process (Lerner, 1994). It is therefore possible to interpret patent citations as a measure of how close two inventions are from a technological point of view rather than as a measure of knowledge flows from one patent applicant to another. The second research question covered in the present study concerns the validity of this hypothesis. Indeed, even if our conception of technological relatedness is not in any way synonymous to that of knowledge flow, it is worthwhile to verify whether examiner citations can become obstacles to the soundness of citation-based community detection techniques. In other words, we are interested in verifying the degree with which co-citations result from a controlled process that can indicate technological relatedness between patents.
Numerous indicators can be used to test the above hypothesis. The more citations are away from being the result of a controlled process and the more they result in arbitrary assignments (due to lack of time from examiners for instance), the more patent citation networks will resemble random graphs. On the other hand, if citation assignment process is relatively well defined, our network should exhibit small-world and scale-free characteristics common to real-world networks.
Furthermore, once community detection algorithm is applied to the patent citation network, assignee information can also contribute in testing our hypothesis. Since organizations are more likely to specialize in one or a few technological fields, their patents should not be uniformly distributed within partitions. Rather, partitions should be dominated by a few firms. It should also be noted that the domination of all partitions by one single organization could also mean that the partitioning procedure was not effective in grouping similar technologies developed by different organizations. This could mean that modularity optimization of patent citation network does nothing more than grouping together patents from the same organizations. We thus expect partitions to be represented by more than one assignee. Of course, it is possible that one or a few partitions be dominated by one firm, as monopolies do exist in various industries.
3 Assessing National Capabilities: Conceptual Framework
As we have observed earlier, patents are not always accurate in indicating progress from a commercial point of view. Other patent quality indicators can be used in tandem with patent counts in order to assess the progress of an industry. Among these metrics, patent claims are generally recognized as indicators of patent value since they define the patent’s scope (Merges and Nelson 1990). Indeed, the broader a patent’s scope, the larger the number of competing patent that infringe upon it. As a result, patent applicants are willing to have as many claims as possible, while examiners must make sure than all claims are justified and that the patent’s scope is correctly defined (Meyer 2000a). It should however be noted that more claims do not automatically translate into legal protection for patent holders. Indeed, the USPTO and courts often have contradictory views about the interpretation of patent claims (Merges and Nelson 1990). The USPTO follows the doctrine of disclosure, meaning that the applicant is granted a patent if it provides adequate disclosure of the invention. Courts, however, follow the enablement principle in which infringement occurs when an equivalent use of claims is made by a competing product. Nevertheless, studies find statistically significant relationship between the number of claims and patent value (Tong and Frame 1994; Allison et al. 2004). Patent citations are also signals for patent quality. With regards to the examiner citation issue, it should however be noted that they are not strictly synonymous with noise. For instance, Alcacer and Gittelman
6
(2006) find that examiners add a larger proportion of self-citations than the inventors themselves. Hedge and Sampat (2009) find that examiner citations are more significantly associated with patent value. Without being an indication for knowledge flow, examiners’ involvement in the prior art citation process can also be viewed as a smoothing process that insures a thorough citation of prior art. This is generally more recognized for the USPTO patenting system (Meyer, 2000a). Other studies find that a number of characteristics such as firm size and the industrial sector have an impact on the proportion of examiner citations (Alcacer and Gittelman 2006; Alcacer et al. 2009; Azagra-Caro et al. 2011). In the case of discrete technologies, a larger proportion of citations originate from applicants (Alcacer et al. 2009). Sampat (2005) also points out that examiner-added citations represent a smaller proportion of citations in new fields where the majority of prior art resides outside the USPTO patents. Thus, following aggregate citation trends within a discipline that is homogenous in terms of firm size, technology type (discrete vs. complex) and industry characteristics allows to control for variations in the examiner/applicant citations proportions and lead to robust conclusions about the progress of the said discipline.
It is also worthwhile to distinguish between different interpretations that can be made from forward and backward citations. Forward citations to a patent are generally recognized as indicators of the patent’s economic value but also of its technological importance (Albert et al. 1991; Trajtenberg 1990; Archibugi and Pianta 1996; Hall et al. 2005; Abraham and Moitra 2001). The number of backward citations is another indicator of patent quality. Allison et al. (2004) suggest that citing more prior art will lead to stronger patents in the face of litigation. The number of backward citations to patents can also be used to assess the novelty of a technology (Carpenter et al. 1981). New technologies are often sourced in science and have little links to existing patents. As solutions to technological problems are found, future inventions can rely on them, which lead to a rise in the number of backward citations to patents. Patents in emerging technologies are therefore expected to experience an increase in the number of backward citations to other patents as the sector matures.
Non-patent references (NPRs) have also been considered in the literature. These are references made to other prior art such as books, journal articles or standards. Callaert et al. (2006) find that most NPRs are references to scientific journals. Discrete technologies have a higher proportion of NPRs than complex technologies or processes. NPRs are also less likely to be added by examiners, which can be linked to a propensity by examiners to concentrate on citing USPTO patents (Sampat 2005). Thus, NPR trends within a technological field can indicate the progress of that discipline’s need upon basic science. Meyer (2000b) also points out that science-technology linkage is not a linear process and that the presence of NPRs does not imply that cited literature was used during the invention process. Instead, science-technology linkage involves the circular interaction of technological exploitation and scientific exploration. The process of scientific exploration can be viewed as a way to reach new insights that can lead to new inventions which, in turn, can be further improved and optimized during the technological exploitation process. Allison et al. (2004) find that the number of NPRs is positively linked to litigation possibilities. Given the high legal expenses generated by litigation processes, NPRs can be linked to patent value.
Although patents are not all of equal value, patent protection increases the chance of an invention reaching the commercialization stage (Webster and Jensen 2011). Furthermore, commercialization possibilities increase with patent strength (Dechenaux et al. 2008). It should be noted that technology commercialization is not limited to the production and distribution of new products. Technology transfer mechanisms such as patent licensing and buyouts are other channels for monetizing inventions. This principle holds for public
7
patent trolling can be viewed as a form of market intermediation and legitimate income seeking in the knowledge economy (McDonough III 2006). Therefore, for a given technological sector, increases in metrics such as the patent count, forward citations, backward citations, NPRs and claims can be viewed as indicators of closeness to the commercialization stages (Breitzman and Mogee 2002; Nerkar and Shane 2007; Chang and Breitzman 2009; Cheng et al. 2010). Furthermore, it would be interesting to study whether growth or
slowdown in the overall number of patents granted is accompanied by similar growths or slowdowns in the number of backward citations and NPRs. This will allow for a better understanding of the intertwined science-technology link in nanomedicine (Meyer 2000b).
The interpretation of trends in patent metrics must however be nuanced given the complex regulatory framework in which nanomedicine evolves. Indeed, the use of nanomedicine is still a socially controversial subject. Since technological progress is to a certain degree independent from social and legal concerns, growth in trends do not automatically indicate commercialization opportunities. Furthermore, the
conclusions taken based on these metrics are not an absolute indication of closeness to income generation. Rather, they must be used to indicate how one discipline is positioned compared to another.
Compiling information about patent applicants such as inventors and assignees can provide information about dominant firms, technological proximity between firms (which can lead to partnerships as well as merger and acquisition possibilities) and the location of communities of practice (Breitzman and Mogee 2002; Breitzman 2005; Pei and Porter 2011). Concerning the geographical dimension, inventive activity often clusters in a region because of supply-side and demand-side benefits associated with geographical proximity (Krugman 1991; Porter 1998). Among these benefits, the agglomeration of innovators in a region leads to knowledge spillovers (Jaffe et al. 1993; Audretsch and Feldman 1996; Maskell and Malmberg 1999). Patenting activity involves high levels of technological experimenting, part of which is tacit knowledge and thus reflects the localized learning that occurs in a region (Anderson 1999). The clustering of inventive activity in a geographical region can therefore be a sign of increasing returns for that region but also of the formation of an industry (Zucker et al. 1998).
The centrality of the position that public institutions play within the knowledge network of an industry can also be used as an indication of the industry’s stage of development. Owen-Smith and Powell (2004) show that universities played a central gatekeeping role in the early days of the biotechnology cluster in Boston. As the industry matures, large corporations become the central players in the network. Based on this parallel, we believe that public institutions, and especially universities, play a similar central role in the Canadian
nanomedicine sector which is expected to be in its early days. It could also be interesting to put our findings in perspective with studies concerned with nanotechnology as a whole. In this regard, literature points to mixed results. For instance, in results by Alencar et al. (2007, Table 2), only 2 public institutions appear in the top 5 assignee list. Li et al. (2007c, Table 6) show that public institutions represent 1 out of 5 top patent assignees in the USPTO.
4 Data
To fulfill our research objectives we analyze a sample of Canadian nanotechnology patents that are registered at the USPTO. These patents where obtained by performing a lexical extraction on patents containing nanotechnology related keywords. These keywords were obtained from a set of bibliographic studies (Alencar
et al. 2007; Fitzgibbons and McNiven 2006; Mogoutov and Kahane 2007; Porter et al. 2008; Schmoch et al.
8
definition of nanotechnology with only 40 keywords being used in more than one study. As these figures show, experts do not agree on a unified lexical query delineating nanotechnology discipline (Hullmann and Meyer 2003; Takeda et al. 2009; Maghrebi et al. 2011). However, keywords that are used in more than one study can be viewed as common agreement on what constitutes core nanotechnology keywords. In fact, Huang et al. (2011) show that the use of these common keywords leads to lexical queries that result in similar bibliographical extractions. For data extraction purposes, we choose this set of keywords to form a lexical query that is run on the USPTO database. The selection of the USPTO is motivated by the close commercial partnership between the US and Canada. The US economy is by far the largest marketplace for high
technology. It thus attracts the highest level of competition and is therefore a clear indication of technological capabilities for those who are able to innovate in it. Li et al. (2007c) also show that Canadian assignees prefer filing patents in the US rather than the EPO. All granted patents that contain one of these keywords in all their fields and that have been granted to Canadian firms or for which one of the inventors resides in Canada are retrieved from the database. The sample is also expanded by patents classified under USPTO class 977 which has been reserved for nanotechnology. It should be noted that the USPTO currently assigns 156 Canadian patents to class 977, 12 of which are missed by the lexical query. We thus believe that our sample is a good representation of Canadian nanotechnology patents.
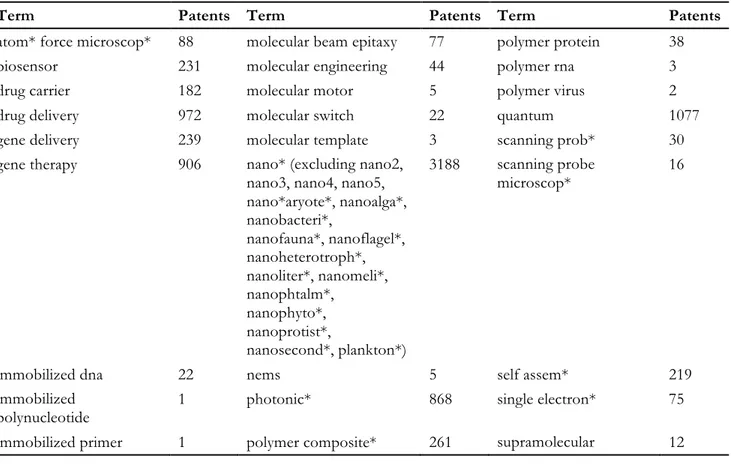
Table 1 shows the core keywords for which at least one Canadian patent was extracted from the USPTO database. For each patent, data about the title, abstract, grant date, number of claims, references, backward and forward citations, as well as the name, city and country of inventors and firms are extracted. After cleaning for duplicates and missing data, our sample contains 6,288 unique Canadian nanotechnology patents obtained from 1990 to 2009.
Table 1: Keywords used in lexical patent extraction.
Term Patents Term Patents Term Patents
atom* force microscop* 88 molecular beam epitaxy 77 polymer protein 38 biosensor 231 molecular engineering 44 polymer rna 3 drug carrier 182 molecular motor 5 polymer virus 2
drug delivery 972 molecular switch 22 quantum 1077
gene delivery 239 molecular template 3 scanning prob* 30 gene therapy 906 nano* (excluding nano2,
nano3, nano4, nano5, nano*aryote*, nanoalga*, nanobacteri*, nanofauna*, nanoflagel*, nanoheterotroph*, nanoliter*, nanomeli*, nanophtalm*, nanophyto*, nanoprotist*, nanosecond*, plankton*) 3188 scanning probe microscop* 16
immobilized dna 22 nems 5 self assem* 219
immobilized
polynucleotide 1 photonic* 868 single electron* 75 immobilized primer 1 polymer composite* 261 supramolecular 12
9
chemistry
immobilized template 2 polymer dna 9 transmission electron microscopy
198 mesoporous material* 20 polymer enzyme 15 tunnel* microscop* 2 molecular beacon 13 polymer polynucleotide 3
5 Methodology
We build the backward citation network obtained from the extracted Canadian nanotechnology patent data. Backward citations have the advantage of being fixed over time as opposed to forward citations. Therefore, using both backward and forward citations to cluster patents will create a bias towards clustering older patents together. Our technology network is a bipartite graph, i.e. a graph in which vertices are divided in two classes 𝑝 and 𝑞 where edges only connect vertices of class 𝑝 to vertices of class 𝑞. In our case, 𝑝 is the set of Canadian nanotechnology patents and 𝑞 is the set of patents that are cited by them. From this bipartite graph, we build its weighted projected graph which is a network where nodes are Canadian patents and where edges’ weights represent the number of patents that Canadian patents have in common. The projected Canadian nanotechnology backward citation network is then partitioned by using the greedy modularity optimization algorithm by Clauset et al. (2004). Subsequently, we summarize relevant information regarding the partitions found in the previous step by adopting the method proposed by Barirani et al. (2011). For each partition, we merge the titles and abstracts of the patents that are assigned to them. Each partition therefore represents a document for which 3-grams will be built after removing common stopwords. Then, tf-idf term weighting will be computed for each document, each of the 3-grams being treated as a term. We will then select the top 10
3-grams for each partition. Summarization will also be complemented by information regarding patent
assignees. Once 3-grams and top assignees are identified for each partition, we perform an expert search in order to identify partitions that are related to nanomedicine. Here, we use our initial definition of
nanomedicine, i.e. the application of nanotechnology for medical purposes. Assignee information will help experts in correctly identifying partitions that contain nanomedicine patents as it could be confusing to rely solely on 3-grams for the distinction of nanomedicine partitions in the case of devices or nano-molecules. Partitions for which top keywords and assignees can be associated with health sciences will be selected as nanomedicine partitions. Nanobiotechnology applications (such as plants, hybrid seeds, water treatment applications, etc.) are thus not retained as nanomedicine patents. This step is finalized by
performing a second modularity optimization partitioning of the ‘nanomedicine-only’ projected network. This step is motivated by the resolution limitation associated with modularity optimization (Fortunato 2010). Indeed, modularity will give partitions that are sized similar to the network’s scale. Since the initial
partitioning is performed on a larger graph representing nanotechnology as a whole, a second partitioning of the smaller nanomedicine network will result in a resolution obtained at a smaller scale.
A few words must be said with regarding expert search. First, this procedure is only practical when dealing with datasets representing a narrow technological field and where a relatively small number of clusters must be identified. Patent titles and abstracts are indeed very technical in nature and difficult to understand for those who are outside the field of expertise. Applying this method to patents coming from a broad set of fields is not effective as it becomes difficult for experts to discriminate between clusters that use similar terms but applied in different technological sectors. Nevertheless, expert searches are common in the scientometrics literature and can constitute a reliable method in our case due to the fact that we deal with a small number of patents that will be assigned to a relatively small number of clusters. Second, one can raise the question as to
10
why expert search is not introduced earlier in the process so that non-nanomedicine patents are removed earlier from the initial sample. The main justification for using our method is that manual classification of patents is a costly process that is not free of error. On the other hand, the task of distinguishing between different domains of application is already performed once by USPTO examiners and this effort leaves traces in the form of patent classification and citations. Our method takes advantage of this available information for grouping technologically similar patents and minimizing subjective intervention to a smaller number of items that are clusters. Of course, citation-based clustering is not a perfect science and it can lead to the arbitrary assignment of patents that are in between two disciplines. However, given the expected scale-free and small-world characteristics of citation networks, these central patents will constitute a small proportion of patents and thus have negligible impact on the aggregate results.
The next steps will consist in assessing the nanomedicine industry by analyzing patent metric trends at different levels. The analysis is performed at field of expertise, city and organization levels. Visualization of technological and organizational maps is also performed following Harel and Koren (2002)’s force directed placement technique. At the field of expertise level, we consider patent counts as well as the average number of claims and citations. Based on trends in these metrics, we will identify fields that are closer to maturity and commercialization compared to the others. A technological map will indicate the level of technological relatedness between fields and the degree of interdisciplinarity of the nanomedicine industry. At city level, we identify Canadian metropolitan areas in which the largest communities of nanomedicine inventors reside. We then compare the ratios of nanomedicine inventors to the number of inhabitants and identify areas that have a larger proportion of their population working in the nanomedicine industry. These ratios will be used as indicators of the clustering of innovative activities in a geographical region. For each city, we compute the degree of specialization in the fields of expertise. This allows us to compare cities that are specialized in a few fields versus those that are diversified in many of them. At the organizational level, we will compute top assignees in our Canadian nanomedicine patent sample. This will indicate the degree of competitiveness and the role played by public institution in total patent production. The organizational map will also show the network position filled by public institutions. Again, mapping is performed through co-citation analysis, based on our assumption that citations are an indication of technological relatedness.
6 Results
6.1 Discovering expertise
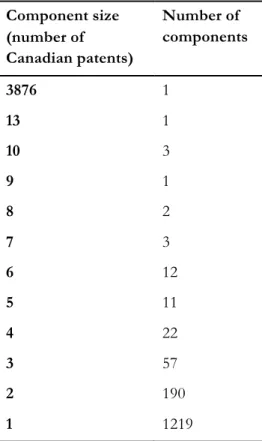
Our initial sample of 6,288 Canadian nanotechnology patents cite 50,504 distinct patents which lead to a citation network composed of 56,454 vertices and 100,467 edges. The main connected component contains 3,876 Canadian patents, 33,674 distinct cited patents and a network containing 78,234 edges. The main component is therefore more than half the size of the initial set of Canadian patents. Furthermore, it contains more than 75% of the edges in the initial network. Taking into account that the initial network contains 1,522 disconnected components, which are mostly singletons (see Table 2), we select the main component as a representation of the core Canadian nanotechnology landscape. It should also be noted that the selection of the largest connected component is imposed by our choice of backward citations as measures of
technological similarity as well as modularity optimization for graph partitioning. Since modularity optimization consists in minimizing inter-partition links, a modularity optimization algorithm fed with a disconnected graph will find that the graph’s connected components represent the best modularity, which is equivalent to finding the number of disconnected components. Furthermore, force directed layout requires
11
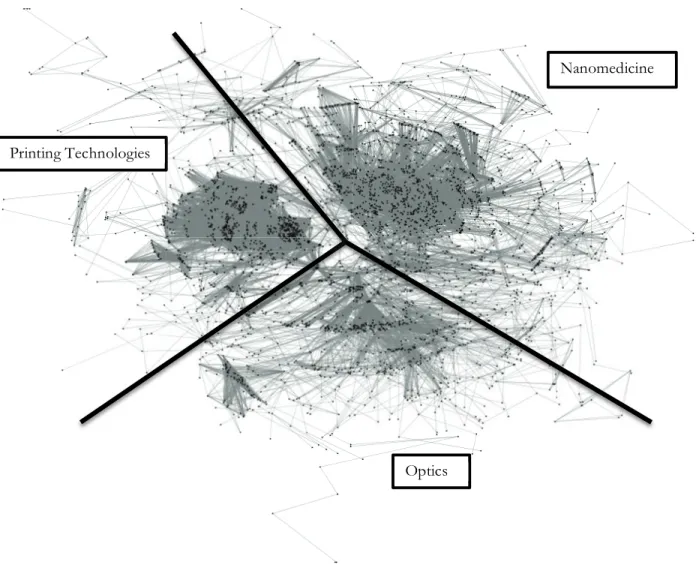
edges between vertices in order to position vertices on a two-dimensional map. The absence of edges between disconnected components means that they cannot be positioned one relative to another. Figure 1 shows the graph obtained by projecting the main connected component. As we can see, this is a complex network with many areas of dense inter-citation. The maximum and average geodesic distances in the connected component are equal to 24 and 5.96 respectively. This network can therefore be classified as a small-world. The network also exhibits scale-free characteristics with skewed distribution of centrality among patents (see Figure 2). So far, these characteristics seem to indicate that the use of co-citations for measuring technological similarity between patents is sound. Furthermore, these characteristics make our citation network a good candidate for modularity-based graph partitioning techniques.
Table 2: Number of components of the same size. There is one large component with 3,856 Canadian patents, while 1,334 components are singleton Canadian patents.
Component size (number of Canadian patents) Number of components 3876 1 13 1 10 3 9 1 8 2 7 3 6 12 5 11 4 22 3 57 2 190 1 1219
12
Figure 1: Projected graph of the Canadian nanotechnology patent citation network. Separation lines represent manual (somehow arbitrary) partitioning of the graph.
Figure 2: Network’s degree distribution follows a power law: very few patents have many connections with other patents with most patents having few connections with other patents. The graph shows that the network exhibits scale-free characteristics.
The execution of greedy modularity optimization leads to the discovery of 62 fields of expertise for the Canadian nanotechnology sector. The best modularity found by the algorithm is 0.8997. Given the theoretical maximum modularity value of 1, partitioning found by the Clauset et al. (2004) algorithm is excellent given the nature of nanotechnology industry. Because of multidisciplinarity, different fields within nanotechnology
0 500 1000 1500 2000 F req uen cy (Nu mb er o f pa te nt s)
Patent Degree Centrality
Nanomedicine
Printing Technologies
13
might be commonly linked through basic technologies. Also, such fields will have a higher proportion of in-between patents, which will increase inter-partition linkage. In such cases, good partitioning of the network will still lead to relatively low modularity. The emerging nature of nanotechnology also contributes to increasing the number of common sources between different fields of expertise. This is due to the fact that a new technological sector must initially source itself in a few basic technologies that contribute to the
propinquity of seemingly distant fields.
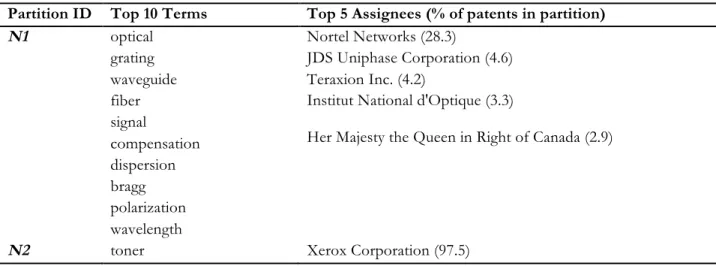
We further evaluate the partitioning of the greedy algorithm by analyzing the top keywords and assignees for the 4 largest fields of expertise in nanotechnology. The results are shown in Table 3. We can see that each partition has specific top terms and top assignees. Furthermore, there is a link between the top terms and the top assignees. For instance, partition N1 contains keywords that are related to optics applied to networking while the top assignees are firms that networking solutions companies. Top terms in Partition N3 are related to nanomedicine and the main assignees are pharmaceuticals or universities. From this perspective,
modularity optimization partitioning of patent citation networks seems to be an effective way of delineating technological fields of expertise. Another aspect for evaluating the partitioning is the distribution of patents for assignees within partitions. Regarding this issue, we further analyze partitions N2 and N4. These partitions are all dominated by one company: Xerox Corporation. Examining these partitions one at a time might be an indication that the partitioning is only grouping patents from the same company. However, a closer look at the top keywords for each one indicates that these are three different types of technologies related to printing solutions: N2 and N4 contain applications for laser and inkjet printers respectively. Therefore, the modularity-based partitioning of patent citation networks seems also effective in delineating different fields of expertise possessed by a very large company such as Xerox Corporation. It should be noted that the domination of printing technologies clusters by Xerox is natural given the fact that our sample contains Canadian-made patents only. Therefore, other large producers of printing technologies which are not present in Canada are not represented here.
By examining partition N2, we find that the last three assignees aren’t printing technology companies. This is due to the fact that these patents are linked to similar technologies than printing patents and that their assignment to partition N2 gives result to better network modularity. Such cases represent a small proportion of patents and will not have significant impact on the aggregate results. Indeed, the top 4 disciplines in Table 3 contain more than 958 patents, with only 3 of them that are falsely assigned.
Table 3: Top 10 terms and top 5 assignees for the 5 largest partitions in the Canadian nanotechnology network
Partition ID Top 10 Terms Top 5 Assignees (% of patents in partition)
N1 optical grating waveguide fiber signal compensation dispersion bragg polarization wavelength Nortel Networks (28.3) JDS Uniphase Corporation (4.6) Teraxion Inc. (4.2)
Institut National d'Optique (3.3)
Her Majesty the Queen in Right of Canada (2.9)
14 latex resin particles surfactant pigment emulsion toner particles colorant ionic surfactant
Palo Alto Research Center, Inc. (0.7) Angiotech Pharmaceuticals (0.4) Ballard Power Systems Inc. (0.4) Ocean Nutrition Canada Limited (0.4)
N3 lipid liposomes liposome liposomal drug lipids vesicles nucleic therapeutic lipid-nucleic
Inex Pharmaceuticals Corp. (11.2) The Liposome Company, Inc. (9.8) University of British Columbia (8.8) RTP Pharma Inc. (2.9) McGill University (2.4) N4 phthalocyanine photoconductive charge transport photoconductive imaging photogenerating
charge transport layer photogenerating layer transport layer charge titanyl
Xerox Corporation (98.2) Fuji Xerox Co., Ltd. (1.2)
Group IV Semiconductor Inc. (0.6) University of Rochester (0.6)
It is also worthwhile noticing that top terms extracted from the titles and abstracts of patents in the 4 largest nanotechnology partitions are different from those that were initially chosen for patent extraction from the USPTO database (see Table 1). This finding seems to indicate that the world of technology is developing its own technical corpus to describe the inventions that it is developing. Of course, the fact that these
documents were extracted with the use of keywords originating from the world of science is an indication that there is knowledge flows from the world of science to the world of technology. However, once basic concepts are transferred to the world of technology, they are transformed into applications which are described with brand new expressions. This finding can point in favor of citation-based query expansion methods (Zitt and Bassecoulard, 2006) to complement lexical document extractions. Indeed, patents that don’t link to terms from the scientific literature will be missed if the extraction process is limited to lexical extractions. This is even more important for mature fields that are relying increasingly on technology and decreasingly on science.
By examining the top keywords and assignees for the 103 nanotechnology partitions, we have identified 46 partitions related to nanomedicine. Altogether, these partitions cover 1,479 patents which represent an
15
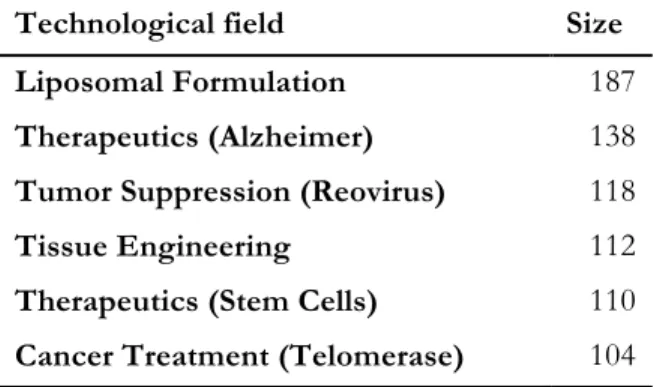
average annual production of nearly 80 patents for the period 1990 to 2009. The second partitioning of this smaller network finds 38 distinct fields of expertise. Table 4 shows the six largest nanomedicine domains identified from the sample of nanomedicine patents. These partitions group patents that have applications mainly in Liposomal formulations, cancer treatment and regenerative medicine. Our results coincide with the nanomedicine report by the ESF (2005, p. 43) where liposomal formulations (Doxil®/Caelyx® and
Ambisome®) are said to have reached the market stage and generated considerable sales ($300M and $100M respectively for the two drugs) in 2004. Given the very competitive nature of the pharmaceuticals industry, the profits associated with gaining market share and the fact that patents in this industry are usually of better value, we can conclude that the domain of liposomal formulation offers the best opportunities in terms of commercial potential. The other major disciplines are also of comparable size relative to the latter discipline, which could mean that they also have commercial potential. Trends analysis for other patent quality metrics will add to this perspective.
Table 4: Six largest fields of expertise in nanomedicine.
Technological field Size
Liposomal Formulation 187
Therapeutics (Alzheimer) 138
Tumor Suppression (Reovirus) 118
Tissue Engineering 112
Therapeutics (Stem Cells) 110
Cancer Treatment (Telomerase) 104
6.2 Industry assessment
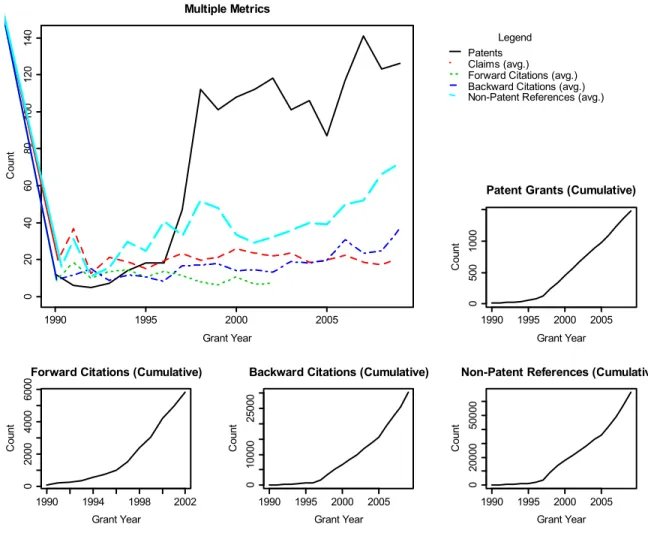
Figure 3 shows the cumulative number of patents produced in nanomedicine by Canadian inventors from 1990 to 2009. As we can see, patent production is on the rise. It is however difficult to tell in which stage of the S-shaped growth the field is from this graph. Figure 3 also shows the evolution of patent metrics over the years. As we can see, there was a slowdown in terms of patent production between years 1999 to 2005 with a second wave of rise between 2005 and 2007. Furthermore, trends in the average number of NPRs seem to indicate two cycles that are aligned with patenting rises and slowdowns.
16
Figure 3: Nanomedicine patent metrics trends (all sub-disciplines included).
The first slowdown period (1999 to 2005) is also marked by a slowdown in the number of NPRs. Again, the 2005-2007 rises in patenting are also accompanied with a rise in the average number of NPRs. This is a very interesting finding regarding the science-technology relationship in nanomedicine. During slowdowns, new patents seem to involve incremental technological improvements. Once technological opportunities are exhausted, communities of practice tend to source their knowledge from basic science which leads to another growth cycle in patenting. The number of backward citations is clearly improving over the years, but also follows a trend that is relatively parallel to that of granted patents. Here, the average number of backward citations seems to depend upon the available technologies. As patent production rises, the technological base on which new patents rely also seems to rise. Concerning the 2008-2009 slowdowns in the number of granted patents, we observe that it is accompanied by rises in both NPRs and backward citations. This could indicate that a third wave of development attracting greater resources is on its way, but that the field is increasingly linked to the technology world even if it still relies on basic science. The evolution of the number of claims is stable over time. Considering the number of forward citations after 7 years of a patent’s grant date, we do not notice any clear rise. This seems to indicate that nanomedicine is still linked to other technological fields. Indeed, if nanomedicine patents where increasingly relying on nanomedicine patents, we would see a rise in forward citation similar to that of backward citations. These figures seem to indicate that, although getting closer to commercialization, the Canadian nanomedicine industry is still far from reaching its maturity.
1990 1995 2000 2005 0 20 40 60 80 100 120 140 Multiple Metrics Grant Year Co un t Legend Patents Claims (avg.) Forward Citations (avg.) Backward Citations (avg.) Non-Patent References (avg.)
1990 1995 2000 2005
0
500
1000
Patent Grants (Cumulative)
Grant Year Co un t 1990 1994 1998 2002 0 2000 4000 6000
Forward Citations (Cumulative)
Grant Year Co un t 1990 1995 2000 2005 0 10000 25000
Backward Citations (Cumulative)
Grant Year Co un t 1990 1995 2000 2005 0 20000 50000
Non-Patent References (Cumulative)
Grant Year
Co
un
17
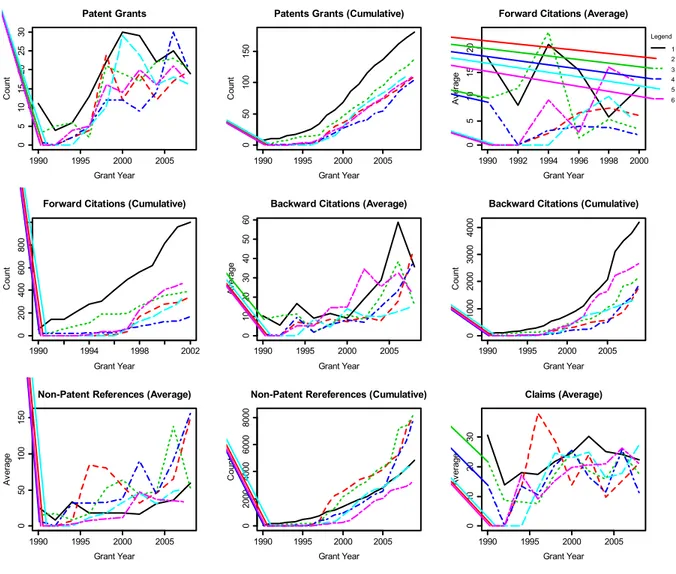
Figure 4 shows patent metrics for the largest nanomedicine subfields. Patent production is on the upside for most of the fields of expertise except for liposomal formulation and tumor suppression which seems to have slowed down. For liposomal formulation, there is a trending rise in NPRs and backward citations. This could indicate that the field might be going through an exploitative cycle where reliance upon technology is
growing. The same observations can be made for tumor suppression applications. Since the number of backward citations and NPRs are stable, and that first patents have appeared in 1995, this field seems to be relatively young. The initial rapid growth of the field is thus an indication of higher perceived technological opportunities, with a period of knowledge resourcing that could be ahead. None of the other top fields however shows any sign in reaching its S-shaped growth inflection point.
Figure 4: Trend analysis for top nanomedicine sub-disciplines. Definition of disciplines for legend: 1) Liposomal Formulation, 2) Stem Cells, 3) Alzheimer, 4) Telomerase, 5) Tumor Suppression and 6) Tissue Engineering.
The average number of backward citations and NPRs are also generally on the rise. This is an indication that major fields of expertise are increasingly linking with both the technology and science world. This is especially true for Telomerase applications which are increasingly linked to technology and science bases. We therefore expect to witness future cycles of growth in this field. Concerning the number of claims, figures show stability over the years. Finally, forward citations trends seem mostly on the downfall. This could be an indication that
1990 1995 2000 2005 0 5 10 15 20 25 30 Patent Grants Grant Year Co un t 1990 1995 2000 2005 0 50 100 150
Patents Grants (Cumulative)
Grant Year Co un t 1990 1992 1994 1996 1998 2000 0 5 10 15 20
Forward Citations (Average)
Grant Year Av era ge Legend 1 2 3 4 5 6 1990 1994 1998 2002 0 200 400 600 800
Forward Citations (Cumulative)
Grant Year Co un t 1990 1995 2000 2005 0 10 20 30 40 50 60
Backward Citations (Average)
Grant Year Av era ge 1990 1995 2000 2005 0 1000 2000 3000 4000
Backward Citations (Cumulative)
Grant Year Co un t 1990 1995 2000 2005 0 50 100 150
Non-Patent References (Average)
Grant Year Av era ge 1990 1995 2000 2005 0 2000 4000 6000 8000
Non-Patent Rereferences (Cumulative)
Grant Year Co un t 1990 1995 2000 2005 0 10 20 30 Claims (Average) Grant Year Av era ge
18
Canadian patents in nanomedicine are generally failing to lead to subsequent developments from within the industry. These trends seem to point out that Canadian nanomedicine patents have quite some development ahead before commercialization. Although patent quality is improving within the sector, it still links heavily with technologies from other disciplines. Even if we observe rises in forward citations in certain areas, they are temporary as dominant designs do not seem to emerge from within the industry.
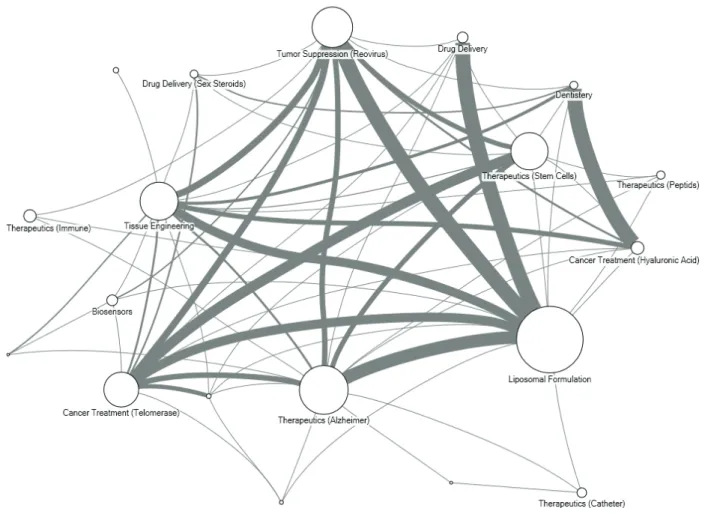
Figure 5 shows the map of Canadian fields of expertise in nanomedicine. Force-directed placement assigns coordinates to patents that cite the same sources in the same region of the graph. Vertex size represents the number of patents produced in that field of expertise and edge size represents the number of citations that the two fields have in common. As the graph shows, nanomedicine fields of expertise are highly interrelated. Indeed, our map of major nanomedicine fields of expertise is closer a complete graph rather than a small-world. This seems to indicate that these fields are related to a common set of technologies.
19
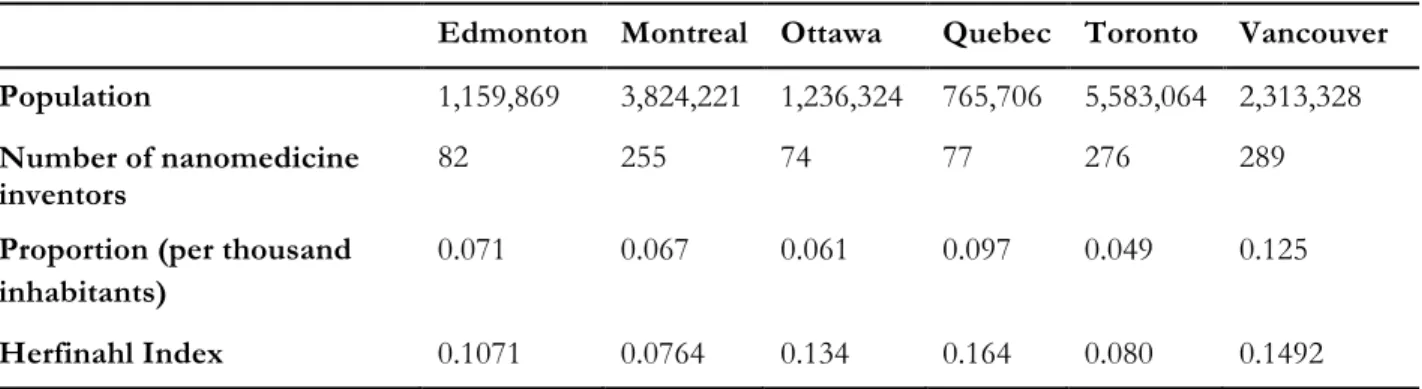
As we can see in Table 5, Vancouver, Toronto and Montreal are the main centers for nanomedicine
technology development. However, for a country that covers a very large geographical area, it is worthwhile observing that the majority of Canadian nanomedicine inventors reside on the south-eastern region of the country. This is somehow representative of the distribution of the general population in the Country. It should also be observed that some cities have a higher concentration of nanomedicine inventors. In this regard, Vancouver and Quebec City are the leading regions in terms of the clustering of nanomedicine communities of practice.
The Herfindahl index in Table 5 shows to what degree innovative activity is diversified within cities. This measures how uniformly patents produced by inventors residing in the city are distributed among the disciplines. Since our analysis covers 38 fields of expertise, a perfectly diversified city (one that produces the same number of patents in each of the 38 disciplines) will have a Herfindahl index of 0.026. As we can see from the results, cities are more or less diversified at the same level. Diversification is generally associated with city and community of practice size as we can see for Montreal and Toronto. Vancouver seems to be an outlier however as it has both the largest community and the highest level of technological concentration.
Table 5: Nanomedicine inventors as a percentage of total population in the largest nanomedicine metropolitan areas
Edmonton Montreal Ottawa Quebec Toronto Vancouver
Population 1,159,869 3,824,221 1,236,324 765,706 5,583,064 2,313,328
Number of nanomedicine inventors
82 255 74 77 276 289
Proportion (per thousand inhabitants)
0.071 0.067 0.061 0.097 0.049 0.125
Herfinahl Index 0.1071 0.0764 0.134 0.164 0.080 0.1492
Table 6 shows how expertise in the largest nanomedicine fields is distributed within Canadian cities. Here, the Herfindahl index indicates the level with which patent production in a field of expertise is distributed among Canadian cities. Given the fact that we study 6 cities, a field of expertise for which an equal number of patents are produced in each city will have and index of one sixth. As we can see, the development of application related to stem-cell-based therapeutics is more equitably spread within major Canadian cities. However, the major field of expertise (Liposomal formulation) is mostly concentrated in Vancouver. Given the size of the discipline and the fact that it is the most market-ready solution in nanomedicine, the above results mark the importance of Vancouver as a center for nanomedicine development. The emergence of Vancouver as a pole for innovative activity in nanomedicine is a sign that the industry is gaining traction. However, activities have not clustered in Vancouver to a degree where it shadows other leading cities.
20
Table 6: Concentration of production for major nanomedicine fields of expertise
Liposomal Formulation Therapeutics (Alzheimer) Tumor Suppression (Reovirus) Tissue Engineering Therapeutics (Stem Cells) Cancer Treatment (Telomerase) Edmonton 0.0803 0.0147 0.1028 0.0795 0.0568 0.0105 Montreal 0.1387 0.2941 0.1495 0.1364 0.3864 0.1789 Ottawa 0.0146 0.0294 0.0187 0.0341 0.1136 0.0632 Quebec 0.0657 0.0000 0.0467 0.1250 0.0795 0.1263 Toronto 0.1168 0.4118 0.2897 0.5227 0.1818 0.3684 Vancouver 0.5839 0.2500 0.3925 0.1023 0.1818 0.2526 Herfindahl index 0.3848 0.3196 0.2735 0.3254 0.2379 0.2516
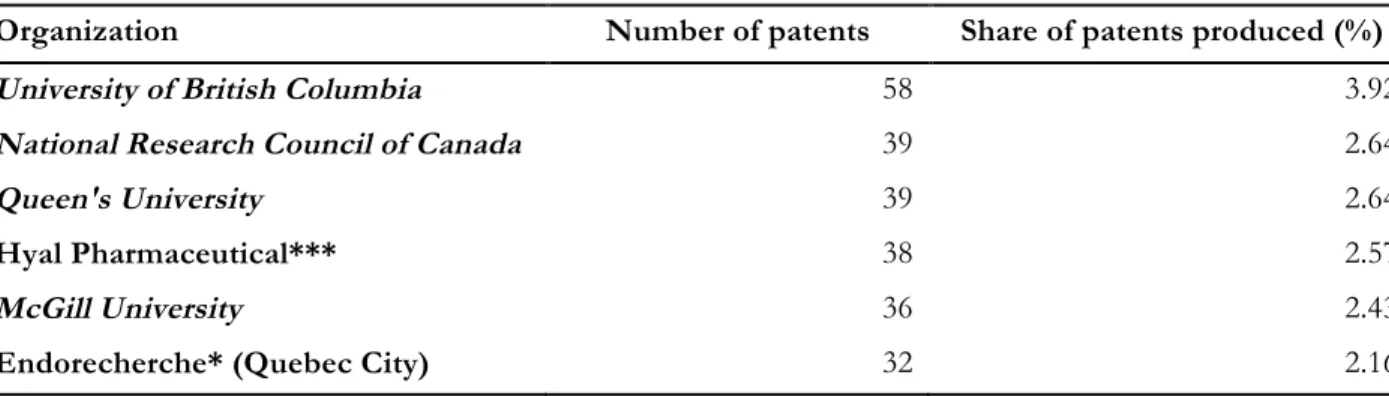
From the 38 fields of expertise discovered, we can identify 586 distinct organizations. The Herfindahl index taking the share of patents that each firm owns is equal to 0.01, indicating that the industry is very
competitive in the sense that there isn’t one single firm that produces most of the innovations. Table 7 shows the top 20 organizations in terms of patent production. Endorecherche, Inc. (Quebec City) is the largest private patent holder headquartered in Canada with only 2.16% of the patents in the sector. Other top organizations share a very small fraction of patents in the industry. This very competitive nature of nanomedicine also seems to point at the distance that it has to commercialization.
As we can further see in Table 7, public institutions play an important role in the production of patents. Indeed, four out of the top five patent holders in nanomedicine are public institutions. This can once again be explained by the fact that nanotechnology is an emerging multidisciplinary field where science linkage is a dominant pattern in inventions. Being the generators of basic knowledge, public institutions are closer to science and have access to broad set of expertise. As the nanotechnology sector matures, we can expect larger private firms, similar to Nortel and Xerox in their respective sectors, to have a more dominant role in patent production as inventions will rely less on basic science and as private firms will have access to more
resources.
Table 7: Top 20 organizations in terms of the number of patents produced
Organization Number of patents Share of patents produced (%)
University of British Columbia 58 3.92
National Research Council of Canada 39 2.64
Queen's University 39 2.64
Hyal Pharmaceutical*** 38 2.57
McGill University 36 2.43
21
Inex Pharmaceuticals* (Vancouver) 24 1.62
Adherex Technologies 22 1.49
Geron Corporation 22 1.49
Generex Pharmaceuticals* (Toronto) 20 1.35
The Liposome Company 20 1.35
Arius Research*** 17 1.15
Nucryst Pharmaceuticals** (Toronto) 16 1.08
NeuroSpheres Holdings* (Calgary) 15 1.01
Aegera Therapeutics* (Montreal) 14 0.95
LAM Pharmaceuticals* (Toronto) 14 0.95
Oncolytics Biotech* 14 0.95
Supratek Pharma* (Montreal) 14 0.95
QLT 13 0.88
University of Alberta 12 0.81
All Others 948 67.71
Notes: * indicates active firm headquartered in Canada; ** indicate firms acquired by Canadian firm; *** indicate firms acquired by non-Canadian firm
Figure 7 shows technological proximity between inventing organizations. Again, the size of the vertex is an indication of the number of nanomedicine patents produced by the organization and the size of edge represents the number of common citation that patents from two organizations have in common. We can notice the central role of the University of British Colombia (UBC) as well as other universities and public institutions. As it is characteristic of the early stages of an industry, universities play a gatekeeping role that binds private firms together (Owen-Smith and Powell 2004). Indeed, geographical and technological proximity to the UBC seems to coincide with the dominant position that Inex Pharmaceuticals plays in the liposomal formulation industry.
22
Figure 6: Map of the most innovative nanomedicine organizations.
7
! Conclusion
In this article, our main objective was to develop a method to discover and map fields of expertise in an emerging industry. Our method was based on the greedy modularity optimization of patent backward citation networks. As a case study, we have selected Canada’s nanomedicine industry. With regards to the self-organizing nature of technological development by communities of practice, our method promises clear advantages over US-class-based patent mapping techniques. First, US class 977 is currently assigned to only 156 Canadian patents granted between years 1990 to 2005. This represents a mere 2% of the 6,288 identified by our extraction method. Second, since class assignment and citations are somehow related, our method does not give results that are contradictory to class-based patent mapping methods. Instead, it takes into account the complexity of technological interrelatedness between patents. It thus is a more refined representation of intellectual organization.
From a methodological point of view, our results support the relevance of patent citations as a way to measure technological proximity between inventions. First, graphs resulting from co-citations exhibit small-world and scale free characteristics common to many real-small-world networks. Second, we observe that
23
modularity optimization of patent citation networks allows for discerning the subtle differences between fields of expertise in a multidisciplinary industry. Third, patent citations are also detailed enough to
distinguish between different fields of expertise for very large organizations such as Xerox Corporation. Fourth, the major field of expertise identified by partitioning the Canadian nanomedicine co-citation network is liposomal formulation, a field that has shown market readiness in other countries. Whether added by examiners or applicants, patent citations do not appear to be the result of an arbitrary and noise-adding process. Citation-based unsupervised learning techniques allows us to obtain refined knowledge about the application domains within an emerging industry in which continuous development are ultimately defined by the collective effort of the communities of practice and for which standard classification is yet incomplete. We have identified 6 major fields of expertise in nanomedicine. The central theme of innovative development appears to be around drug delivery applied to cancer treatment. To the 6 major fields of expertise, we have applied a multi-metric approach for assessing their development stages. Generally speaking we cannot conclude that Canadian nanomedicine fields of expertise are ready for commercialization purposes. By performing multi-metric trends analysis, we observe that not all fields are at the same stage of development. Comparisons between trends in NPRs forward and backward citations show that nanomedicine still sources itself in basic science as well as other technological sectors and disciplines. Also, the progress of these metrics does not seem to follow a pattern that could clearly indicate the leap of one discipline from other disciplines. Rather, each discipline is making progress of different nature, without one making progress in all metrics. We have also identified leading Canadian organizations developing technologies applied to nanomedicine. Our results show that this sector is very competitive and that landscape is still many years away from the emergence of dominant private firms. The absence of dominant players further hints at the embryonic stage of this field. Whether large nanomedicine corporations will emerge, or whether smaller ones will be merged to large pharmaceutical companies who will become main producers seems to be still many years away. We have also observed that public institutions play an important role in patent production as well as bridging different technological fields together. Canadian public institutions, and especially universities, represent 4 out of the top 5 producers of intellectual property in nanomedicine. This is much higher than what is reported by studies about nanotechnology as a whole, where one or two out of top 5 leading organizations where public institutions. Among them, the UBC plays the most central role within the nanomedicine industry. This finding is aligned with those concerning the birth of the biotechnology industry in Boston (Owen-Smith and Powell 2004). Canadian universities are both large as well as central players on the nanomedicine front line. They also play an important role as sources of knowledge when technological opportunities stagnate. Furthermore, although our city-level analysis seems to point to the dominance of Vancouver as an attractive location for further expansions of innovative capabilities in nanomedicine, the geographic agglomaration of inventive activities is not strictly limited to this metropolitan area. Other cities such as Toronto and Montreal are leaders in tissue engineering and stem cells technology respectively. In this regard, the presence of McGill University as both a top patent holder and a central player in the assignee network seems to indicate
agglomeration trends in Montreal. Such conclusions about the stage of development of an emerging industry cannot be made by relying solely on patent counts. These observations thus show that following trends in multiple indicators offers new insights for forecasting future development in an industry.
A first limitation of our research lies in the difficulty of assigning central patents to a community. The adoption of overlapping community detection or multiresolution modularity optimization techniques can help overcome this issue. Another limitation in our method resides in the classification of clusters based on expert search. Although cluster labels are obtained based on the relevance of keywords from patent titles and