HAL Id: hal-02182969
https://hal.univ-lorraine.fr/hal-02182969
Submitted on 8 Aug 2019HAL is a multi-disciplinary open access archive for the deposit and dissemination of sci-entific research documents, whether they are pub-lished or not. The documents may come from teaching and research institutions in France or abroad, or from public or private research centers.
L’archive ouverte pluridisciplinaire HAL, est destinée au dépôt et à la diffusion de documents scientifiques de niveau recherche, publiés ou non, émanant des établissements d’enseignement et de recherche français ou étrangers, des laboratoires publics ou privés.
New cationic exchangers for the recovery of cobalt(II),
nickel(II) and manganese(II) from acidic chloride
solutions: Modelling of extraction curves
Kateryna Omelchuk, Alexandre Chagnes
To cite this version:
Kateryna Omelchuk, Alexandre Chagnes. New cationic exchangers for the recovery of cobalt(II), nickel(II) and manganese(II) from acidic chloride solutions: Modelling of extraction curves. Hy-drometallurgy, Elsevier, 2018, 180, pp.96-103. �10.1016/j.hydromet.2018.07.003�. �hal-02182969�
New cationic exchangers for the recovery of cobalt(II),
nickel(II) and manganese(II) from acidic chloride solutions:
Modelling of extraction curves
Kateryna Omelchuka and Alexandre Chagnesb,*
(a) PSL Research University, Chimie ParisTech - CNRS, Institut de Recherche de Chimie Paris, 11 rue Pierre et Marie Curie, 75005 Paris (France).
(b) Université de Lorraine, CNRS, GeoRessources, F- 54000 Nancy, France.
Abstract
The properties of six newly synthesized reagents for extraction of metal ions [Co(II), Ni(II) and Mn(II)] in chloride media were investigated, and the results with the standard extractants such as Cyanex 272, Cyanex 301, Ionquest 801 (DE2HPA) were compared. From these experimental results, a physicochemical model was developed to calculate the extraction curves of Co(II), Ni(II) and Mn(II). This model describes
perfectly the extraction curves providing that extraction of M2+ and MCl+ (M=Co2+,
Ni2+ or Mn2+) as well as saponification and aggregation of extractants (dimer and
trimer formation) were taken into account. Extraction constants of M2+ and MCl+ as
well as speciation diagrams in the extraction solvent as a function of pH were deduced from this model.
Keywords: Cobalt, nickel, manganese, solvent extraction, extractant, modelling.
1. Introduction
Cobalt, nickel and manganese are used in electrode materials for lithium-ion batteries and alloys manufacturing (Chagnes and Pospiech, 2013; U.S. Geological Survey, 2018; U.S. Geological Survey, 2018a; U.S. Geological Survey, 2018b; U.S. Geological Survey, 2018c). The demand for these metals may grow tremendously because of the rapid growth of market for portable electronics, electric vehicles (EVs), and grid storage applications (Vikström, 2013). Their recovery from primary and secondary resources is therefore of great interest but their separation by solvent extraction is not necessarily easy. The most frequently used extracting agent for cobalt-nickel separation is Cyanex 272 (bis-(2,4,4-trimethylpentyl) phosphinic acid) (Flett, 2004). However, this extractant exhibits a low separation factor between cobalt(II) and manganese(II) both from acidic sulphate and chloride media (Omelchuk et al., 2017). Conversely, D2EHPA (bis-(2-ethyl-hexyl- phosphoric acid) is a suitable extractant for Co(II)-Mn(II) separation from acidic chloride solutions (Zhao et al., 2011) but it is not appropriate for Co(II)-Ni(II) separation. Indeed, pH for which the extraction efficiency of Mn(II), Co(II) and Ni(II) from acidic chloride solution is equal
to 50% (pH1/2) are 4.0, 4.3 and 6.7 when Cyanex 272 is used and 2.2, 3.3 and 3.8 when
D2EHPA is employed instead of Cyanex 272, respectively (Omelchuk et al., 2017). The low pH of extraction implies that a large amount of alkaline solution has to be added in the leach solution to adjust the pH so that a selective extraction could be achieved, especially when Cyanex 272 is used to separate Co(II) and Ni(II). In order to decrease the operational expenditure, the design of new extracting agents capable to recover and separate Co(II), Ni(II) and Mn(II) at low pH and in few stages is highly required.
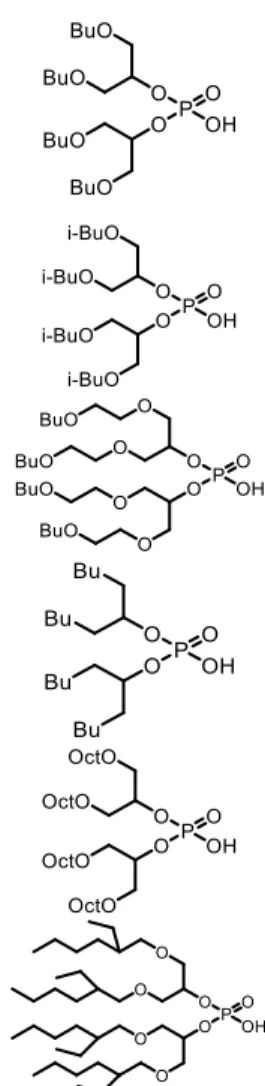
In our previous work (Omelchuk et al., 2017), the six synthesized extractants based on organophosphorus acids reported in Figure 1 were synthesized in order to investigate their extraction properties for the recovery of Co(II), Ni(II) and Mn(II) from acidic chloride media. The effects of structural changes of these organophosphorus cationic exchangers on the metal-distribution curves were investigated by using alkyl groups with different branching and hydrophobicity and by including oxygen atoms in the hydrophobic chains of the cationic exchangers. It was observed that changes of the chemical structure in the hydrophobic chains play an important role in the extraction behaviours and cause more specifically a shift of
agents, distribution constants of metal-ligand complexes between organic and aqueous phases and formation constants of metal-ligand complexes.
More recently, the aggregation behaviour and the acidic dissociation of these extractants were characterized by potentiometric titration and Vapour Pressure Osmometry (VPO) in acidic chloride solution and in n-heptane, respectively (Omelchuck et al., 2018). This study showed that the presence of sulphur increases
the acidity of the molecules and pKa values are strongly affected by the presence of
oxygen atoms in the hydrophobic chains. It was shown that pKa values increase
according to the following order: phosphoric acid<phosphonic acid<phosphonic acid. Conversely, no significant effect of the hydrophobicity of the extractants on their acidity strength was observed. Aggregation characterization showed that bis(undecan-6-yl) phosphoric acid (UPA) exhibits a weak association while the two isomers, i.e.
bis(1,3-dibutoxypropan-2-yl) phosphoric acid (Bidibopp) and
bis(1,3-diisobutoxypropan-2-yl) phosphoric acid (IPA), form more dimers and trimers. All synthesized extractants exhibit very low aggregation constants compared to D2EHPA likely because of the high steric hindrance, which may not favour hydrogen bonds and may destabilize the aggregates.
In the present work, a physicochemical model has been developed to calculate the extraction efficiencies of Co(II), Ni(II) and Mn(II) from acidic chloride media as a function of pH for the six synthesized extractants reported in Figure 1 and three commercial extractants, i.e. D2EHPA, Cyanex 272 and Ionquest 801. This model relies on mass-balance equations and uses the aggregation and acidic dissociation constants determined in our previous work (Omelchuk et al., 2018).
2. Material and Methods
2.1. Reagents
The extractants reported in Figure 1 were synthesized according to the method reported previously (Omelchuk et al., 2018). Bis-(2-ethylhexyl)-phosphoric acid (D2EHPA, Aldrich, purity=97%), Cyanex 272 (Cytec, purity >85%), Ionquest 801 (Solvay, purity not specified), Cyanex 301 (Cytec, purity not specified) were used without further purification. Extraction solvents were prepared by diluting the commercial or synthesized extractants in kerosene (Sigma Aldrich, reagent grade, low odour, mixture of aliphatic hydrocarbons, less than 1% aromatics) without phase
modifiers as no third-phase formation was observed.
Cobalt(II) nitrate hexahydrate (Co(NO3)2∙6H2O, Sigma Aldrich, purity ≥98%),
nickel(II) chloride hexahydrate (NiCl2∙6H2O, Sigma Aldrich, purity ≥98%),
manganese(II) chloride tetrahydrate (MnCl2∙4H2O, Sigma Aldrich, purity ≥98%) were
used to prepare feed solutions for liquid-liquid extraction experiments.
Feed solutions of Ni(II), Co(II) and Mn(II) at 1.17 g/L (0.02 mol/L), 1.18 g/L (0.02 mol/L) and 1.1 g/L (0.02 mol/L) were prepared by dissolving the required amount of salts in 1 M hydrochloric acid solutions.
2.2. Metal-distribution curves (metal extraction efficiency vs. pH)
The extraction properties of the organophosphorus acids towards Co(II), Ni(II) and Mn(II) in acidic chloride media were evaluated by plotting the metal distribution curves (extraction efficiency %E vs. pH). Extraction efficiency was calculated as follows:
%𝐸 = 100 ['])*+,)*+
['])*+,)*+-[']./,./ (1)
where [M]org and [M]aq denote the metal concentrations at the equilibrium in organic
and aqueous phases, respectively. Vorg and Vaq,0 denote the initial volume of the
organic and aqueous phases, respectively.
In order to plot the metal-distribution curves, the pH values of the aqueous phases were adjusted by using NaOH and HCl (standard solution, Alfa Aesar). Batch experiments were conducted at 25 °C in a flask containing equal volumes of aqueous
and organic phases (10 mL; Vorg/Vaq = 1). The pH of the aqueous phase was adjusted
by using NaOH solution. The biphasic system was shaken with a Thermoshaker (Gerhardt) at 100 rpm for 15 minutes. Preliminary experiments on the kinetic of extraction of Ni(II), Co(II) and Mn(II) showed that equilibrium was reached in all cases within 5 minutes of contact. After phase separation, the aqueous phase was filtered on nylon filter (VWR, Sartorius®, 0.20µm) and the equilibrium pH of the aqueous phase was measured. Metal concentrations in aqueous solutions were determined by ICP-OES (ICAP 6000 Series, Thermo Scientific) at 243.7 nm for nickel, 237 nm for cobalt and 257 nm for manganese after diluting the sample in hydrochloric acid (ICP standard solution, 37%, VWR). Metal ion concentration transferred from the aqueous phase into the organic phase was then deduced by mass balance in order to calculate the extraction efficiency defined in Eq. (1). Experiments were duplicated and the experimental error on the distribution coefficients of metals
was estimated to be within 5%.
2.3. Biphasic potentiometric titration
Biphasic potentiometric titrations were performed with a glass electrode (Metrohm® 913) at 25 °C under nitrogen atmosphere (inert conditions) in order to investigate extractant saponification. Sodium hydroxide (Aldrich, analytical reagent) was used as titrant and sodium perchlorate (Aldrich, analytical reagent) was used to
maintain the ionic strength at 1 mol L-1.
2.4. Computing
Computer simulations were carried out on a PC with the free mathematical software Scilab© (Scilab, 1989–2005). The set of mass balance equations for the calculation of the speciation were solved by using the Powell method.
3.
Results and Discussion
3.1. Experimental dataLiquid-liquid extraction of Co(II), Ni(II) and Mn(II) from acidic aqueous media by organophosphorus cationic exchangers involves the following general equilibrium (Komasawa et al., 1983; Danesi et al., 1985; Torkaman et al., 2017):
𝑀1-+ 𝑛4𝐻𝐿7
1 𝑀(𝐻𝐿1)1(𝐻1𝐿1);<1+ 2𝐻- (2)
where M2+ represents Co2+, Ni2+ or Mn2+ and HL denotes the cationic exchanger
(D2EHPA, Ionquest 810, Cyanex 272, etc.). The overbar indicates that the species are in the organic phase whereas the absence of overbar indicates the species are in the aqueous phase.
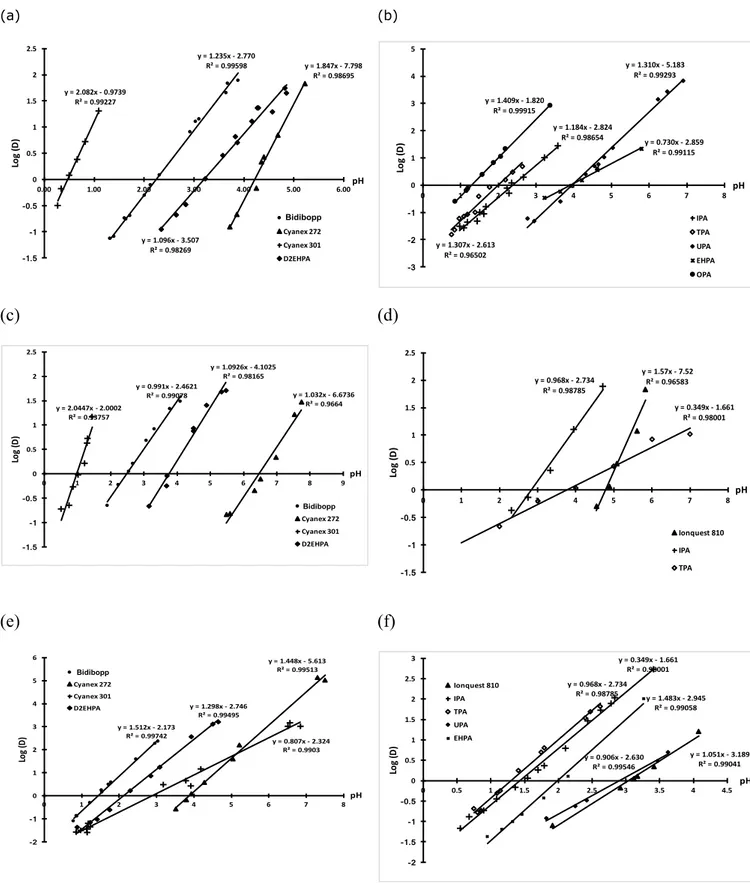
Figure 2 depicts the variation of the logarithm of the distribution ratio of Co(II), Ni(II) and Mn(II) as a function of pH when the aqueous phase initially contains 0.1
mol L-1 chloride and the organic phase is composed of one of the extractants reported
in Figure 1 or commercial extractants, i.e. Cyanex 272, Cyanex 301, Ionquest 801 or D2EHPA. In most cases, slope reported in Figure 1 are quite different from 2. Therefore, the extraction equilibria of Co(II), Ni(II) and Mn(II) from aqueous phases
containing 1 mol L-1 chloride are not the same as the equilibrium reported in Eq. (2)
determined at chloride concentration lower than 1 mol L-1 or in acidic sulfate media.
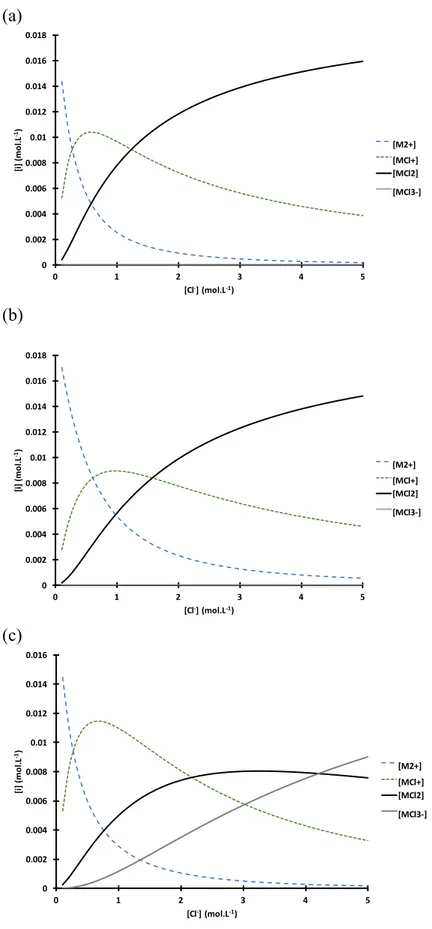
This difference can be explained by the change of Co(II), Ni(II) and Mn(II) speciation as a function of chloride concentration. Figure 2 shows the speciation
diagrams of these metals calculated by using equilibrium constants reported in Table 1. Although, this speciation diagram does not give the exact concentration since data have not been corrected by activity coefficients, this Figure shows the presence of the
other metal chloride species MClj(2-j) cannot be neglected, especially if some of them
are extractable. At 1 mol L-1 chloride, Co(II) exists as Co2+ (13%), CoCl+ (48%) and
CoCl2 (39%), Ni(II) exists as Ni2+ (27%), NiCl+ (45%) and NiCl2 (28%) while Mn(II)
exists as Mn2+ (55%), MnCl+ (55%), MnCl2 (25%) and MnCl3- (6%).
Therefore, Co(II), Ni(II) and Mn(II) might be extracted by the cationic
exchangers under the form of Co2+, Ni2+ and Mn2+ as well as CoCl+, NiCl+ and MnCl+
according to the following equations: 𝑀1-+ 2𝐻𝐿>>>> 𝑀𝐿
1
>>>>>> + 2𝐻- (3) 𝑀𝐶𝑙-+ 𝐻𝐿>>>> 𝑀𝐶𝑙𝐿>>>>>>> + 𝐻- (4)
The extraction of M2+ and MCl+ species from the aqueous phase into the extraction
solvent could therefore explain the reason why the slope of Log (D) vs. pH is lower than 2.
The low values of the slopes in Figure 2 can also be explained by extractant saponification, which can be studied by biphasic titration involving the following biphasic reaction:
𝐻𝐿 + 𝑂𝐻< → 𝐻
1𝑂 + 𝐿<
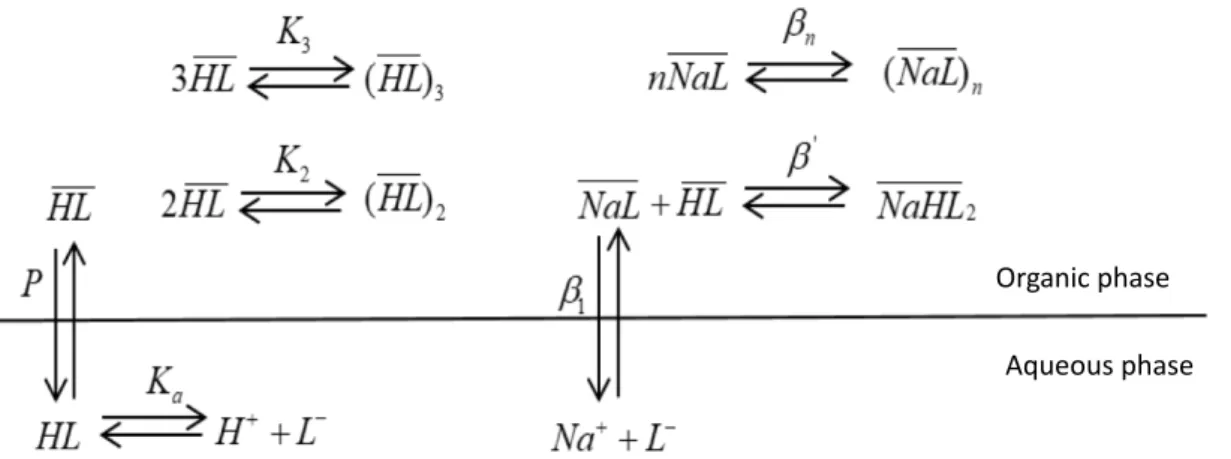
The biphasic titration curves have been modelled by solving Eqs. (5)-(6) deduced from the equilibria reported in Figure 4 and Eq. (7) derived from electroneutrality:
[𝐿<](𝑉 DE,G+ 𝜐) +[I J][KL] M. 4𝑉DE,G+ 𝜐7 + N M.[𝐻 -][𝐿<]𝑉 OPQ,G+ 2𝐾1SN M.T 1 [𝐻-]1[𝐿<]1𝑉 OPQ,G+ 3𝐾VSMN .T V [𝐻-]V[𝐿<]V𝑉 OPQ,G+ 𝛽X[𝑁𝑎-][𝐿<]𝑉OPQ,G+ 2𝛽[𝛽 XMN .[𝐻 -][𝑁𝑎-][𝐿<]1𝑉
OPQ,G+ 𝑛𝛽;𝛽X;[𝑁𝑎-];[𝐿<];𝑉OPQ,G− ]𝐻𝐿^G𝑉OPQ,G= 0 (5) [𝑁𝑎-]4𝑉
DE,G+ 𝜐7 + 𝛽X[𝑁𝑎-][𝐿<]𝑉OPQ,G+ 𝛽[𝛽XMN
.[𝐻
-][𝑁𝑎-][𝐿<]1𝑉 OPQ,G+
𝑛𝛽;𝛽X;[𝑁𝑎-];[𝐿<];𝑉OPQ,G− 𝐶_D`abc𝑉DE,G− 𝐶_DbI𝜐 = 0 (6)
[𝑁𝑎-] + [𝐻-] − Md
[IJ]−
`e.fghc,./,i
,./,i-j − [𝐿
<] = 0 (7)
where Vorg,0, Vaq,0 and 𝜐 denote the initial volume of the organic phase (the volume
of the organic phase at the equilibrium is equal to the initial volume of the organic phase given that there is no significant variation of the organic phase volume during
the titration), the initial volume of the aqueous phase and the volume of sodium
hydroxide added during the biphasic titration, respectively. 𝐶_DbI and 𝐶_D`abc are
sodium hydroxide concentration and sodium perchlorate concentration (sodium
perchlorate is used to maintain ionic strength at 1 mol L-1). All of the constants
reported in Eqs (5)-(7) are defined in Figure 4.
Values of acidic constants of the extractants (Ka), partition constants of the
monomeric form of the extractants (P), dimerization and trimerization constants of the
extractants (K2 and K3, respectively) were determined by our group in a previous work
(Omelchuk et al., 2018). Values of b1, b’, bn and n were adjusted in order to have the
best accordance between experimental and calculated biphasic titration curves. To assess the relative success of the model, a linear square regression analysis of the form:
pHcalc = u pHexp (8)
was employed where pHcalc and pHexp represent calculated and experimental values of
pH during the titration, respectively. The resulting values of the slope u and the
correlation coefficients (R2) reported in Table 3 are sufficiently close to unity to
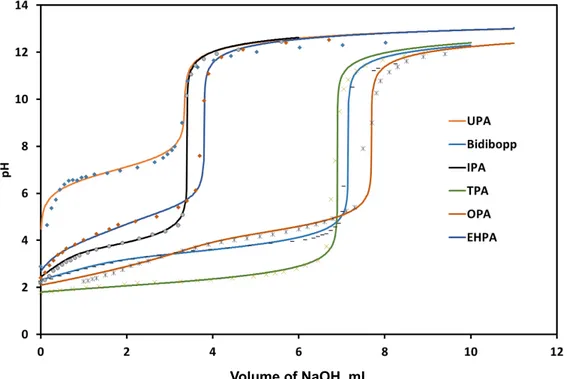
estimate that a good agreement was obtained between experimental titration curves and titration curves calculated by using the constants reported in Table 2. For the sake of illustration, Figure 5 displays the calculated and experimental biphasic potentiometric titration curves for the synthesized extractants diluted in kerosene in
contact with an aqueous phase containing 1 mol L-1 sodium perchlorate.
The previous model including the constants reported in Table 2 has been used to
calculate the saponification percentage (rsapo) of the extractants defined by Eq. (9).
𝜌lDmO = 100 ]_DK^-1]_DIKn^-;o4_DK7pq
]_DK^-1]_DIKn^-;o4_DK7pq-]IK^-1o4IK7nq-Vo4IK7rq (9)
Figure 6 shows that saponification is not negligible and may explain the low slopes deduced in Figure 1. Therefore, the physicochemical model used for describing
extraction curves should take into account both the presence of MCl+ in acidic chloride
media (M=Co, Ni, Mn) and extractant saponification when sodium hydroxide is used to control the pH during liquid-liquid extraction experiments.
3.2. Modelling of the extraction curves of Co(II), Ni(II) and Mn(II) 3.2.1. Physicochemical model
The equilibria reported in Figure 7 have been used to model the variation of the extraction efficiency as a function of pH during the liquid-liquid extraction of Co(II),
Ni(II) and Mn(II) from an aqueous phase containing 1 mol L-1 chloride. The following
equations were solved to calculate the extraction curves: ]𝐻𝐿^𝑉OPQ+ 2𝐾1[𝐻𝐿>>>>]1𝑉 OPQ+ 3𝐾V[𝐻𝐿>>>>]V𝑉OPQ+stM.[_D J][IK>>>>] N[IJ] 𝑉OPQ+ 2𝛽[𝛽 XM.[_D J][IK>>>>]n N[IJ] 𝑉OPQ+ ;spstpM.p[_DJ]p[IK>>>>]p Np[IJ]p 𝑉OPQ+ 2 MuvtM.n]'nJ^[IK>>>>]n Nn[IJ]n 𝑉OPQ+
MuvnsnM.]'nJ^[`aL][IK>>>>]
N[IJ] 𝑉OPQ+ M.[IK>>>>] N[IJ] 𝑉DE+ [IK>>>>] N 𝑉DE− ]𝐻𝐿^G𝑉OPQ,G = 0 (10) [𝑁𝑎-]𝑉 DE+stM.[_D J][IK>>>>] N[IJ] 𝑉OPQ+ sws tM.[_DJ][IK>>>>]n N[IJ] 𝑉OPQ+ ;spstpM.p[_DJ]p[IK>>>>]p Np[IJ]p 𝑉OPQ− [𝑁𝑎-] G𝑉DE,G= 0 (11) [𝑀1-]𝑉 DE+ 𝛽1[𝑀1-][𝐶𝑙<]𝑉DE+ 𝛽V[𝑀𝐶𝑙-][𝐶𝑙<]𝑉DE+ 𝛽x[𝑀𝐶𝑙1][𝐶𝑙<]𝑉DE+ MuvtM.n]'nJ^[IK>>>>]n Nn[IJ]n 𝑉OPQ+
MuvnsnM.]'nJ^[`aL][IK>>>>]
N[IJ] 𝑉OPQ− [𝑀1-]G𝑉DE,G= 0 (12)
[𝐶𝑙<]𝑉
DE+ 𝛽1[𝑀1-][𝐶𝑙<]𝑉DE+𝛽V[𝑀𝐶𝑙-][𝐶𝑙<]𝑉DE+ 𝛽x[𝑀𝐶𝑙1][𝐶𝑙<]𝑉DE+ MuvnsnM.]'nJ^[`aL][IK>>>>]
N[IJ] 𝑉OPQ− [𝐶𝑙<]G𝑉DE,G = 0 (13)
2[𝑀1-] + [𝑀𝐶𝑙-] + [𝑁𝑎-] + [𝐻-] − Md
[IJ]− [𝐿<] − [𝐶𝑙<] − [𝑀𝐶𝑙V<] = 0 (14)
with
[𝐿<] =M.[IK>>>>]
N[IJ] (15)
In these equations, Kw=10-14, Ka, K2, K3, b1, b2, b3, b1, b’, bn and n are reported
in tables 1 and 2. The values of Kex1 and Kex2 defined in Figure 7 were adjusted in
order to achieve the best accordance between experimental and calculated extraction curves.
3.2.3. Extraction curves modelling
Figure 8 shows the extraction curves of Co(II), Ni(II) and Mn(II) from acidic
chloride media ([Cl-]=1 mol L-1) by the commercial and synthesized extractants
diluted in kerosene. A good agreement between experimental and calculated
extraction curves were found since the value of w and the correlation coefficient (R2)
defined in Eq. (16) are closed to unity (see Table 4).
By using the equilibrium constants reported in Tables 1 and 2, this model allows
determining the extraction constants Kex1 and Kex2 related to the extraction of M2+ and
MCl+, respectively. These values are reported in Table 5. Experimental pK
a values
reported in our previous paper (Omelchuk et al., 2018) have been used in the model excepting for modelling metal extraction by Bidibopp, Ionquest 801, IPA and TPA
for which pKa=2.8, 4.6, 2.8 and 3.5 have been used in the model instead of 2.4, 3.0,
2.5 and 2.3, respectively. However, such differences between pKa values determined
by potentiometric titration and by the present model are not significant since
experimental conditions are different (0.1 mol L-1 instead of 1 mol L-1 chloride).
The physicochemical model has been used to calculate the speciation in the
loaded and do not depend on the extractant. Concentrations of NiL2, CoL2 and MnL2
in extraction solvent increase when pH increases until a plateau corresponding to the full metal extraction. The plots of the concentrations of NiClL, CoClL and MnClL in organic phase as a function of pH exhibit a maximum value that depends markedly on the nature of the extractant.
It is interesting to highlight that the concentration of MnL2 is greater than that of
NiL2 and CoL2 in the organic phase whatever the extractant, excepting for Cyanex
301. In the presence of this extractant, the concentration of CoL2 is greater than that
of MnL2. Such an observation is coherent with the Pearson theory, which predicts that
Mn2+ is harder than Co2+ and Ni2+. Likewise, it can be inferred that MnCl+ is harder
than CoCl+ and NiCl+.
4. Conclusion
The extraction of Co(II), Ni(II) and Mn(II) from aqueous solutions containing 1
mol L-1 chloride by commercial organophosphorus cationic exchangers and six new
organophosphorus acids involves the extraction of M2+ and MCl+ (M=Co2+, Ni2+ or
Mn2+). Therefore, the extraction equilibria are different than those occurring in the
presence of aqueous solutions containing chloride ions at concentration lower than 1
mol L-1. Such an observation is coherent with the speciation diagram of these metals
in acidic chloride media. Modelling of the extraction curves of Co(II), Ni(II) and
Mn(II) in 1 mol L-1 chloride by these extractants has been successfully performed by
taking into account extraction of M2+ and MCl+ ions, extractant saponification,
5. References
Chagnes, A and Pospiech, B., 2013. A brief review on hydrometallurgical technologies for recycling spent lithium-ion batteries. J. Chem. Technol. Biotechnol. 88, 1191-1199.
Danesi, P. R., Reichley-Yinger, L. Mason, G., Kaplan, L., Horwltz, E.P., Diamond, H., 1985. Selectivity-structure trends in the extraction of Co(II) and Ni(II) by dialkyl phosphoric, alkyl alkylphosphonic and dialkylphosphinic acids, 1985. Solv. Extr. Ion Exch. 3 (4) 435–52.
Flett, D, 2004. Cobalt-Nickel Separation in Hydrometallurgy: a Review. Chemistry for Sustainable Development 12, 81-91.
Komasawa, I., Tsutao O., 1983. The Effects of Diluent in the Liquid-Liquid, Extraction of Copper and Nickel Using 2-Hydroxy-5-Nonylbenzophenone Oxime. J. Chem. Eng. Japan 16(5), 377-383.
Morris, D. F. C., Reed, G. L., Short, E. L., Slater, D. N., Waters, D. N., 1965. Nickel (II) Chloride Complexes in Aqueous Solution. J. Inorg. Nucl. Chemistry 27 (2), 377– 82.
Omelchuk, K., Szczepaski, P., Shrotre, A., Haddad, M., Chagnes, A., 2017. Effects of structural changes of new organophosphorus cationic exchangers on a solvent extraction of cobalt, nickel and manganese from acidic chloride media. RSC Adv. 7, 5660-5668.
Omelchuk, K., Stambouli, M. Chagnes, A., 2018. Investigation of aggregation and acid dissociation of new cationic exchangers for liquid-liquid extraction”. Journal of Molecular Liquids. Doi.org/10.1016/j.molliq.2018.04.082.
Torkaman, R., Asadollahzadeh, M., Torab-Mostaedi, M., Ghanadi Maragheh, M, 2017. Recovery of Cobalt from Spent Lithium Ion Batteries by Using Acidic and Basic Extractants in Solvent Extraction Process. Sep. Purif. Technol. 186, 318-325. U.S. Geological Survey, January 2018a. Cobalt. Mineral Commodity Summaries p. 50.
U.S. Geological Survey, January 2018b. Manganese. Mineral Commodity Summaries p. 104-105.
U.S. Geological Survey, January 2018c. Nickel. Mineral Commodity Summaries p. 112-113.
Vikström, H., Davidsson, S., Höök, 2013. Lithium availability and future production outlooks. Appl. Energy 110, 252-266.
Zhao, J. M., Shen, X. Y, Deng, .F. L., Wang, F. C., Wu, Y., Liu, H. Z., 2011. Synergistic extraction and separation of valuable metals from waste cathodic material of lithium ion batteries using Cyanex272 and PC-88A. Sep. Purif. Technol. 78, 345-351.
Tables
Table 1 : Formation constants bc,j of MClj(2-j) (M=Co2+, Ni2+ and Mn2+) at 20 °C and
an ionic strength I=0.691 mol L-1 (Morris et al., 1965).
Metal Log (bc,1) Log (bc,2) Log (bc,3)
Mn2+ 0.59 0.26 -0.36
Co2+ 0.69 0.51 -
Ni2+ 0.23 -0.04 -
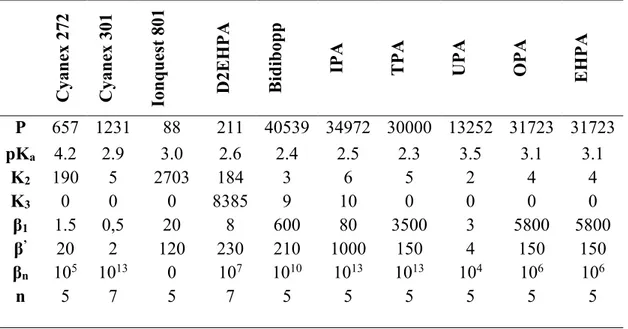
Table 2 : Equilibrium constants of the physicochemical model of saponification at 25
°C. P, pKa, K2 and K3 were reported in (Omelchuk et al., 2018). b1, b’, bn and n were
determined in the present paper by modeling the biphasic potentiometric titration curves. C yan ex 272 C yan ex 301 Ion q u es t 801 D 2EH P A Bi d ib op p
IPA TPA UPA OPA EHP
A P 657 1231 88 211 40539 34972 30000 13252 31723 31723 pKa 4.2 2.9 3.0 2.6 2.4 2.5 2.3 3.5 3.1 3.1 K2 190 5 2703 184 3 6 5 2 4 4 K3 0 0 0 8385 9 10 0 0 0 0 β1 1.5 0,5 20 8 600 80 3500 3 5800 5800 β’ 20 2 120 230 210 1000 150 4 150 150 βn 105 1013 0 107 1010 1013 1013 104 106 106 n 5 7 5 7 5 5 5 5 5 5
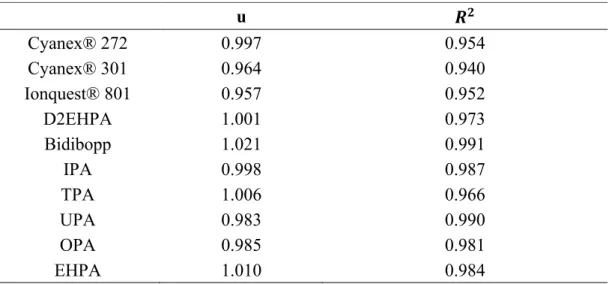
Table 3 : Quality factors of the physicochemical model describing extractant
saponification.
Table 4: Quality factors of the physicochemical model describing the extraction
curves of Co(II), Ni(II) and Mn(II) by cationic exchangers from acidic chloride media (Cl-]=1 mol L-1). u 𝑹𝟐 Cyanex® 272 0.997 0.954 Cyanex® 301 0.964 0.940 Ionquest® 801 0.957 0.952 D2EHPA 1.001 0.973 Bidibopp 1.021 0.991 IPA 0.998 0.987 TPA 1.006 0.966 UPA 0.983 0.990 OPA 0.985 0.981 EHPA 1.010 0.984
Co(II) Ni(II) Mn(II)
w R2 w R2 w R2 Cyanex® 272 0.973 0.986 0.997 0.993 1.003 0.999 Cyanex® 301 0.971 0.970 - - 0.997 0.999 Ionquest® 801 1.010 0.976 1.066 0.983 1.028 0.997 D2EHPA 1.000 0.997 0.979 0.996 1.001 0.995 Bidibopp 0.984 0.997 1.000 0.997 0.977 0.991 IPA 1.02 0.990 1.050 0.975 0.996 0.997 TPA 0.986 0.994 1.000 0.996 1.018 0.997 UPA 1.090 0.991 - - 1.002 0.999 OPA 1.015 0.998 - - 1.006 0.998 EHPA 0.973 0.982 - - 0.994 0.998
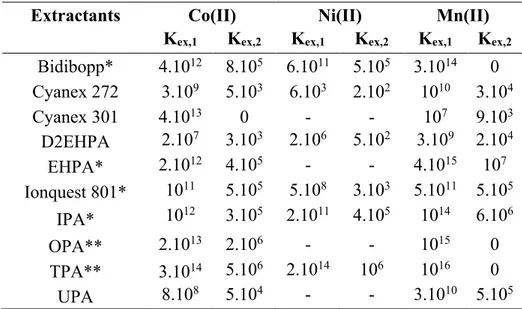
Table 5: Extraction constants of M2+ and MCl+ (M=Co(II), Ni(II) and Mn(II)) from
acidic aqueous solutions containing 1 mol L-1 chloride and an organic phase
containing a cationic exchanger in kerosene. *Values had to be adjusted to achieve a
good agreement between experimental and calculated extraction curves beside Kex1
and Kex1 (pKa=2.8 for Bidibopp, 4.2 for EHPA, 4.6 for Ionquest 801, 2.8 for IPA). **
pKa values from QSPR calculation (pKa=3.07 for OPA and 3.55 for TPA) (Omelchuk
et al., 2017).
Extractants Co(II) Ni(II) Mn(II) Kex,1 Kex,2 Kex,1 Kex,2 Kex,1 Kex,2
Bidibopp* 4.1012 8.105 6.1011 5.105 3.1014 0 Cyanex 272 3.109 5.103 6.103 2.102 1010 3.104 Cyanex 301 4.1013 0 - - 107 9.103 D2EHPA 2.107 3.103 2.106 5.102 3.109 2.104 EHPA* 2.1012 4.105 - - 4.1015 107 Ionquest 801* 1011 5.105 5.108 3.103 5.1011 5.105 IPA* 1012 3.105 2.1011 4.105 1014 6.106 OPA** 2.1013 2.106 - - 1015 0 TPA** 3.1014 5.106 2.1014 106 1016 0 UPA 8.108 5.104 - - 3.1010 5.105
Figures
Figure 1: Synthesized extractants derived from D2EHPA.
Bis(1,3-dibutoxypropan-2-yl)-phosphoric acid (Bidibopp)
Bis(1,3-diisobutoxypropan-2-yl) phosphoric acid (IPA)
Bis(5,8,12,15-tetraoxanonadecan-10-yl)-phosphoric acid (TPA)
Bis(undecan-6-yl)-phosphoric acid (UPA)
Bis(1,3-dioctyloxypropan-2-yl)-phosphoric acid (OPA)
Bis(1,3-di-2-ethylhexyloxypropan-2-yl) phosphoric acid (EHPA)
Figure 2: Variation of the logarithm of the distribution ratio of (a) cobalt(II), (b)
nickel(II) and (c) manganese(II) as the function of pH at the equilibrium. Organic
phase: cationic exchanger in Figure 1 diluted in kerosene; aqueous phase: 1 mol L-1
chloride; temperature=25 °C; phase volume ratio Vorg/Vaq=1.
(a) (b) (c) (d) (e) (f) y = 1.235x - 2.770 R² = 0.99598 y = 1.847x - 7.798 R² = 0.98695 y = 2.082x - 0.9739 R² = 0.99227 y = 1.096x - 3.507 R² = 0.98269 -1.5 -1 -0.5 0 0.5 1 1.5 2 2.5 0.00 1.00 2.00 3.00 4.00 5.00 6.00 Lo g (D ) pH BiDiBOPP Cyanex 272 Cyanex 301 D2EHPA Bidibopp y = 1.184x - 2.824 R² = 0.98654 y = 1.307x - 2.613 R² = 0.96502 y = 1.310x - 5.183 R² = 0.99293 y = 0.730x - 2.859 R² = 0.99115 y = 1.409x - 1.820 R² = 0.99915 -3 -2 -1 0 1 2 3 4 5 0 1 2 3 4 5 6 7 8 Lo g (D ) pH IPA TPA UPA EHPA OPA y = 0.991x - 2.4621 R² = 0.99078 y = 1.032x - 6.6736 R² = 0.9664 y = 2.0447x - 2.0002 R² = 0.93757 y = 1.0926x - 4.1025 R² = 0.98165 -1.5 -1 -0.5 0 0.5 1 1.5 2 2.5 0 1 2 3 4 5 6 7 8 9 Lo g (D ) pH BiDiBOPP Cyanex 272 Cyanex 301 D2EHPA Bidibopp y = 1.57x - 7.52 R² = 0.96583 y = 0.968x - 2.734 R² = 0.98785 y = 0.349x - 1.661 R² = 0.98001 -1.5 -1 -0.5 0 0.5 1 1.5 2 2.5 0 1 2 3 4 5 6 7 8 Lo g (D ) pH Ionquest 810 IPA TPA y = 1.512x - 2.173 R² = 0.99742 y = 1.448x - 5.613 R² = 0.99513 y = 0.807x - 2.324 R² = 0.9903 y = 1.298x - 2.746 R² = 0.99495 -2 -1 0 1 2 3 4 5 6 0 1 2 3 4 5 6 7 8 Lo g ( D) pH BiDiBOPP Cyanex 272 Cyanex 301 D2EHPA Bidibopp y = 1.051x - 3.189 R² = 0.99041 y = 0.968x - 2.734 R² = 0.98785 y = 0.349x - 1.661 R² = 0.98001 y = 0.906x - 2.630 R² = 0.99546 y = 1.483x - 2.945 R² = 0.99058 -2 -1.5 -1 -0.5 0 0.5 1 1.5 2 2.5 3 0 0.5 1 1.5 2 2.5 3 3.5 4 4.5 Lo g (D ) pH Ionquest 810 IPA TPA UPA EHPA Linéaire (EHPA)
(a)
(b)
(c)
Figure 3: Speciation diagram of Co(II), (b) Ni(II) and (c) Mn(II) as a function of
chloride concentration at pH low enough to neglect hydrolysis. This speciation diagram is only for a sake of illustration as data were not corrected from non-ideality.
0 0.002 0.004 0.006 0.008 0.01 0.012 0.014 0.016 0.018 0 1 2 3 4 5 [i] (m ol .L -1) [Cl-] (mol.L-1) [M2+] [MCl+] [MCl2] [MCl3-] 0 0.002 0.004 0.006 0.008 0.01 0.012 0.014 0.016 0.018 0 1 2 3 4 5 [i] (m ol .L -1) [Cl-] (mol.L-1) [M2+] [MCl+] [MCl2] [MCl3-] 0 0.002 0.004 0.006 0.008 0.01 0.012 0.014 0.016 0 1 2 3 4 5 [i] (m ol .L -1) [Cl-] (mol.L-1) [M2+] [MCl+] [MCl2] [MCl3-]
Figure 4: Equilibria used for the investigation of extractant saponification.
Organic phase Aqueous phase
Figure 5: Experimental and calculated biphasic potentiometric titration curves at
25 °C of the synthesized extractants diluted in kerosene. [HL]org,0=0.1 mol L-1;
[NaOH]=0.5 mol L-1 ; [NaClO4]=1 mol L-1 ; Vorg=20 mL ; Vaq,0=25 mL. Equilibrium
constants used in the model are reported in Table 2.
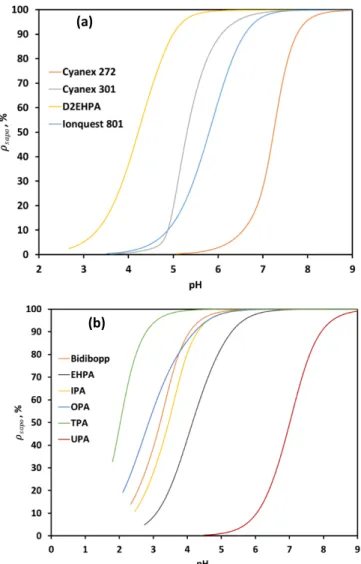
Figure 6 : Saponification percentage (rsapo) as a function of pH for the commercial
and synthesized extractants diluted in kerosene at 25 °C.
Figure 7: Equilibria implemented in the physicochemical model for the calculation
of the extraction curves during the liquid-liquid extraction of Co(II), Ni(II) and Mn(II)
from acidic chloride media (chloride concentration=1 mol L-1).
Organic phase Aqueous phase (a) (b)
Figure 8: Experimental and calculated extraction curves at 25 °C for (a) cobalt(II),
(b) manganèse(II) and (c) nickel(II). [HL]org,0=0.25 mol L-1 ; [HCl]=1 mol L-1 ;
[NaOH]=5 mol L-1 ; [M2+]
0=0.02 mol L-1 ; Vorg,0=10 mL ; Vaq,0=10 mL.
(a) (b) (c)
Figure 9: Speciation diagrams of Co(II), Ni(II) and Mn(II) in the extraction solvents. (a) (b) (c) (d) (e) (f) (g) (h) (i) (j)
![Figure 8 shows the extraction curves of Co(II), Ni(II) and Mn(II) from acidic chloride media ([Cl - ]=1 mol L -1 ) by the commercial and synthesized extractants diluted in kerosene](https://thumb-eu.123doks.com/thumbv2/123doknet/14760329.584724/9.892.168.766.306.751/figure-extraction-chloride-commercial-synthesized-extractants-diluted-kerosene.webp)