Seeking the Best Fundamental Risk Factors:
A Clinical Approach to Fama-French Portfolio Decomposition MARIE LAMBERT, BORIS FAYS, and GEORGES HÜBNER*
December 2017 Abstract
This paper performs a thorough analysis of competing construction methods for the design of size (SMB) and value (HML) spread portfolios à la Fama-French. This quasi-clinical investigation of methodological choices uncovers substantial differences in the capacity of estimated premiums to translate stock characteristics into returns. A sequential sort of stocks into long and short portfolios conditioned on control variables (“pre-conditioning”) produces factors that best reflect the corresponding fundamental attributes. Our results are stronger when using the whole firm sample to define breakpoints and a triple sort, which ensures the same diversification (in terms of number of firms) across the characteristic-sorted portfolios forming the long and short legs of the factor. Our results are robust to the inclusion of the momentum dimension in the multiple sorting. The best method produces a volatile and insignificant size premium, but a high and stable value premium.
* Marie Lambert holds the Deloitte Chair of Financial Management and Corporate Valuation at University of Liège,
HEC Liège, Belgium. She is Research Associate at EDHEC Risk Institute. Boris Fays is PhD candidate at University of Liège, HEC Liège, Belgium. Georges Hübner is Professor of Finance at University of Liège, HEC Liège, Belgium. He is Associate Professor at School of Business and Economics, Maastricht University, the Netherlands.
Corresponding author: Marie Lambert, Tel: (+32) 4 2327432. Fax: (+32) 4 2327240. E-mail:
marie.lambert@ulg.ac.be. Mailing address: HEC Liège, 14 rue Louvrex, B-4000 Liège, Belgium.
Earlier versions have benefitted from comments by Kewei Hou, Eric Zitzewitz, Dmitry Makaro, Jeroen Derwall, Dan Galai, Pierre Armand Michel, Aline Muller, Christian Wolff, as well as the participants to the European Financial Management Association 2010 (Aarhus, Denmark), the French Finance Association 2010 (St-Malo, France), the World Finance Conference 2010 (Viana do Castelo, Portugal), the December meeting of the French Finance Association 2014 (Paris), the 28th Australian Finance and Banking Conference 2015 (Sydney) as well as the
participants to research seminars at the University of Bologna, at HEC Montréal and at Ghent University. Marie Lambert and Georges Hübner acknowledge financial support of Deloitte (Belgium and Luxembourg). All remaining errors are ours.
The empirical pricing literature contains a variety of multifactor models that attempt to explain security returns. Connor (1995) classifies those models into three types: macroeconomic, statistical, and fundamental. In macroeconomic models, each security’s rate of return is assumed to be linearly related to the movements of observable economic time-series such as market return, excess return on long-term government bonds, or commodities. The statistical modeling of security returns relies on factor analysis (principal component analysis, clustering, etc.). The fundamental models use stock “attributes” such as market capitalization, book-to-market or even return statistics such as returns’ levels of skewness and excess kurtosis (Fama and French 1993, Agarwal et al. 2009, Fama and French 2015, Hübner et al. 2015). According to Connor (1995), the fundamental approach to pricing equity returns has outperformed other approaches. Moreover, the four-factor Carhart (1997) model continues to be widely used in the literature for modeling stock returns1. This model has also been widely used as the basis for a substantial number of extensions. In particular, recent studies have shown that according to this approach, both a company's profitability and its investment policy (two determinants of the firm’s book-to-market value) might significantly affect its market value (Novy-Marx 2013, 2015, Hou et al. 2014, 2015, Ball et al. 2015, Fama and French 2015, 2016).
The empirical implementation of any fundamental model faces the common challenge of the construction of mimicking or hedge portfolios that capture the marginal returns associated with a unit of exposure to each attribute. One can perform a Fama and Macbeth (1973) type of regression on the risk fundamentals to extract unit-beta portfolios (see, for instance, Back et al. 2013). One can also construct portfolios by aggregating assets according to their correlations with the fundamentals (Balduzzi and Robotti 2010). Nonetheless, for more than two decades, the mimicking portfolios for size and book-to-market risks developed by Fama and French (1993) (commonly augmented with the momentum factor by Carhart (1997)
1 By the end of 2017, the original Carhart article had been cited 12,641 times on Google Scholar, an average of 623
times per year. It is the Journal of Finance’s 8th most-cited paper of all time and is #4 in average citations/year, just
computed using a similar method) have been the predominant standard in constructing fundamental risk factors. These authors consider two independent methods of sorting US stocks (on market capitalization and book-to-market) and construct six value-weighted two-dimensional portfolios at the intersections of the rankings. The size factor measures the return differential between the averages of small-cap and big-cap portfolios, whereas the book-to-market factor measures the return differential between the averages of value and growth portfolios.
The Fama and French (1993) (henceforth FF) standard approach cannot be easily extended to other characteristics (such as higher-moments) or other (less-developed) markets without adjusting the methodology. Lambert and Hübner (2013) estimate higher-order risk premiums using a triple conditional (rather than independent) sort on the covariance, coskewness and cokurtosis of US stocks with a market portfolio. Agarwal et al. (2009) sort hedge funds into portfolios using the same sequential approach with the objective of estimating higher-moment risk factors. In international asset pricing, Liew and Vassalou (2000) adapt it with a triple conditional sort to compute size, value and the momentum factors for various countries.
Although there are several examples of the use of a conditional sorting procedure, especially when data availability is scarce or in international studies (Daniel et al. 1997, Daniel and Titman 1998, Ang et al. 2006, Novy-Marx 2013), to the best of our knowledge, the consequences of this alternative portfolio construction approach have never been examined in depth. As noted by Agarwal et al. (2011), the pre-conditioning of variables and the sort order matter. The dimensionality of the sort and the definition of the breakpoints are diverse. Do they impact the factors to be priced? Answering this methodological question is crucial, since it should necessarily precede any attempt to expand or replace empirical factors. If a set of factors does not appear to perform well, one has to distinguish whether this is caused by an intrinsic shortcoming of explanatory power or merely an imperfect construction method. Shedding light on this fundamental question with the FF standard approach as a benchmark is the objective of our study and corresponds to the adaptation of a “clinical study” in finance.
To the best of our knowledge, this paper is the first dedicated to the comprehensive review of factor construction methods and their implications for factoring characteristics into returns. With Fama and French (1993) as the established benchmark, we study the various options for constructing risk factors using this framework over a very long period (51 years). We compare sequential to independent and multiple to single sorting procedures when forming hedge portfolios and explore their implications for factoring characteristics into returns. More specifically, we examine the differences between the two ways of implementing a sequential sort: (i) conditioning first on the variable to be priced and then on the control variables (“post-conditioning”) and (ii) conditioning first on the control variables (“pre-conditioning”).
When applied to the size and value factors, we show that the sequential factors are not affected by a momentum effect in the market. Sorting by conditioning first on the pricing variables (post-conditioning) controls for momentum in risk factors but not for all cross-pricing effects. However, the pre-conditioning approach uncovers the independent contribution (uncorrelated with the controls) of the priced variable. We will also show that our results are stronger when using whole-sample breakpoints and triple sort, which ensure the same diversification (in terms of number of firms) across the characteristic-sorted portfolios forming the long and short legs of the factor.
From an economical point of view, the passage from independent to sequential sorts for the size and value premiums decreases the significance of the former but increases the significance of the latter. The mean portfolio returns almost do not increase, but they become more volatile (from a monthly volatility of approximately 3% under the original FF approach to almost 4.5% with the most efficient construction method) and insignificant, whereas the value premium increases (from 36 bps to 47 bps) with lower volatility. Thus, the sequential construction method both improves the specificity of the association with a risk factor and generates substantial consequences on the measured portfolio returns. Our methodology better identifies the size and value effects on the US market. This better identification has implications in factor investing and asset pricing.
The rest of the paper is organized as follows. Section 1 provides the Fama and French (1993) factor construction background and describes the dataset of US stocks used to perform the clinical exercise.
Section 2 analyzes the implications of sorting stocks using a sequential versus an independent sorting method. Section 3 considers alternative choices when sorting stocks into portfolios. In the various sorts, we exclude changes related to the frequency of rebalancing and keep the portfolios fixed to annual rebalancing so that only methodological changes are captured. Section 4 introduces a multi-dimensional procedure as a generalization for constructing risk factors. Section 5 discusses the implications of the different methods of constructing risk factors. Section 6 concludes the paper.
1. Reproducing the Fama and French standard method (1993)
Pricing anomalies related to size (Banz 1981), value (Basu 1983), and momentum (Jegadeesh and Titman 1993) effects on the US stock market have been documented since the early 1980s. These effects, which were initially related to mispricing in the Capital Asset Pricing Model, have been widely recognized as pricing factors ever since the influential work of Fama and French (1993).
The Fama and French (1993) three-factor model and its extension to momentum by Carhart (1997) have become the benchmark of empirical asset pricing. Using a dataset from the Center for Research in Security Prices (CRSP), Fama and French consider two independent methods of scaling US stocks, including an annual two-way sort on market equity and an annual three-way sort on book-to-market according to New York Stock Exchange (NYSE) breakpoints (quantiles). Next, they construct six value-weighted (two-dimensional) portfolios at the intersections of the annual rankings (performed each June of year y according to the fundamentals displayed in December of year y-1). The size or SMB factor (Small minus Big) measures the return differential between the average small-cap and the average big-cap portfolios, whereas the book-to-market or HML factor (High minus Low) measures the return differential between the average value and the average growth portfolios.
The size premium captures the outperformance of small capitalization over large capitalization stocks. Fama and French (1993) associate the size premium with a proxy for (lack of) liquidity. Those authors have related the outperformance of value stocks (i.e., stocks with high book value with regard to their market value) over growth stocks to market distress (see also Fama and French 1995). Their paper develops a set of heuristics enabling the inference of size and book-to-market effects in the US market. The
resulting so-called “Fama-French three-factor model” (FF) has become a core version of empirical asset pricing models.
Since the purpose of this paper is to build a framework that allows for a robust comparison with the original Fama and French approach, we strictly follow their stock selection methodology to construct our risk factors. The period ranges from July 1963 (as in Fama and French 1993) to December 2014 and comprises all NYSE, AMEX, and NASDAQ stocks collected from the merger between the Center for Research in Security Prices (CRSP) and COMPUSTAT databases. The analysis covers 624 monthly observations. The market risk premium corresponds to the value-weighted return on all US stocks minus the one-month T-Bill rate from Ibbotson Associates (from Ken French’s website). We consider stocks that fully match the following lists of filtering criteria: a CRSP share code (SHRCD) of 10 or 11 at the beginning of month t, an exchange code (EXCHCD) of 1, 2 or 3, available shares (SHROUT) and price (PRC) data at the beginning of month t, available return (RET) data for month t, at least two years of listing on COMPUSTAT to avoid survival bias (Fama and French 1993) and a positive book-equity value at the end of December of year y-1. Thus, our sample varies over time. For instance, from a total of 5,612 stocks available as of December 2014, our conditions restrict the usable sample to 3,335 stocks (for 2014).
As in Fama and French (1993), we define the book value of equity as stockholders’ equity reported by COMPUSTAT (SEQ) plus balance-sheet deferred taxes and the investment tax credit (TXDITC). If available, we decrease this amount by the book value of preferred stock (PSTK). If the book value of stockholders’ equity (SEQ) plus the balance-sheet deferred taxes and investment tax credit (TXDITC) is not available, we use the firm’s total assets (AT) minus total liabilities (LT).
Book-to-market is the ratio between book common equity for the fiscal year ending in calendar year t-1 and the market equity of December t-1. Market equity is defined as the price (PRC) of the stock times the number of shares outstanding (SHROUT) at the end of June y to construct the size factor and at the end of December of year y-1 to construct the value factor.
Carhart (1997) completes the Fama and French three-factor model by computing a momentum (i.e., a t-2 until t-12 cumulative prior-return) or UMD (Up minus Down) factor that reflects the return differential between the highest and the lowest prior-return portfolios.
2. Portfolio construction using a sequential versus an independent sort
The Fama and French (1993)'s independent 2x3 sort performed on a firm’s size and value characteristics is compared to a sequential sort on the same characteristics in Figure 1. An independent sort slices the stock universe according to the size and value characteristics (Panel A). A sequential sort proceeds in two steps to form the to-market/market capitalization portfolios. It can start either with the book-to-market (Panel B: first line) or with the market capitalization (Panel B: second line).
Unlike the independent sort, the sequential sort adjusts the breakpoints in the second sorting step, taking into account the correlation among the size and value characteristics.2
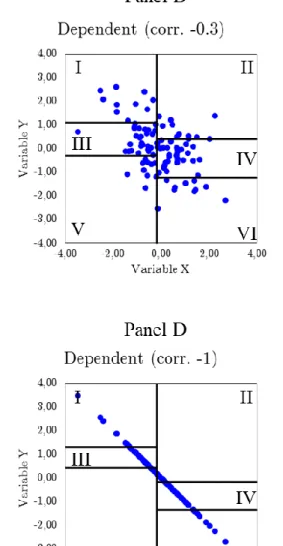
Figure 2 compares the stock allocation into portfolios under a sequential/dependent and an independent sort. Panels A and C (resp. B and D) illustrate the case of an independent (resp. dependent) sort on negatively correlated characteristics such as book-to-market and market capitalization. Panels A and B depict a situation in which the two fundamentals are correlated at -30%, whereas Panels C and D consider a perfect negative correlation (-100%) between the two characteristics on which the sort is performed.
The figure shows that the high level of correlation induces an imbalanced portfolio under an independent framework. The figures also illustrate how the adjustments of the breakpoints under the sequential sort allow for the even split of stocks into portfolios. When the characteristics are perfectly correlated, an independent sort would even produce empty portfolios, as shown in Panel C.
2 For comparative purposes, we assume breakpoints to be defined according NYSE stocks, as in Fama and French
Figure 1 Independent vs Sequential Sorting: 2x3 Portfolios
The figure schematizes the Fama and French (1993) independent sorting (Panel A) and the sequential sorting (Panel B) procedures to construct the 2x3 size/value portfolios. The circle represents the US stock universe.
Figure 2 Independent vs Sequential Sorting: Allocation into Portfolios3
The figures illustrate the allocation of 100 stocks sorted across six portfolios on variables x and y. Panel A (Panel B) shows the allocation according to an independent (dependent) sort when the correlation between the characteristics x and y is -30%. Panel C (Panel D) shows the allocation according to an independent (dependent) sort when the correlation between the characteristics x and y is a perfectly negative (-100%).
The sequential sort can be performed using a pre-conditioning either on the characteristics to be priced (i.e., post-conditioning on the control variables) or on the control variables. The two procedures do not capture the same pricing effects. Before empirically analyzing the statistical properties of the two different procedures, in the next sub-sections we describe their construction methodology with illustrative examples.
2.1. Post-conditioning on the control variables
Under the framework “Sequential-Post” (hereafter S-Post), we construct the size and the value factors by post-conditioning the sort on the control variable4. For example, this methodology equally averages the three components of the small portfolios of Panel C of Figure 1 (small/low (i.e., P5), small/mid (i.e., P3) and small/high (i.e., P1), with P1+P3+P5 making up a small portfolio made on a one-sort procedure) and of the large portfolios (i.e., (P2+P4+6)/3 from Panel C of Figure 1) before computing the spread between the averaged small-size and large-size portfolios. Therefore, the method is similar to the Fama and French (1993) approach, except that conditional sorts lead to a different allocation of stocks into B/M portfolios. The sequential sort takes the correlation between the sorting characteristics into account and adjusts the breakpoints of the second step of the sorting procedure. Consequently, the weight of each firm within the small or large portfolios is modified with respect to Fama and French. Figure 3 illustrates the procedure for the size and value factors.
Figure 3 Sequential Sorting (2x3): Post-conditioning method
The figure schematizes the sequential sorting procedure by post-conditioning on the control variable. In other words, the illustration shows the construction of the size premium (SMB) by first sorting stocks according to their market capitalization (priced variable), and then sequentially sorting stocks according to their book-to-market ratio (control variable). The value premium (HML) is formed by first allocating stocks
into portfolios according to their book-to-market ratio (priced variable), and then sequentially sorting stocks for their market capitalization (control variable).
2.2. Pre-conditioning on the control variables
We construct the size and value factors under the "Sequential-Pre" (hereafter S-Pre) framework by pre-conditioning the sorting procedure on the control variable and ending the sort with the variable to be priced, such as in Lambert and Hübner (2013). This methodology equally averages portfolios P1, P3 and P5 (resp. P1 and P2) and separately averages P2, P4 and P6 (resp. P5 and P6) from Panel B (resp. Panel C) of Figure 1 to form a small (high B/M) and a large (low B/M) portfolio, respectively. It then takes the spread to compute the size factor (resp. value factor). Figure 4 illustrates the procedure for the size and value factors under the S-Pre framework.
In S-Post (as well as in FF), the procedure first rebuilds the small and large portfolios by rebalancing the components of each portfolio across the three levels of the control variable, including book-to-market.
For example, P1+P3+P5 corresponds to a sort small portfolio and P2+P4+P6 corresponds to a single-sort large portfolio. However, in S-Pre, the sum of these portfolios does not comprise either a single-single-sorted small portfolio or a single-sorted large portfolio. This alternative approach to performing a sequential sort does more than simply rebalance the stock weight into the portfolios to form the spread. The S-Pre construction first builds return spreads within each sub-sample formed on the control variable (the sum of these sub-samples making up the control universe), and then it aggregates these spreads into a single factor. It relies on the evidence that there is a tilt and concentration of small stocks in the value portfolios and that the value effect is strongest in small caps. For instance, in constructing the HML factor, the S-Pre construction reduces the tilt by putting the same weight on the HML spreads from both control samples (small and large). However, the S-Post and FF procedures perform an adjusted single-sort spread where the weights (but not the allocation) of stocks are adjusted for the correlation between the pricing and the control variables. This result constitutes the main difference between the frameworks. Unlike the S-Post approach, the S-Pre approach ensures that the risk factor is an equally weighted average of the spreads for each level of control. S-Post does not ensure this because (P1-P2), (P3-P6), or (P5-P6), which form the three size return spreads, do not have the same average levels of book-to-market. Under the S-Pre framework, and using a 2x3 framework, the SMB spread in the low B/M portfolio exactly counts for a 1/3 weight. This result does not hold for HML spreads because of the non-symmetrical sorting. Symmetrical sorting will be tested later in the paper.
Figure 4 Sequential Sorting (2x3): Pre-conditioning method
The figure schematizes the sequential sorting procedure by using pre-conditioning on the control variable. The illustration shows the construction of the size premium (SMB) using pre-conditioning on the book-to-market ratio (control variable) and then sorting for the book-to-market capitalization (priced variable) and the value premium (HML) using pre-conditioning on the market capitalization (control variable) and then sorting for the book-to-market ratio (priced variable).
2.3. Pricing effects of the alternative methodologies
To analyze the pricing effects induced by the sorting methodologies, we perform "spanning regressions" as defined in Fama and French (2015, 2017) and in Novy-Marx (2015). The factors constructed under different configurations (dependent/independent sort) are regressed on Fama and French and Carhart factors to understand their return drivers.
y𝑡= 𝛼 + 𝛽′𝑋𝑡+ 𝜀𝑡, (1)
where y𝑡 is the factors constructed under different configurations (dependent/independent sort), 𝑋𝑡 is the matrix of risk factors, 𝛽′ is the vector of parameter estimates for the risk factors, and 𝜀𝑡 is the error terms.
Results are displayed in Table 1.
The table reports the spanning regression results for the alternatives size and value factors. T-statistics of the estimation parameters are in parentheses. The significance of the parameter estimates is reported as performed. *, **, and *** and indicate statistical significance at the 0.1, 0.05 and 0.01 levels, respectively. The denomination “S-Post” refers to a post-conditioning on the control variable, whereas “S-Pre” refers to a pre-conditioning on the control variable. For instance, HMLS-Post represents the value factor when stocks are first sorted by their book-to-market ratio (variable to be priced) and then by their market equity, whereas HMLS-Pre represents the value factor when stocks are first sorted by the market equity (control variable) and then the book-to-market equity (priced variable). The period used to perform the regressions ranges from July 1963 to December 2014.
Spanning regressions on SMB and HML factors using a 2x3 approach
HMLff HMLS-Post HMLS-Pre SMBff SMBS-Post SMBS-Pre
Alpha 0.574*** 0.036 0.007 0.203 0.016 0.017 (5.26) (1.25) (0.24) (1.65) (1.01) (0.89) RMff -0.179*** -0.022*** 0.01 0.184*** 0.000 -0.016*** (-7.03) (-3.30) (1.61) (6.53) (-0.12) (-3.43) SMBff -0.135*** 0.268*** 0.034*** 1.005*** 0.936*** (-3.74) (28.61) (3.82) (199.62) (145.79) HMLff 0.961*** 0.935*** -0.165*** 0.186*** -0.011 (92.63) (95.05) (-3.74) (33.35) (-1.57) UMD -0.13*** 0.005 -0.015** 0.006 -0.007** -0.006 (-5.11) (0.68) (-2.36) (0.20) (-2.00) (-1.29) R2 14.72% 94.06% 94.43% 11.66% 98.59% 97.49%
The Fama and French (1993) methodology is used as a benchmark both for comparison and for understanding the drivers of the methodological changes. In the Fama and French framework, the SMB and HML factors are negatively correlated since high book-to-market companies seem to constitute large-cap companies under this framework. In the long run, the HMLff factor is negatively related to market
performance and displays a reversal component. The SMBff factor follows the performance of the market
and reflects a kind of momentum strategy. This example shows that applying an independent sort creates close links between the sets of premiums. When performing a sequential sort (either using a
pre-conditioning or post-pre-conditioning on the control variables), the return drivers underlying the factors differ from the independent sort, but they also differ amongst the two ways of implementing a sequential sort.
In the S-Post framework, the value factor is the result of an adjusted high minus low spread that puts equal weights on so-defined5 small and big stocks. The correlation between the characteristics does
not impact the sorting since the second sort is made within each first sort. However, in an independent sort, the negative correlation between market capitalization and book-to-market has the consequence of forming six very different portfolios.
The outcome of this construction method is a very low (but positive) correlation between the SMB S-Post and HMLS-Post factors, leading to 4% compared to -23% under a classical independent sort. By reducing
the large weight put on large caps with respect to the independent framework, the S-Post procedure tilts the value factor toward a small-value premium. This result is confirmed by Table 1, which shows that the HMLS-Post is long the Fama and French size factor, contrary to the original Fama and French HML factor.
Moreover, the HMLS-Post is independent from a momentum strategy and only slightly affected by market
conditions. We observe a similar effect for the newly defined size premium. To conclude, the use of a sequential sorting approach that pre-conditions on the variable to be priced modifies the underlying risk drivers of the factors compared to the original Fama and French framework. Similar to Fama and French, it adjusts the weight of the control variable in each of the portfolios constituting the spread. However, unlike Fama and French, it takes into account the negative correlation between market capitalization and book-to-market characteristics. Contrary to Fama and French, it readjusts the breakpoints to take into account the correlation among the sorting characteristics. This controls for the reversal component of the HML factor (lower market capitalization leading to higher book-to-market).
In the "Sequential-Pre" framework, the SMBS-Pre factor does not display any exposure to the HMLFF
(contrary to the Fama and French original factor). One should recall from the previous analyses that the SMB factor defined under the S-Pre framework is not a simple adjusted spread but is the average small size
spread across the three levels of book-to-market. The S-Pre framework goes one step further than S-Post. The construction method builds the factors for each level of the control variable and then aggregates them within the whole control universe. Consequently, it completely diversifies the external factors. However, the HMLS-Pre is weakly but positively (3%) and significantly explained by the SMBFF factor, ceteris paribus.
Again, one should recall that using a 2x3 framework, the value-growth spread does not account for the medium B/M portfolio and therefore cannot totally eliminate the effects of the control variable. This issue will be solved later in the paper when considering a triple sort. Moreover, the SMBS-Pre is slightly negatively
related to market conditions. These results are substantially different from both the independent and the post-conditioning sequential frameworks. The next section further investigates the consequences of the two frameworks when taking into account alternative methodological choices.
3. Alternative Choices for Sorting Out Stocks
This section investigates the impact of other alternative methodological choices when factoring characteristics into returns, including the definition of breakpoints and multiple sorts. The breakpoints used as a scale to allocate stocks into level-portfolios can be defined either using the whole sample (i.e., using all firms and all names) or using only the firms from the NYSE. For sake of simplicity, we refer to "name" and NYSE breakpoints, respectively.
3.1. Name breakpoints versus NYSE breakpoints
The traditional 2x3 independent sort of Fama and French (1993) is performed using NYSE breakpoints. Figure 5 shows that the breakpoints used for book-to-market characteristics are almost unchanged across the sample period (1963, 1994, 2001 and 2014). However, breakpoints for market capitalizations vary widely under changing market conditions. The NYSE size breakpoints increase in favorable market conditions, which induce a momentum effect in the Fama and French (1993) size premium and a consequential reversal in the HML effect. Sorting stocks according to the breakpoints defined on the entire sample introduce relatively resilient allocation keys into portfolios. Note that under this construction, NASDAQ stocks are largely represented in the small-cap portfolios and represent the main risk dynamics of this sub-portfolio.
Figure 5 NYSE vs Name Breakpoints
Figures A to H report the stratification of the US stock universe among the FF 2x3 characteristic-sorted portfolios on size (small and big) and book-to-market (low, medium and high). The panels on the left use the NYSE breakpoints, whereas the panels on the right use the whole sample to estimate the breakpoints. The results are reported for the years 1963, 1994, 2001, and 2014. The x-axis refers to the market equity and the y-axis to the book-to-market equity. For better clarity of the breakpoints, outliers are not reported, the x-axis is capped between 0 and $4,000 billion, and the y-axis is truncated between 0 and 3. The exercise could also be performed without truncating axes on a log-scale, and this would lead to equivalent interpretations.
Panels A-C-E-G (resp. Panels B-D-F-H) display the yearly values of the NYSE (resp. name) breakpoints for market capitalization and book-to-market under a 2x3 independent sorting of stocks. Panels G and H clearly illustrate the momentum effect induced in the portfolios sorted using the NYSE breakpoints. To be included in a large-cap portfolio, a given stock needs to be above the threshold defined by the current market conditions. The definition of large caps is much more stable across time using whole sample breakpoints.
One frequently cited reason for using NYSE breakpoints is that it places more stocks in the low size portfolios, with the objective of capturing a higher percentage of the small capitalization universe in that portfolio. A whole sample approach takes another perspective by having an exogenous definition of a small stock and a classification independent from current market conditions, which might induce various
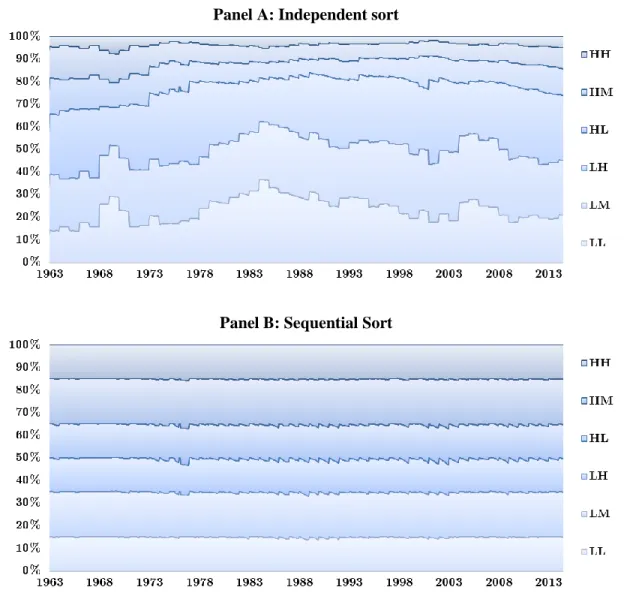
levels of capitalization across portfolios. In other words, a NYSE framework seeks a balance between the different portfolios (small and large portfolios) based on the total market capitalization included in each portfolio. However, the whole sample breakpoints framework seeks to create a balance between portfolios based on the number of stocks. Consequently, a 2x3 independent sort will induce an imbalance in the number of stocks in portfolios to counter the capitalization effect. The use of whole sample breakpoints would create an imbalance in market capitalization but the same repartition in terms of number of stocks, which is visually illustrated in Figure 6 for an independent sort (Panel A) and a sequential sort (Panel B).
In other words, by applying the method of size and book-to-market dimensions, many stocks fall into the small-value corner (as noted by Cremers et al. 2012) under an independent 2x3 sorting. However, this is not the case under a sequential framework, as illustrated in Panel B.
Spanning tests on sequential factors (under S-Post and S-Pre frameworks) defined using name (i.e., whole sample, i.e., using all firm, all names) and NYSE breakpoints are displayed in Table 2.
Figure 6
Relative Stock Distribution among the 2x3 Characteristics Portfolios
The figure displays the stock repartition (in %) for 2x3 characteristic-sorted portfolios on size (small and big) and book-to-market (low, medium and high) from July 1963 to December 2014. Panel A illustrates the results for the independent (Fama and French 1993) methodology with the NYSE breakpoints. Panel B illustrates the results for the sequential methodology in which the breakpoints are based on the whole sample (NYSE-NASDAQ-AMEX).
Panel A: Independent sort
Panel B: Sequential Sort
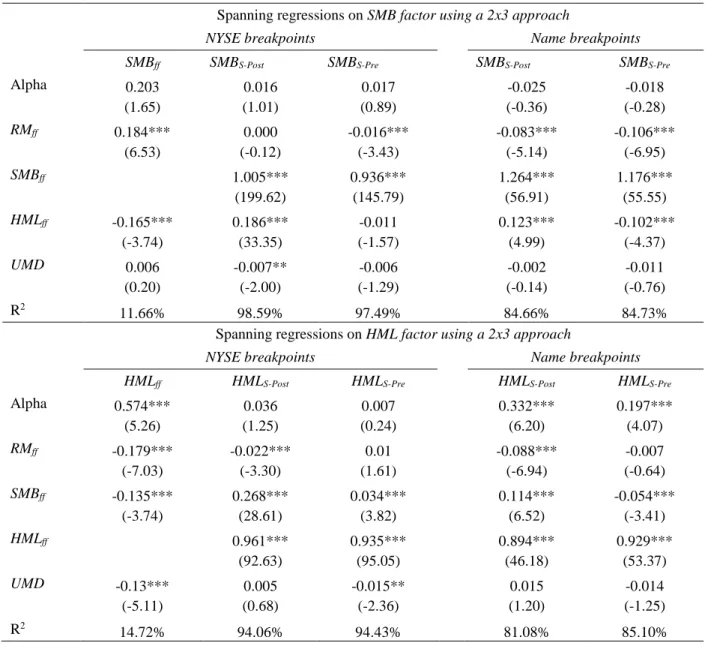
Table 2 Spanning Regressions: 2x3 Portfolios and Breakpoints Definition
The table reports the spanning regression results for the alternative size and value factors. T-statistics of the estimation parameters are in parentheses. The significance of the parameter estimates is reported as performed. *, **, and *** and indicate statistical significance at the 0.1, 0.05 and 0.01 levels, respectively. Breakpoints are defined according to either the NYSE (left panel) or the whole sample breakpoints (right panel). The denomination “S-Post” refers to a post-conditioning on the control variable, whereas “S-Pre” refers to a pre-conditioning on the control variable. For instance, HMLS-Post represents the value factor when stocks are first sorted by their book-to-market ratio (variable to be priced) and then by their market equity.
HMLS-Pre represents the value factor when stocks are first sorted by the market equity (control variable) and then by the book-to-market equity. The same process applies for the size premium. The period used to perform the regressions ranges from July 1963 to December 2014.
Spanning regressions on SMB factor using a 2x3 approach
NYSE breakpoints Name breakpoints
SMBff SMBS-Post SMBS-Pre SMBS-Post SMBS-Pre
Alpha 0.203 0.016 0.017 -0.025 -0.018 (1.65) (1.01) (0.89) (-0.36) (-0.28) RMff 0.184*** 0.000 -0.016*** -0.083*** -0.106*** (6.53) (-0.12) (-3.43) (-5.14) (-6.95) SMBff 1.005*** 0.936*** 1.264*** 1.176*** (199.62) (145.79) (56.91) (55.55) HMLff -0.165*** 0.186*** -0.011 0.123*** -0.102*** (-3.74) (33.35) (-1.57) (4.99) (-4.37) UMD 0.006 -0.007** -0.006 -0.002 -0.011 (0.20) (-2.00) (-1.29) (-0.14) (-0.76) R2 11.66% 98.59% 97.49% 84.66% 84.73%
Spanning regressions on HML factor using a 2x3 approach
NYSE breakpoints Name breakpoints
HMLff HMLS-Post HMLS-Pre HMLS-Post HMLS-Pre
Alpha 0.574*** 0.036 0.007 0.332*** 0.197*** (5.26) (1.25) (0.24) (6.20) (4.07) RMff -0.179*** -0.022*** 0.01 -0.088*** -0.007 (-7.03) (-3.30) (1.61) (-6.94) (-0.64) SMBff -0.135*** 0.268*** 0.034*** 0.114*** -0.054*** (-3.74) (28.61) (3.82) (6.52) (-3.41) HMLff 0.961*** 0.935*** 0.894*** 0.929*** (92.63) (95.05) (46.18) (53.37) UMD -0.13*** 0.005 -0.015** 0.015 -0.014 (-5.11) (0.68) (-2.36) (1.20) (-1.25) R2 14.72% 94.06% 94.43% 81.08% 85.10%
Table 2 shows that when defining the factors using name breakpoints, the SMB and HML premiums are independent from the momentum effect under both sequential frameworks. The sequential framework that ends with the dimension to be priced together with the name breakpoint induces a small negative correlation between the SMB and the HML factors. This evidence was not found in Table 1, in which a small positive correlation was found for the HML factor. We are comfortable concluding that
unlike the independent and S-Post approaches, the S-Pre sequential framework along with the whole sample breakpoints avoids the tilt of value stocks within small caps.
The factors defined under a sequential approach (S-Post or S-Pre) using the whole sample breakpoints add information to the traditional 2x3 independent framework using the NYSE breakpoints (the alphas of the regressions are significant at the usual significance levels). Pre-conditioning on the pricing factor induces a tilt of the value factor toward small-value stocks, as evidenced by the significant positive exposure of the HML factor to SMB. The second sequential procedure, which consists of performing a conditional sort on the variable to be priced as the last step, produces only a tiny (and even negative) exposure to the size factor (from 11.4% to -5.4%) after controlling for other sources of risks. Both sequential factors tend to hedge (through the long and short positions) the risk related to size within the HML factor and vice versa. Name breakpoints insure that the long and short legs have the same level of diversification in terms of numbers of firms. The consequence is caused by the negative correlation between size and HML factors. The sorting procedure underlying HMLS-Post adds exposure to the size effect to compensate for the
intrinsic negative exposure by nature (i.e., by reducing weight on large-cap portfolios within book-to-market portfolios). The logic underlying the HMLS-Pre factor is different. The premium adjusts exposure to
size by shorting small stocks (reducing the weight on these stocks), as shown in Table 2.
3.2. Name/NYSE breakpoints and 3x3 portfolios
We now consider a 3x3 sorting procedure that puts equal weight on each risk dimension. Spanning tests on sequential factors (under S-Post and S-Pre) defined using name/NYSE breakpoints and 3x3 multiple sorting are displayed at Table 3 for comparison.
Table 3 Spanning Regressions: 3x3 Portfolios and Breakpoints Definition
The table reports the spanning regression results for the alternatives size and value factors. T-statistics of the estimation parameters are in parentheses. The significance of the parameter estimates is reported as performed. *, **, and *** and indicate statistical significance at the 0.1, 0.05 and 0.01 levels, respectively. Breakpoints are defined according to either the NYSE (left panel) or the whole sample breakpoints (right
panel). The denomination “S-Post” refers to a pre-conditioning on the characteristics to be priced, whereas “S-Pre” refers to a pre-conditioning on the control variable. For instance, HMLS-Post represents the value factor when stocks are first sorted by their book-to-market ratio (variable to be priced) and then by their market equity. HMLS-Pre represents the value factor when stocks are first sorted by the market equity (control variable) and then by the book-to-market equity. The same process applies for the size premium. The period used to perform the regressions ranges from July 1963 to December 2014.
Panel A - Spanning regressions on SMB factors
2x3 and name breakpoints 3x3 and NYSE breakpoints 3x3 and name breakpoints
SMBS-Post SMBS-Pre SMBS-Post SMBS-Pre SMBS-Post SMBS-Pre
Alpha -0.025 -0.018 0.004 -0.003 0.089 0.015 (-0.36) (-0.28) (0.09) (-0.08) (0.79) (0.13) RMff -0.083*** -0.106*** -0.011 -0.038*** -0.173*** -0.167*** (-5.14) (-6.95) (-1.47) (-5.76) (-6.55) (-6.53) SMBff 1.264*** 1.176*** 1.234*** 1.166*** 1.351*** 1.345*** (56.91) (55.55) (114.86) (126.71) (36.94) (38.12) HMLff 0.123*** -0.102*** 0.261*** -0.042*** 0.157*** -0.106*** (4.99) (-4.37) (22.01) (-4.12) (3.89) (-2.71) UMD -0.002 -0.011 -0.005 -0.008 -0.021 -0.039 (-0.14) (-0.76) (-0.59) (-1.22) (-0.81) (-1.56) R2 84.66% 84.73% 95.82% 96.70% 69.26% 71.87%
Panel B - Spanning regression on HML factors
2x3 and name breakpoints 3x3 and NYSE breakpoints 3x3 and name breakpoints
HMLS-Post HMLS-Pre HMLS-Post HMLS-Pre HMLS-Post HMLS-Pre
Alpha 0.332*** 0.197*** 0.072** 0.043 0.402*** 0.262*** (6.20) (4.07) (2.53) (1.43) (7.32) (5.46) RMff -0.088*** -0.007 -0.042*** -0.006 -0.095*** -0.034*** (-6.94) (-0.64) (-6.28) (-0.85) (-7.31) (-3.02) SMBff 0.114*** -0.054*** 0.256*** -0.041*** 0.073*** -0.104*** (6.52) (-3.41) (27.86) (-4.23) (4.09) (-6.64) HMLff 0.894*** 0.929*** 0.954*** 0.9*** 0.883*** 0.852*** (46.18) (53.37) (94.04) (83.55) (44.52) (49.21) UMD 0.015 -0.014 0.007 -0.017** 0.016 0.01 (1.20) (-1.25) (1.09) (-2.43) (1.22) (0.90) R2 81.08% 85.10% 94.31% 93.29% 80.35% 83.85%
We can compare NYSE breakpoints with name breakpoints for a 3x3 sort using information from Table 3. A 3x3 sort using name breakpoints significantly decreases the size effects embedded in the
conditional HML factor after pre-conditioning on the book-to-market (HMLS-Post). NYSE breakpoints induce
a correlation with the momentum effect, as shown by the significance of the momentum factor when explaining the HML sequential factor (pre-conditioning on control variables, HMLS-Pre). Comparing the
R-squared of the regressions, we can conclude that using name breakpoints instead of NYSE breakpoints significantly affects the composition risk factors. Working under a 2x3 or a 3x3 framework does not have a significant impact.
4. Triple sort on 3x3x3 portfolios
This section extends the method of a conditional sorting procedure using a triple sort (momentum, book-to-market and market capitalization) on name breakpoints. It can be viewed as an extension of the approach to two control variables and one pricing factor. We consider three risk dimensions (size, value and momentum) with a pre-conditioning on momentum to control for the business cycle, earnings surprise and profitability shocks. For illustrative purposes, Figure 7 displays the formation of the large momentum-value-size portfolio by first sorting by momentum, then book-to-market (control variables), and finally size (priced variable). In total, the US stock universe would be composed of 27 portfolios that are used to reconstruct one single factor (either size or value).
Figure 7 Sequential Sorting (3x3x3): Pre-conditioning method
The figure illustrates the three-dimensional sequential sorting procedure by pre-conditioning on the control variables. The illustration shows the construction of the size premium (SMB) by pre-conditioning on the momentum, then the book-to-market ratio (control variables) and finally sorting on the market capitalization (priced variable).
Under such a framework (i.e., "S-Pre", 3x3x3 and name breakpoints), it is important to note that when pricing the size factor, a book-to-market ratio (second sort) of 0.5 may put a stock in the high B/M portfolio in one momentum-size portfolio (first sort), in the medium B/M in another, and in the low B/M in the third. What matters is that among those sub-portfolios, stocks with low market capitalization (last sort) outperform the large market caps. By doing so, the method ensures that the stocks with high B/M is attributable to tiny market caps do not drive up the HML premium. As in Fama and French (1993: p.12), we refer to these stocks as "fallen angels" as a reference to “big firms with low stock prices.” Moreover, a stock whose own characteristics remain unchanged may move to another B/M classification even if the full
B/M cross-section does not change in a year. This movement could happen if the stock returns follow an upward trend that would inflate its market value and wrongly affect its B/M ratio. An independent sorting would miss this information and incorrectly conclude a low B/M. Such flexibility in stock migration is certainly a core element of the S-Pre procedure, since it advocates that the classification for one of the priced variables (e.g., book-to-market) should not be affected by the other (e.g., market equity).
The first conclusion that could be drawn from Table 4 is that working in higher dimensions produces factors that are less correlated with the FF factors (based on the R-squared). Similar to the other sequential sorting, the risk factors defined in a sequential 3x3x3 whole sample breakpoints are not affected by a momentum effect, unlike the FF factors. A size premium defined under a sequential framework is between 1.2 and 1.4 times stronger than the independent 2x3 size premium. Pre-conditioning or post-conditioning significantly alters the definition of the premium. Pre-post-conditioning on the pricing variable induces a positive relationship between the size and value effects (value stocks tend to be small caps), but a negative effect when first conditioning on the control variables. This contrasted relationship is even stronger under the 3x3x3 sort in which the SMB factor becomes totally independent from the value effect under the S-Pre framework. The sequential value premium when pre-conditioning on control variables is also less dependent on market conditions. All these results can be found in Table 4 .
Table 4 Spanning Regressions: NxN Portfolios on Name Breakpoints
The table reports the spanning regression results for the alternative size and value factors. T-statistics of the estimation parameters are in parentheses. The significance of the parameter estimates is reported as performed. *, **, and *** and indicate statistical significance at the 0.1, 0.05 and 0.01 levels, respectively. Breakpoints are defined according to the whole sample breakpoints. The denomination “S-Post” refers to a post-conditioning on the control variable, whereas “S-Pre” refers to a pre-conditioning on the control variable. For instance, HMLS-Post represents the value factor when stocks are first sorted by their book-to-market ratio (variable to be priced) and then by their book-to-market equity. HMLS-Pre represents the value factor when stocks are first sorted by their market equity (control variable) and then by their book-to-market
equity. The same process applies to the size premium. The period used to perform the regressions ranges from July 1963 to December 2014.
Panel A - Spanning regressions on SMB factors using name breakpoints
2x3 3x3 3x3x3
SMBS-Post SMBS-Pre SMBS-Post SMBS-Pre SMBS-Post SMBS-Pre
Alpha -0.025 -0.018 0.089 0.015 0.096 0.075 (-0.36) (-0.28) (0.79) (0.13) (0.82) (0.71) RMff -0.083*** -0.106*** -0.173*** -0.167*** -0.175*** -0.131*** (-5.14) (-6.95) (-6.55) (-6.53) (-6.31) (-5.27) SMBff 1.264*** 1.176*** 1.351*** 1.345*** 1.329*** 1.216*** (56.91) (55.55) (36.94) (38.12) (34.62) (35.38) HMLff 0.123*** -0.102*** 0.157*** -0.106*** 0.168*** -0.058 (4.99) (-4.37) (3.89) (-2.71) (3.95) (-1.53) UMD -0.002 -0.011 -0.021 -0.039 -0.037 0.005 (-0.14) (-0.76) (-0.81) (-1.56) (-1.36) (0.22) R2 84.66% 84.73% 69.26% 71.87% 66.40% 68.65%
Panel B - Spanning regression on HML factors using name breakpoints
2x3 3x3 3x3x3
HMLS-Post HMLS-Pre HMLS-Post HMLS-Pre HMLS-Post HMLS-Pre
Alpha 0.332*** 0.197*** 0.402*** 0.262*** 0.371*** 0.237*** (6.20) (4.07) (7.32) (5.46) (6.42) (4.79) RMff -0.088*** -0.007 -0.095*** -0.034*** -0.092*** -0.022* (-6.94) (-0.64) (-7.31) (-3.02) (-6.74) (-1.90) SMBff 0.114*** -0.054*** 0.073*** -0.104*** 0.103*** -0.081*** (6.52) (-3.41) (4.09) (-6.64) (5.47) (-5.04) HMLff 0.894*** 0.929*** 0.883*** 0.852*** 0.881*** 0.73*** (46.18) (53.37) (44.52) (49.21) (42.23) (40.97) UMD 0.015 -0.014 0.016 0.01 0.014 0.001 (1.20) (-1.25) (1.22) (0.90) (1.07) (0.10) R2 81.08% 85.10% 80.35% 83.85% 78.37% 77.99%
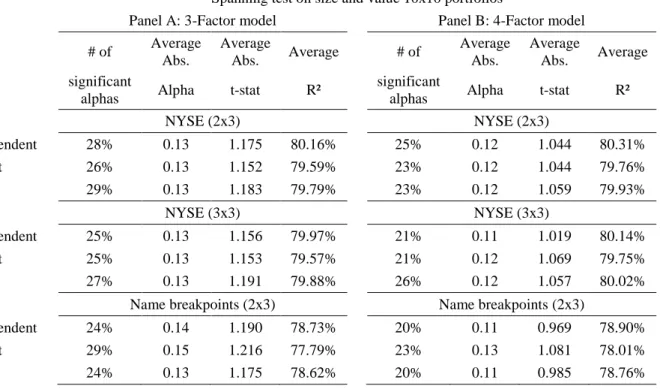
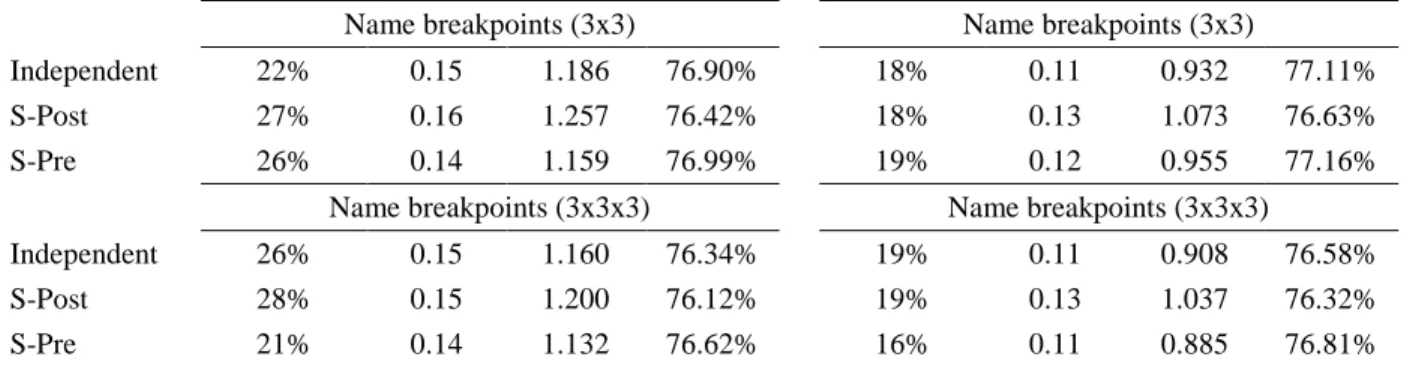
Table 5 uses all previous configurations of factors (including the general case of a 3x3x3) for pricing 10x10 book-to-market/market capitalization portfolios. We perform either a 3-factor or a 4-factor model and analyze the cross-section of alphas through (i) the percentage of portfolios for which the alphas are significant at the 10% level, (ii) the average absolute alphas and t-stat, and (iii) the average adjusted R-square. The table shows that the best pricing is achieved for the sequential 3x3x3 defined using whole sample breakpoints as shown by the lowest percentage of significant portfolios achieved in this category.
Table 5 Pricing errors on 10x10 Size and Value Portfolios
This table exhibits specification errors (α) for the 100 portfolios sorted on size (market equity) and value (book-to-market equity) made available on Ken French’s website. The results are reported for the size and value factors based on three methodologies of construction: an independent sort (Fama and French 1993), a dependent sort (S-Post) with pre-conditioning on the variable to be priced and a dependent sort (S-Pre) with pre-conditioning on the control variable(s). The results are also displayed according to the definition of the breakpoints used to construct the factors (NYSE or whole sample). In the first column, we report the number of significant specification errors (alpha). In the second column, we report their average absolute alpha. In the third column, we report their average absolute t-statistics. Finally, in the fourth column, we report the average R-square of the spanning regressions. In Panel A, we use a 3-factor model composed of the excess market return (MKT-Rf), size (SMB) and value (HML). In Panel B, we use a 4-factor model composed of the 3-factor model and the momentum factor (UMD) from the Ken French library. The sample period ranges from July 1963 to December 2014. The threshold of significance for the intercept estimations is set to 10%.
Spanning test on size and value 10x10 portfolios
Panel A: 3-Factor model Panel B: 4-Factor model
# of Average Abs. Average Abs. Average # of Average Abs. Average Abs. Average significant
alphas Alpha t-stat R²
significant
alphas Alpha t-stat R²
NYSE (2x3) NYSE (2x3) Independent 28% 0.13 1.175 80.16% 25% 0.12 1.044 80.31% S-Post 26% 0.13 1.152 79.59% 23% 0.12 1.044 79.76% S-Pre 29% 0.13 1.183 79.79% 23% 0.12 1.059 79.93% NYSE (3x3) NYSE (3x3) Independent 25% 0.13 1.156 79.97% 21% 0.11 1.019 80.14% S-Post 25% 0.13 1.153 79.57% 21% 0.12 1.069 79.75% S-Pre 27% 0.13 1.191 79.88% 26% 0.12 1.057 80.02%
Name breakpoints (2x3) Name breakpoints (2x3)
Independent 24% 0.14 1.190 78.73% 20% 0.11 0.969 78.90%
S-Post 29% 0.15 1.216 77.79% 23% 0.13 1.081 78.01%
Name breakpoints (3x3) Name breakpoints (3x3)
Independent 22% 0.15 1.186 76.90% 18% 0.11 0.932 77.11%
S-Post 27% 0.16 1.257 76.42% 18% 0.13 1.073 76.63%
S-Pre 26% 0.14 1.159 76.99% 19% 0.12 0.955 77.16%
Name breakpoints (3x3x3) Name breakpoints (3x3x3)
Independent 26% 0.15 1.160 76.34% 19% 0.11 0.908 76.58%
S-Post 28% 0.15 1.200 76.12% 19% 0.13 1.037 76.32%
S-Pre 21% 0.14 1.132 76.62% 16% 0.11 0.885 76.81%
Table 5 shows that the need for a momentum factor to price the 10x10 portfolios is more important (comparing the number of significant alphas from Panel A to Panel B) when using name breakpoints and the sequential procedure, since these construction features lead to factors exempted from a momentum effect.
When controlling for momentum (Panel B), the improvement in pricing power is almost observed at each methodological step (S-Pre, name breakpoints, and three-dimension sorting). The illustration is provided in Figure 8.
Figure 8 Percentage of significant alphas under each framework
The figure presents the percentage of portfolios left with a significant intercept at a 90 percent confidence interval. The results are from Panel B of
and the regression model is the Carhart 4-factor model composed of the excess market return (MKT-Rf), size (SMB), value (HML) and the momentum factor (WML) from the Ken French library. The results are presented for the independent (gray), S-Post (red), and S-Pre (blue) sorting methodologies. The sample period ranges from July 1963 to December 2014.
Moreover, the need for a momentum factor when pricing the 10x10 portfolios is more important (comparing the number of significant alphas from Panel A to Panel B) when using name breakpoints and sequential procedures, as these construction features lead to factors being exempted from a momentum effect.
5. Discussion
The paper examines the pricing impact of a set of methodological choices when building empirical mimicking portfolios that account for the traditional Fama-French-Carhart risk factors.
Comparing a sequential sorting (pre-conditioning or post-conditioning on the control factors) with name breakpoints to an independent sorting, we observe the following. First, both sets of sequential factors are robust to momentum effect. Second, both conditional HML factors produce significant and positive alphas with respect to the original HML factor. However, sequential SMB factors are just adjusted for value effects (upward for the S-Post framework and downward for the S-Pre framework). Third, using name breakpoints, the HMLS-Pre factor tends to short the size factor to hedge for size effects, whereas HMLS-Post
takes a long position with respect to size-related risks. A triple sorting induces about the same effect as the name breakpoints when operated separately.
From the decomposition of the empirical choices for constructing the hedge portfolios, we obtain the following.
Using a dependent versus a sequential approach leads to different pricing effects, especially with respect to the impact of momentum and more generally of market conditions on the size and value premiums.
In the case of a dependent sort, pre-conditioning or post-conditioning on the control variable(s) affects the meaning of the factor. A post-conditioning will simply reallocate weights among the controls, whereas pre-conditioning performs an effective filter. The consequence illustrated in this paper for the size and book-to-market effects is that the pre-conditioning sorting approach produces a value factor that is almost independent of the small-value effect.
Using whole sample breakpoints allows for resilient breakpoints across time and avoids a momentum effect.
Section 4 shows that the best pricing performance is achieved when adding a multiple sorting procedure. The sequential framework that pre-conditions on control variables answers the question, “how profitable is the part of SMB (resp. HML) that is orthogonal to the other factors?” To answer this question, the sequential methodology orthogonalizes the rankings that underlie the sort of stocks into portfolios without the need to perform an a posteriori regression.
The control of other factors is made within the construction methodology thanks to the conditional sort on the control factors. We claim that our Seq-Pre methodology that pre-conditions on the control variables manages to price independent effects. The methodology itself implies that shorting small stocks within the value portfolio to reduce the tilt toward tiny stocks creates an imbalance in portfolios. We claim to achieve similar objectives within the factor construction by performing a time-series regression of the original FF factors on other factors and interpreting the intercepts.
For instance, the FF-generated HML against MKT-Rf, SMB, and UMD has an intercept of 0.574 and a t-stat of 5.26 (Table 1). In Panel B of Table 6, the t-stat for HMLS-Pre using name breakpoints and a 3x3x3 sort is close to that value (t-stat = 4.70). This result is achieved without any ex post adjustments using
regression analysis. This suggests that the alternative methodology discussed in this paper also plays the role of the regression analysis that is necessary to adjust the FF value premium.
To conclude, the sequential sort S-Pre does all the work "all-in-one" as a single operation. It more accurately captures the return spread associated with the source of risk to be priced. It directly tells whether the return variation related to the third risk criterion still exists even after having controlled for two other risk dimensions. The sorting procedure involves performing a sequential sort in three stages. The first two sorts are performed on control risks, followed by the risk dimension to be priced. Alternative paths regarding the controls have been tested and entirely support our results.
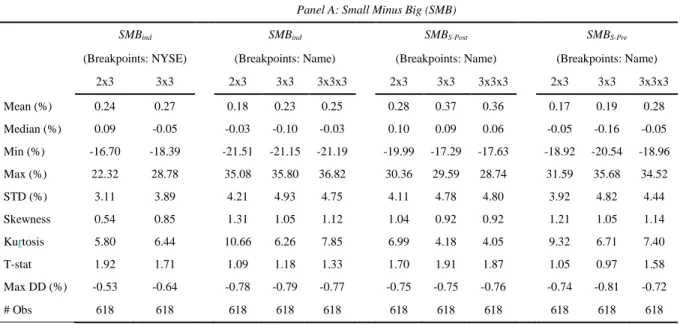
The outcomes of the various methodological choices discussed throughout the paper, when translated in terms of the descriptive statistics of the resulting samples, are reported in Table 6.
Table 6 Descriptive Statistics of the Size and Value Premium
This table reports the descriptive statistics of the size (SMB) and value (HML) premium for the different factor construction methodologies. The results are displayed in percentages. Panel A and Panel B show the results for SMB and HML, respectively. The abbreviation “STD” refers to the standard deviation, “Max DD” is for the maximum drawdown and “# Obs” is for the number of observations in our sample. The sample period ranges from July 1963 to December 2014.
Panel A: Small Minus Big (SMB)
SMBind SMBind SMBS-Post SMBS-Pre
(Breakpoints: NYSE) (Breakpoints: Name) (Breakpoints: Name) (Breakpoints: Name) 2x3 3x3 2x3 3x3 3x3x3 2x3 3x3 3x3x3 2x3 3x3 3x3x3 Mean (%) 0.24 0.27 0.18 0.23 0.25 0.28 0.37 0.36 0.17 0.19 0.28 Median (%) 0.09 -0.05 -0.03 -0.10 -0.03 0.10 0.09 0.06 -0.05 -0.16 -0.05 Min (%) -16.70 -18.39 -21.51 -21.15 -21.19 -19.99 -17.29 -17.63 -18.92 -20.54 -18.96 Max (%) 22.32 28.78 35.08 35.80 36.82 30.36 29.59 28.74 31.59 35.68 34.52 STD (%) 3.11 3.89 4.21 4.93 4.75 4.11 4.78 4.80 3.92 4.82 4.44 Skewness 0.54 0.85 1.31 1.05 1.12 1.04 0.92 0.92 1.21 1.05 1.14 Kurtosis 5.80 6.44 10.66 6.26 7.85 6.99 4.18 4.05 9.32 6.71 7.40 T-stat 1.92 1.71 1.09 1.18 1.33 1.70 1.91 1.87 1.05 0.97 1.58 Max DD (%) -0.53 -0.64 -0.78 -0.79 -0.77 -0.75 -0.75 -0.76 -0.74 -0.81 -0.72 # Obs 618 618 618 618 618 618 618 618 618 618 618
Panel B: High Minus Low (HML) HMLind HMLind HMLS-Post HMLS-Pre
(Breakpoints: NYSE) (Breakpoints: Name) (Breakpoints: Name) (Breakpoints: Name) 2x3 3x3 2x3 3x3 3x3x3 2x3 3x3 3x3x3 2x3 3x3 3x3x3 Mean (%) 0.36 0.37 0.56 0.59 0.58 0.65 0.70 0.68 0.51 0.53 0.47 Median (%) 0.35 0.44 0.54 0.56 0.60 0.57 0.66 0.6 0.46 0.59 0.47 Min (%) -13.11 -15.76 -17.81 -17.36 -13.14 -11.39 -10.81 -10.81 -18.48 -16.36 -13.99 Max (%) 13.91 13.33 14.00 12.96 11.18 13.17 13.86 14.19 13.80 11.63 11.90 STD (%) 2.87 2.88 3.01 2.93 2.64 2.92 2.93 2.94 2.96 2.82 2.49 Skewness -0.01 -0.16 -0.16 -0.35 -0.09 0.22 0.24 0.25 -0.40 -0.39 -0.40 Kurtosis 2.70 3.74 4.90 4.75 3.34 2.23 2.55 2.42 5.48 4.05 4.60 T-stat 3.14 3.20 4.64 5.01 5.44 5.52 5.95 5.73 4.25 4.70 4.70 Max DD (%) -0.45 -0.49 -0.48 -0.51 -0.46 -0.41 -0.38 -0.38 -0.49 -0.50 -0.45 # Obs 618 618 618 618 618 618 618 618 618 618 618
Table 6 displays a volatile size premium over the period. It is weakly significant under the FF construction method (SMBind under the NYSE breakpoints). The significance tends to weaken as methodological changes are made, with the noticeable exception of the S-Post procedure. Under that approach, significance levels remain moderate (t-stats between 1.70 and 1.91) but the premium becomes economically larger and even more volatile. In contrast, the S-Pre procedure leads to a lower size premium and a significance that vanishes, regardless of the sorting configuration.6
In contrast, Panel B of Table 6 presents a rather strong and stable value effect throughout all methodological choices. The value effect becomes much stronger under a sequential and name breakpoints framework. Compared to the FF world, the level of magnitude of the value premium with the sequential method largely increases (from an average 0.36 to 0.47-0.70), whereas the volatility of the samples remains similar when the post-conditioning (S-Pre) sorting approach is employed.
6 The similar or slightly larger average level of the size premium together with a higher volatility could be related to
the strong association between size and January effects, which leads the premium to only appear significant once per year (see for instance, Schwert 2003, van Dijk 2011).
Overall, comparing the original “Independent, 2x3, NYSE breakpoints” original set of Fama-French factors with the one resulting from the most efficient methodological refinements, namely, the “pre-conditioning sequential, 3x3x3, Name breakpoints,” yields noteworthy changes. The size premium becomes more volatile but not larger and the significance drops, whereas the value premium unequivocally increases in economic and statistical significance terms. From a financial market perspective, one moves from two original FF spread portfolios returns that sum up to a monthly average of 60 bps (24+36) to a new pair of empirical factors amounting to 75 bps (28+47), but it is unevenly distributed. Thus, in addition to the methodological justification that legitimizes the use of a sequential procedure, the economic content of the resulting premiums is likely to be largely different. We expect this better identification to have implications in factor investing and asset pricing.
6. Conclusion
In this paper, we claim that naive portfolio sorts can lead to the definition of poorly designed fundamental risk factors. In turn, these shortcomings will affect the quality of benchmarks. Each portfolio sorting choice induces specific assumptions. One should carefully select the criteria before producing risk factors. To date, despite the critical importance of this challenge, no study has been dedicated to the comprehensive analysis of the consequences of alternative spread portfolio constructions. This analysis has always been approached as a byproduct of empirical studies. With our purely methodological paper, we aim to fill this gap in the literature, which is not the most exciting area of the finance research, but we view it as important.
Using name breakpoints reduces the momentum within the size and the reversal of the value effects. The results are quite robust for multi-dimensional sorts. Given the intrinsic correlation between all these characteristics, the sequential sorting procedure is a powerful tool that adjusts the impact of external factors. With post-conditioning on the control variables, it adjusts the weights of their impacts on the spread. Through a pre-conditioning on the controls, the procedure almost eliminates the impacts of external factors. Our results indicate that the latter sequencing approach has better statistical and economic properties than
the former. From a statistical point of view, sequential sorts reduce the correlation between the factors (controlling for other factors). From a trading point of view, this means that the factors represent the returns of a pure strategy that hedge against the external correlated risks by shorting the size factor for capturing a pure value premium.
Naturally, the evidence presented here is limited to the Fama-French-Carhart set of original factors, but those factors are very influential in the empirical asset pricing literature. With simple refinements in the factor construction methodology, we have uncovered a new series of fundamental risk premiums, which are both “purer” from a logical point of view and largely different from the standpoint of their magnitudes (weaker and insignificant size effects, stronger and more significant value effects). These new premiums should be of interest to both empirical researchers and asset management practitioners.
Beyond the original size-value-momentum four-factor model, our article paves the way for the systematic use of a (preferably pre-conditioning on the control variable(s)) sequential approach for the construction of spread portfolios mimicking multi-dimensional risk factors. The empirical asset pricing literature has witnessed a multiplication of K-factor models rooted in the Fama-French tradition, such as the extended 5-factor model (Fama and French 2016), the q-factor model (Hou et al. 2016), and the recent mispricing factors (Stambaugh and Yuan 2017), among others. Currently, there are more than 25 “candidate” spread portfolios for explaining the same cross-section of stock returns (see Cooper and Maio 2017 for a discussion). What are the implications of their construction procedure for their explanatory power? Could a more accurate portfolio construction process lead to greater parsimony in the design of factor models, or are some of the attributes proposed in the literature genuinely associated with identifiable risk factors? Our methodological discussion could answer these important questions. These research directions occupy a prominent position in our future research agenda.
References
Agarwal V, Bakshi G, Huij J (2009) Do higher-moment equity risks explain hedge fund returns? Robert
H. Smith School Research Paper No. RHS 06-153.
Ang A, Hodrick RJ, Xing Y, Zhang X (2006) The cross-section of volatility and expected returns. J. Fin. 61(1):259–299.
Back K, Kapadia N, Ostdiek B (2013) Slopes as factors: Characteristic pure plays. SSRN Journal.
Balduzzi P, Robotti C (2010) Asset pricing models and economic risk premia: A decomposition. J. Empirical Fin. 17(1):54–80.
Ball R, Gerakos J, Linnainmaa JT, Nikolaev VV (2015) Deflating gross profitability. J. Financ. Econ. 117(2):225–248.
Banz RW (1981) The relationship between return and market value of common stocks. J. Financ. Econ. 9(1):3–18.
Basu S (1983) The relationship between earnings’ yield, market value and return for NYSE common stocks. J. Financ. Econ. 12(1):129–156.
Carhart M (1997) On persistence in mutual fund performance. J. Fin. 52(1): 57–82.
Connor G (1995) The three types of factor models: A comparison of their explanatory power. Financ. Anal. J. 51(3):42–46.
Cooper I, Maio P (2017) New Evidence on Conditional Factor Models. SSRN Journal.
Cremers M, Petajisto A, Zitzewitz E (2012) Should benchmark indices have alpha ? Revisiting performance evaluation. Critical Finance Review 2:1–48.
Daniel K, Grinblatt M, Titman S, Wermers R (1997) Measuring mutual fund performance with characteristic-based benchmarks. J. Fin. 52(3):1035–1058.
Daniel K, Titman S (1998) Characteristics or covariances? J. Portfol. Manag. 4:24–33.
Fama EF, French KR (1993) Common risk factors in the returns on stocks and bonds. J. Financ. Econ. 33(1):3–56.