HAL Id: hal-03147515
https://hal.inria.fr/hal-03147515
Submitted on 20 Feb 2021
HAL is a multi-disciplinary open access
archive for the deposit and dissemination of
sci-entific research documents, whether they are
pub-lished or not. The documents may come from
teaching and research institutions in France or
abroad, or from public or private research centers.
L’archive ouverte pluridisciplinaire HAL, est
destinée au dépôt et à la diffusion de documents
scientifiques de niveau recherche, publiés ou non,
émanant des établissements d’enseignement et de
recherche français ou étrangers, des laboratoires
publics ou privés.
Itinerary Recommendation Algorithm in the Age of
MEC
Sand Luz Correa, Kleber Vieira Cardoso, Felipe Fonseca, Lefteris Mamatas,
Aline Carneiro Viana
To cite this version:
Sand Luz Correa, Kleber Vieira Cardoso, Felipe Fonseca, Lefteris Mamatas, Aline Carneiro Viana.
Itinerary Recommendation Algorithm in the Age of MEC. [Research Report] Inria Saclay Ile de France.
2021. �hal-03147515�
Itinerary Recommendation Algorithm in the Age
of MEC
Sand L. Correa, Kleber V. Cardoso, Felipe F. Fonseca, Lefteris Mamatas, and Aline C. Viana
Abstract—To provide fully immersive mobile experiences, next-generation touristic services will rely on the high bandwidth and low latency provided by the 5G networks and the Multi-access Edge Computing (MEC) paradigm. Recommendation algorithms, being integral part of travel planning systems, devise personalized tour itineraries for a user considering the popularity of the Points of Interest (POIs) of a city as well as the tourist preferences and constraints. However, in the context of next-generation touristic services, recommendation algorithms should also consider the applications (e.g., augmented reality) the tourist will consume in the POIs and the quality in which such applications will be delivered by the MEC infrastructure. In this paper, we address the joint problem of
recommending personalized tour itineraries for tourists and efficiently allocating MEC resources for advanced touristic applications. We formulate an optimization problem that maximizes the itinerary score of individual tourists, while optimizing the resource allocation at the network edge. We then propose an exact algorithm that quickly solves the problem optimally considering instances of realistic size. Finally, we evaluate our algorithm using a real dataset extracted from Flickr. Results demonstrate gains up to 100% in the resource allocation and user experience in comparison with a state-of-the-art solution.
Index Terms—Travel itinerary recommendation, Next-generation touristic services, Multi-access edge computing, 5G networks.
F
1
I
NTRODUCTIONT
He advent of 5G networks and relevant communication paradigms, such as the Multi-Access Edge Computing (MEC) [1] and Network Slicing [2], will drive new busi-ness models in nearly every vertical industry. Together, these technologies can provide extensive coverage, higher capacity, increased reliability, and low latency to a large number of connected devices on the top of a shared in-frastructure. The new opportunities will impact the entire mobile network ecosystem. For example, end-users will be able to experience new services that could not be satisfied with current technologies; service providers will be able to tailor network services to their specific needs, while mobile network operators will be able to target new markets.An example of such a market is Tourism, an important sector that accounts for nearly 10% of the world’s Gross Domestic Product [3]. Indeed, 5G is foreseen as an essential enabler for next-generation touristic services, as demon-strated by existing initiatives from academic institutions, mobile network operators and public sectors [4], [5]. With the improved communication and computation capabilities provided by 5G, tourists will be able to benefit from immer-sive technologies (e.g., virtual, augmented, or mixed reality – VR/AR/MR) to augment and extend their sight-seeing activities, enjoy integrated transport, accommodation, and entertainment services, as well as to communicate with other tourists using new social-networking based ways. Consequently, tourists will be seeking an advanced, com-bined physical, and virtual visiting experience.
Felipe Fonseca, Sand Correa and Kleber Cardoso are with the Instituto de Inform´atica, Universidade Federal de Goi´as, Goiˆania - GO, Brazil (e-mails: [email protected], [email protected], [email protected]).
Lefteris Mamatas is with University of Macedonia, Thessaloniki, Greece (email:[email protected]).
Aline C. Viana is with Inria, Palaiseau, France (email: [email protected]).
On the other hand, algorithms for recommending per-sonalized tour itineraries have become integral components of travel planning systems. Given the tourist interests and preferences, the goal of such algorithms is to improve the touristic experience by identifying a set of Points of Interest (POIs) and schedule them as an itinerary with various time and space constraints [6]. To accomplish this task, algo-rithms for recommending tour itineraries are often proposed as a combinatorial problem called the Orienteering Problem (OP) [7]. Here, given a graph with nodes representing the POIs of the city, edges being the travel routes between nodes, with costs on the edges and profits on the vertices, the algorithms find an itinerary with maximum profit for the tourist considering factors such as the popularity of the POIs, the tourist preferences, the distance between the POIs, and the tourist time limit to complete the tour (i.e., the tourist time budget). Indeed, the problem of recommending tour itineraries is not new and has been well-studied. The authors in [8], [9] present comprehensive surveys of heuris-tic and algorithmic approaches to the problem, while the works in [6], [10], [11], [12] focus on data-driven approaches to model the problem by extracting visiting-related statistics (e.g., the popularity of the POIs, the duration of visits, and the user interest on the category of the POI) from location-based social media such as Facebook, Flickr, and Foursquare.
However, to fulfill the physical and virtual expectations of tourists in next-generation touristic services, recommen-dation algorithms will also have to consider (i) the set of service applications the tourists will consume in the POIs and (ii) the quality in which such services will be deliv-ered, given the available resources in the Information and Communication Technology (ICT) infrastructure during the visits. Consider, for example, a Metropolitan Tourist Centre (MTC) that provides next-generation touristic services for its
tourists. Consider that the MTC provides a recommendation system to help the tourists to build their tour itineraries. The rough idea is that the recommendation system does not necessarily issue recommendations for the top-ranked itinerary according to the preferences of each user. Instead, it recommends itineraries to individual tourists that still match adequately with their preferences and, at the same time, optimize the ICT resource allocation at the network edge, when running the selected service applications. In this way, requirements involving both users’ preferences and MEC resource allocation are satisfied.
Although such recommendations can slightly affect the recommended POIs, they aim at higher MEC resource al-location efficiency and, thus, a better global physical and virtual experience. To the best of our knowledge, only our earlier conference paper [13] focuses on the problem of rec-ommending personalized itineraries for tourists taking into consideration the availability of the edge resources to run advanced touristic service applications. We here build on this prior effort by presenting a much more comprehensive investigation and offering the following contributions:
• We discuss related works and introduce our
contribu-tions to the literature (cf. Section 2).
• We define a system model that captures the joint prob-lem of (i) recommending personalized tour itineraries for multiple tourists and (ii) the efficient allocation of MEC resources that enables advanced touristic ser-vice applications (cf. Section 3). Our system model considers the popularity of the POIs, the preferences and time constraint of each tourist, the demands of the chosen service applications, and the availability of network/computing resources when deciding which itineraries to recommend.
• We define a novel problem, called MEC-aware Per-sonalized Tour Recommendation (MEC-PTR), that for-malizes the problem of recommending personalized tour itineraries for multiple tourists in the context of next-generation touristic services at the network edge (cf. Section 4). Given the set of POIs in a city and the interests of the tourists, the goal of the MEC-PTR problem is to find a set of itineraries (containing exactly one itinerary for each tourist) that maximizes the sum of the profits perceived by the tourists and prioritizes the ICT resource allocation at the network edge, while satisfying the tourists and infrastructure (service/ICT resources) constraints.
• Since the MEC-PTR problem is NP-hard, we devise an algorithm, named MEC-aware Personalized Itinerary Recommendation (MEC-PIR), that efficiently solves the MEC-PTR problem using a Dynamic Programming ap-proach and Mixed Integer Linear Programming (MILP) (cf. Section 5).
• We evaluate the effectiveness of MEC-PIR using a real dataset extracted from Flickr geotagged photos and Wikipedia. To better understand this dataset, we pro-vide an analysis of the visiting-related statistics ex-tracted from it (cf. Section 6). Although the method-ology to extract visiting information from Flickr has been proposed and used in other works [6], [10], [11], to the best of our knowledge, none of them provide an
exploratory analysis of the obtained dataset.
• We compare MEC-PIR with a modified version of a state-of-the-art solution for recommending personal-ized tour itinerary, the PersTour algorithm [6], which we named Resource-Aware PersTour (RA-PersTour) (cf. Section 6). To this end, to take into account the tourist experience, we propose a new metric that combines traditional recommendation scoring with attendance of service application demands. Results show that MEC-PIR achieves gains from near 20% up to 100% in both aspects, i.e., resource allocation efficiency and user experience while presenting a similar performance to RA-PersTour in traditional metrics for the evaluation of personalized itinerary recommendation. Results also show that MEC-PIR can solve the MEC-PTR problem optimally for instances of realistic size, in a reasonable amount of time.
Conclusions and future work directions are presented in Section 7.
2
R
ELATED WORKBroadly, works focused on generating tour itineraries can be classified into two sub-areas [14]: Operational Research and Location-based Recommendation. Next, we discuss relevant works in both sub-areas.
Operational Research.Indeed, the problem of
recommend-ing personalized tour itineraries has originated in the Op-erational Research community as the Tourist Trip Design Problem (TTDP). The authors in [15] have defined the generic TTDP as an extension of the Orienteering Problem (OP), where the objective is to schedule an optimal path (i.e., the path that maximizes the collected profit) for the tourist, given the set of candidate POIs and the travel time among them; the profit of each POI; the visiting duration at a POI; starting/ending POIs for the tour; and the tourist time budget. A comprehensive survey on the use of OP and Travel Salesman Problem (TSP) to model multiple variants of the TTDP was presented in [8] and [9]. An important drawback of these works, however, is the lack of individual preferences associated with individual tourists. As a con-sequence, the same tour itinerary is recommended to all tourists that provide as input the same starting/ending POIs and time budget.
Location-based Recommendation. With the popularity of
smartphones and the prevalence of location-based social media, several works have focused on data-driven ap-proaches to better model the tourist interest preferences when recommending POIs/itineraries. The main idea of these works is to exploit the tourism content, available in such services, to enable a deeper understanding of the user preferences and to issue personalized recommendations that satisfy these preferences. The works on location-based recommendation can be divided into three groups [14]: next POI recommendation, top-k POI recommendation, and tour itinerary recommendation. Next POI recommendation [16], [17] aims to identify the next location that a tourist is likely to visit based on her previous trajectories. Works on top-k lo-cation recommendation [18], [19] recommend multiple POIs as part of a ranked list, but they do not structure these POIs
as a connecting itinerary. Finally, works on tour itinerary recommendation [6], [10], [11], [12], [20], [21] recommend a sequence of POIs as a connecting path taking into account the interest preferences of the tourists, while adhering to the several temporal and spatial constraints. Works on tour itinerary recommendation can be further divided into those that focus on a group of tourists [20], [21] and those aim-ing at individual travelers [6], [10], [11], [12]. A survey on recommending tour itineraries using location-based social media can be found in [14]. Since our work falls into the category of location-based tour itinerary recommendation, in the following, we pinpoint some relevant works related to this topic.
Location-based Tour Itinerary Recommendation.The
au-thors in [10] are one of the first to combine an optimization-based approach and the mining of tourist past trajecto-ries based on geotagged photos, extracted from Flickr, to recommend personalized tour itineraries for an individual tourist. This combined approach was further refined in [6], [11] by assigning categories to POIs and using these POI categories to determine the interests of the tourist. Par-ticularly, the authors in [11] model the personalized tour recommendation for an individual tourist as a Generalized Maximum Coverage problem that optimizes for the POI popularity and the tourist interest. The latter is computed as the number of times the tourist has visited a POI of a certain category, relative to her total POI visits (frequency-based). PersTour [6] follows a similar approach, but it models the personalized tour recommendation as an OP and the tourist interest levels are computed based on the amount of time the tourist stays in a POI relative to the average tourist (time-based). In [6], it is shown that the time-based tourist interest approach reflects more accurately the real-life tours of users when compared to frequency-based tourist interest. The problem of recommending tour itineraries for an individual tourist where the trip duration takes more than a day is tackled in [12], where the authors use an anonymized Google historical visit dataset to mine tourist interests. Recommending tour itineraries for a group of tourists engaged in temporary mobile social networks (e.g., created for a conference/meeting) is the main focus of the work in [21].
Our contribution.Since our work focuses on
recommend-ing personalized tour itineraries for a one-day trip, it is conceptually more close to the investigations performed in [6], [10], [11]. Similar to these works, we also obtain POI visit information and tourist interests from past histories extracted from Flickr. However, we are distinctly different from all the previous works, since we consider the joint problem of recommending personalized tour itineraries for multiple tourists and the efficient allocation of MEC re-sources that enables advanced touristic service applications to be used by them to enrich their touristic experience. Thus, we introduce a novel multi-tourist perspective and recommend tour itineraries based on users’ preferences, the network/computing demand of the consumed service applications, and the availability of the MEC infrastructure.
MEC Internet MEC Cloud Cloud Access network MEC
Fig. 1. Tourist spots with ICT infrastructure.
3
S
YSTEM MODELWe consider a Metropolitan Tourist Centre (MTC) that aims to provide next-generation touristic services to enhance the experiences of tourists visiting a specific city. The MTC leases ICT resources from a mobile network operator in the form of a network slice. The network slice is composed of wireless coverage in each POI, MEC host capabilities near to the POIs, and remote cloud computing resources accessed through the Internet. Figure 1 illustrates the described sce-nario, in which the MTC manages only the virtualized infrastructure built for its demand, i.e., the MTC controls only its own network slice.
We assume that MTC provides a recommendation sys-tem helping tourists to build their tour itineraries. Tourists access the system before their trips, providing information such as the day they wish the tour to take place (we consider that the tourist is interested in a one-day tour), preferred starting and ending location, time limit to complete the tour, and their preferences concerning: (i) the categories of the POIs (e.g., Shopping, Entertainment, Historical, Museum, Sport, Park), and (ii) the set of service applications offered by the MTC (e.g., Augmented reality, Video streaming). Daily, the system retrieves all planned tours targeting the next day and generates a personalized tour itinerary for each tourist, detailing information about the POI visit se-quence and the appropriate time to arrive at and depart from each POI. The objective of the system is to find a set of itineraries that satisfies the following requirements:
• R1: the generated set contains exactly one itinerary for each tourist and this itinerary respects the time constraint of the tourist;
• R2: the amount of network and computing resources allocated for each itinerary takes into account the min-imum and maxmin-imum demands of the service applica-tions chosen by the tourist;
• R3: the sum of the amount of resources allocated for
the itineraries does not exceed network and computing capacity in the POIs at any given time of the tours;
• R4: the generated set maximizes the sum of the profits perceived by the tourists while prioritizing the MEC resource allocation.
Table 1 summarizes the notation used in the system model (Section 3) and the problem formulation (Section 4).
3.1 Main elements of the model
3.1.1 POIs
For a city with |V| POIs, we consider a complete non-oriented graph G = (V, E), with V = {v1, . . . , v|V|} being
the set of vertices representing the POIs and E = {(vi, vj) |
vi, vj ∈ V} is the set of edges connecting the nodes. Each
edge (vi, vj) ∈ E is associated with a cost ci,j representing
the travel time between vertex vi to vertex vj, employing
a given mode of transportation. Each POI vi ∈ V is
char-acterized by the following attributes. The popularity of the POI, denoted by P op(vi) ∈ Z. The expected time one should
spend in the POI to enjoy what it has to offer (i.e., expected POI visiting time), denoted by Dur(vi) ∈ R. The category
representing its nature (e.g., Shopping, Entertainment, His-torical, Museum, Sport, Park), denoted by Cat(vi). Finally,
the location expressed in terms of latitude and longitude, denoted by Lat(vi) and Long(vi) respectively. We denote
by C = {1, . . . , C} the set of all POI categories, so that Cat(vi) ∈ C.
3.1.2 Service Applications and ICT Infrastructure
The MTC offers a set A = {1, . . . , A} of service applications to enrich the touristic experience in every POI. Each service a ∈ A has particular requirements in terms of network and computing resources, expressed as:
• λmina and λmaxa : the minimum and maximum network
demand (i.e., demanded traffic volume) in bps, respec-tively;
• ψaminand ψmaxa : the minimum and maximum
comput-ing demand (i.e., demanded processcomput-ing load) measured in reference core (RC)1, respectively.
In each POI, the network resources are provided through a set of wireless access points or a base station. In order to keep the model generic, we decide to represent network resources simply by the capacity, i.e., not taking into account the wireless channel aspects. In fact, the whole model com-plexity and the time scale of the problem also suggest that this is a reasonable approach. We denote by λvi the total
network resource available at POI vi ∈ V. On the other
hand, computing resources are provided by MEC hosts which are reachable from the access network, as shown in Figure 1. We assume that a POI can be served by any MEC host. Let M = {1, . . . , M } denote the set of MEC hosts, we represent by ψmthe total computing capacity available at
MEC host m ∈ M.
Whenever possible, service applications should run on the MEC hosts since this results in shorter response times and improved touristic experience. When no resource is available at the edge, services run at the remote cloud with degraded performance, in terms of communication delay. 3.1.3 Tourists
We consider a set U = {1, . . . , U } of tourists, where each tourist u ∈ U is described by the following attributes. The tourist interest in each POI category c ∈ C, denoted by Intu(c) ∈ R. The preferred day and starting and ending
locations for the tour, denoted respectively by Du, vsu, and
vu
f, with vus, vfu∈ V. Finally, the time budget (i.e., maximum
available time for visits) to complete the tour, represented by Bu ∈ R. The tourist is also characterized by the set
Au ∈ 2A, representing the applications she is willing to
use during the tour, where 2A is the power set of A. The 1. unit of measure that represents the processing capacity of a refer-ence CPU core.
set Audetermines the minimum and maximum demand in
terms of network and computing resources required to run the tourist applications during the tour. We represent this demand as:
• λminu = P a∈Au
λmin
a : the minimum network demand, in
bps, required by tourist u during a tour;
• λmaxu =
P
a∈Au
λmaxa : the maximum network demand, in
bps, required by tourist u during a tour;
• ψumin= P a∈Au
ψmin
a : the minimum computing demand,
in reference core (RC), required by tourist u during a tour; • ψmax u = P a∈Au ψmax
a : the maximum computing demand,
in reference core (RC), required by tourist u during a tour.
Next, we describe how we define visiting-related infor-mation such as the popularity of the POI (P op(vi)), expected
POI visiting time (Dur(vi)), and the interest of a tourist in a
certain category (Intu(c)).
3.2 Visiting-related information
Similar to other works [6], [10], [11], in this paper, we define P op(vi), Dur(vi), and Intu(c) based on users’ past travel
histories extracted from location-based social media such as Facebook, Flickr, and Foursquare. Given a tourist u ∈ U who has visited n POIs in a city, we define her travel history as an ordered sequence Su = ((v1, tav1, t d v1), . . . , (vn, t a vn, t d vn)),
where each triple (vi, tavi, t d
vi) represents a visit at POI vi, the
arrival time ta
vi at POI vi and the departure time t d vi from
POI vi. The user’s visit duration at POI vican be computed
as the difference between tdviand t a vi.
A travel history Sucan be further divided into multiple
travel sub-sequences. We divide a travel history into distinct travel sub-sequences if visits to consecutive POIs occur more than tsplit time units apart, i.e., if tavi+1− t
d
vi > tsplit. We
denote by Su1, Su2, . . . , Sku, a travel history Suwith k travel
sub-sequences.
The popularity of a POI vi ∈ V, P op(vi), is defined
based on the number of times vihas been visited. Formally,
given the set S of all travel histories, i.e., S =S
u∈USu, the
popularity of a POI viis defined as:
P op(vi) = X Su∈S X vx∈Su δ(vx, vi), ∀vi∈ V, (1) where δ(vx, vi) = ( 1, if vx= vi 0, otherwise
Similarly, the expected visiting time of a POI vi ∈ V,
Dur(vi), is defined as follows:
Dur(vi) = P Su∈S P vx∈Su (td vx− tavx)δ(vx, vi) P op(vi) , ∀vi∈ V. (2)
While the popularity of a POI is the same for all tourists, the tourist interest in a certain POI depends on the category of the POI and it is different for different tourists. The
interest level of a tourist u ∈ U in a category c ∈ C, is defined as: Intu(c) = X vx∈Su (tdvx− ta vx) Dur(vx) γ(c, Cat(vx)), (3) where γ(c, Cat(vx)) = ( 1, if c = Cat(vx) 0, otherwise
Intu(c) is based on the time tourist u spent at a POI
of category c relative to the expected visiting time at that POI. The intuition here is to determine the interest level of the tourist in a certain category by computing the time she spent at POIs of that category compared to other tourists.
TABLE 1
Notations and definitions used in the problem formulation.
Symbol Description
V set of POIs (in a city)
E set of edges connecting vertices (i.e.,
POIs)
C set of all POI categories
U set of tourists
M set of MEC hosts
A set of applications offered by the MTC
vi a POI inV
ci,j travel time between POIvito POIvj P op(vi) popularity of POIvi
Dur(vi) expected visiting time of POIvi Cat(vi) category of POIvi
Lat(vi) latitude of POIvi Long(vi) longitude of POIvi
λvi total network resource available at POIvi ψm total computing resource available at
MECm λmin
a
minimum network demand, in bps, of applicationa ∈ A
λmax a
maximum network demand, in bps, of applicationa ∈ A
ψmin a
minimum computing demand, in refer-ence cores, of applicationa ∈ A
ψmax a
maximum computing demand, in refer-ence cores, of applicationa ∈ A
u a tourist inU
Bu time budget of touristuto complete the
tour
Au set of applications touristuse uis willing to Intu(c) interest of touristuin the POI categoryc Du date when the tour of touristuwill take
place
vu
s place where the itinerary needs to begin vu
f place where the itinerary needs to finish λmin
u minimum network demand required bytouristuduring a tour λmax
u maximum network demand required bytouristuduring a tour ψmin
u minimum computing demand requiredby touristuduring a tour ψmax
u maximum computing demand requiredby touristuduring a tour S set of all travel histories
Su travel history of touristu
Suk the k-th travel sequence of touristu tsplit threshold to split a travel history into
travel sequences
UD set of tourists whose tours are scheduled
to dayD
τ index of the time slot in which MEC
in-frastructure resources are allocated
4
P
ROBLEM FORMULATIONIn this section, we define the problem of recommending per-sonalized tour itineraries in the context of next-generation touristic services. We call it Multi-access Edge Comput-ing Aware Personalized Tour Recommendation (MEC-PTR) problem. Hereafter, we first revisit an existing formulation of the traditional Personalized Tour Recommendation (Per-sTour) problem, consistent with the one introduced in [6]. The PersTour problem finds a single optimal itinerary for a tourist given her preferences and constraints. Since only one itinerary is considered in the solution of the PersTour problem, there is no opportunity for optimizing the MEC resource allocation and to improve the virtual touristic experience. In addition, PersTour recommends personalized tour itineraries for an individual tourist. However, since the MEC resources are shared among the tourists during their tours, the recommendation problem must take into account a multi-user (tourist) perspective. Thus, we propose a new formulation, the MEC-PTR problem, to capture the joint problem of recommending personalized tour itineraries for multiple individual tourists while efficiently allocating MEC resources to enable advanced touristic service applications.
4.1 PersTour problem
The problem of recommending a personalized tour itinerary for a tourist interested in visiting multiple POIs (in a one-day trip), denoted PersTour, is a route-planning problem. Specifically, in this problem we are given a complete non-oriented graph G = (V, E) where nodes represent the POIs of the city and edges are the links connecting the nodes. As described in Section 3, each POI vi ∈ V is characterized by
a vector (Cat(vi), P op(vi), Dur(vi)). Each edge (vi, vj) ∈ E
is associated with a cost ci,j representing the travel time
between POI vi to POI vj. Similarly, a tourist u ∈ U is
characterized by a vector ((Intu(c)∀c ∈ C), vus, v u f, Bu).
The vast majority of the literature related to the PersTour problem defines it in the context of the OP and its integer programming problem formulation [6], [8], [9]. Formally, let Iu= (v1, . . . , vN), with vi∈ V, i = 1, . . . , N , be an itinerary
for tourist u ∈ U , i.e., a sequence of POI visits starting at v1 = vus and ending at vN = vfu. Each POI vi ∈ Iu has
a profit αIntu(Cat(vi)) + (1 − α)P op(vi) as perceived by
tourist u. This profit depends on the value of α ∈ [0, 1], which can be chosen to give more emphasis either on the tourist interest or on the POI popularity. Thus, for each itinerary Iu, a score (profit) can be given by:
P rof (Iu) = N −1 X i=2 N X j=2
xi,j(αIntu(Cat(vi))+(1−α)P op(vi)),
(4) where xi,j = 1 if POIs vi and vj are visited in
se-quence, and xi,j = 0 otherwise. On the other hand, let
Dur(vj)Intu(Cat(vj)) be the personalized recommended
time for tourist u to spend at POI vj. This time is based
on the tourist interest level in category Cat(vj) and the
expected visiting time at POI vj. Since traveling from POI vi
to POI vj and visiting vj consumes the tourist budget, the
following cost function can be defined:
The objective of the PersTour problem under the OP is to find an itinerary Iuthat:
maximize (P rof (Iu)) (6) subject to: N −1 X i=1 N X j=2
Costu(i, j)xi,j≤ Bu (7) N X j=2 x1,j = N −1 X i=1 xi,N = 1 (8) N −1 X i=1 xi,k= N X j=2 xk,j≤ 1, ∀k = 2, ..., N − 1 (9) 2 ≤ vi≤ N, ∀i = 2, ..., N (10) vi− vj+ 1 ≤ (N − 1)(1 − xi,j), ∀i, j = 2, ..., N. (11) Equation (6) aims to maximize the total collected profit of tourist u without exceeding her budget (constraint rep-resented by Equation (7)). The other constraints ensure the proper construction of the itinerary: Equation (8) ensures that the path starts at POI v1= vus and ends at POI vN = vfu;
Equation (9) ensures that the path is connected and no POI is visited more than once; Equations (10) and (11) ensure that there are no subtours.
4.2 MEC-PTR problem
The MEC-PTR problem adds the MEC resource availability and the demand of the service applications chosen by the tourists (defined in Section 3) to the PersTour problem. In addition, different from PersTour, the MEC-PTR problem seeks to recommend personalized tour itineraries for mul-tiple individual tourists whose trips are scheduled for the same day. Specifically, let UD ⊆ U be the set of tourists
whose tours are scheduled for day D, i.e., UD = {u ∈ U |
Du = D}. Let Iu= (v1, . . . , vN), with vi ∈ V, i = 1, . . . , N
and v1 = vus and vN = vuf, be an itinerary for tourist
u ∈ UD. Let Equations (4) and (5) represent the profit
associated with Iu and the cost function associated with
u, respectively. The objective of the MEC-PTR problem is to find one itinerary for every tourist u ∈ UD, in which
the set of chosen itineraries, denoted by I∗, satisfies the
requirements R1 – R4.
As mentioned before, the output of the PersTour prob-lem is only one optimal itinerary for a tourist u ∈ U . This is so because the OP is a single-criterion variant of the Travel-ing Salesman Problem with Profits (TSPP or TSPwP) [8], [9]. However, the TSPP/TSPwP is a bi-criteria generalization of the TSP with two conflicting objectives: maximizing the total collected profit and minimizing the travel cost. Thus, by modeling the PersTour problem as a TSPwP, one can obtain the set Iu∗ = {Iu∗1 , . . . , Iu∗k } of non-dominated itinerary
solutions (i.e., Pareto front) for a tourist u ∈ U . Using this idea, we define the MEC-PTR as a two-stage optimization problem. The first stage finds the set Iu∗ for a user u ∈ UD
and is defined as:
Stage 1 (MEC-PTR): maximize (P rof (Iu)) (12) minimize N −1 X i=1 N X j=2
Costu(i, j)xi,j
(13)
subject to:
Equations (7) − (11).
Since the TSPwP belongs to the class of NP-hard prob-lems [22], we present in Section 5 an efficient algorithm to generate the Pareto front (Iu∗) using a dynamic
program-ming approach. Let denote by I =S
u∈UDIu∗the set found
by solving stage 1 of the MEC-PTR problem for all tourist u ∈ UD. We call I the set of candidate itineraries. Note that
because of the constraint represented by Equation (7), all itineraries in I satisfy the budget constraint of the asso-ciated tourist. Since each itinerary Iu∗j ∈ Iu∗ has a profit
P rof (Iu∗j ), we can formulate the second stage of
MEC-PTR as a Mixed Integer Linear Programming (MILP) problem, as described below.
Assume that the indicator function φ(Iu∗j , vi) ∈ {0, 1}
represents POI visiting in an itinerary, with φ(Iu∗j , vi) = 1
if itinerary Iu∗j visits POI vi and φ(Iu∗j , vi) = 0 otherwise.
We assume that every itinerary in I starts and ends withing a period of time T , and that MEC infrastructure resources (computing and network) for these itineraries are allocated in discrete time slots of size ∆t. The time slots are indexed by τ ∈ Z such that 1 ≤ τ ≤ T .
Given an itinerary Iu∗j ∈ I, a POI vi ∈ V, and a time
in-dex τ , we define the indicator function ρ(Iu∗j , vi, τ ) ∈ {0, 1},
with ρ(Iu∗j , vi, τ ) = 1 if itinerary Iu∗j is visiting POI vi
during τ , and ρ(Iu∗j , vi, τ ) = 0 otherwise. This information
can be derived since we know the start time, sequence of visits, and visit duration for each itinerary Iu∗j ∈ Iu∗
obtained from the first stage.
Let the set of decision variables y(Iu∗j ) ∈ {0, 1}
rep-resent itinerary choices, so that y(Iu∗j ) = 1, if itinerary
Iu∗j ∈ I composes the solution; and y(Iu∗j ) = 0 otherwise.
For each POI visit, a MEC host has to provide computing resources for the tourist. We define the decision variable z(Iu∗j , vi, m) ∈ {0, 1} to represent MEC host association, so
that z(Iu∗j , vi, m) = 1, if MEC host m ∈ M is responsible to
provide computing resources during a visit to POI vi∈ V in
itinerary Iu∗j ∈ I; and z(I j
u∗, vi, m) = 0 otherwise.
Let the decision variables p(Iu∗j , vi) ∈ R and q(Iu∗j , vi, m) ∈ R represent, respectively, the amount of
network and the amount of computing resources (at MEC host m ∈ M) allocated during a visit to POI vi ∈ V in
itinerary Iu∗j ∈ I. Assuming N orm(value) as a generic
function that normalizes a value, we define the second stage of the MEC-PTR problem as:
Stage 2 (MEC-PTR):
maximize X
Iu∗∈Ij
y(Iu∗j )N orm(P rof (Iu∗j )) +
X Iu∗∈Ij X vi∈V N orm(p(Iu∗j , vi)) 2|Iu∗j | + X Iu∗j ∈I X vi∈V X m∈M N orm(q(Iu∗j , vi, m)) 2|Iu∗j | (14) subject to: X Iu∗∈Iu∗j
y(Iu∗j )= 1, ∀Iu∗∈ I (15)
X
m∈M
z(Iu∗j , vi, m)= y(Iu∗j )φ(I j
u∗, vi), (16)
∀Ij
u∗∈ I, ∀vi∈ V
p(Iu∗j , vi)≥ λminu y(I j u∗)φ(I
j
u∗, vi) (17)
p(Iu∗j , vi)≤ λmaxu y(I j u∗)φ(I
j
u∗, vi), (18)
∀Iu∗j ∈ I, ∀vi∈ V
q(Iu∗j , vi, m)≥ ψminu z(I j
u∗, vi, m)φ(Iu∗j , vi) (19)
q(Iu∗j , vi, m)≤ ψmaxu z(I j
u∗, vi, m)φ(Iu∗j , vi), (20)
∀Iu∗j ∈ I, ∀vi∈ V, ∀m ∈ M
X
Iu∗∈Ij
ρ(Iu∗j , vi, τ )p(Iu∗j , vi)≤ λvi, (21)
∀vi∈ V, 1 ≤ τ ≤ T
X
Iu∗j ∈I
X
vi∈V
ρ(Iu∗j , vi, τ )q(Iu∗j , vi, m)≤ ψm, (22)
∀m ∈ M, 1 ≤ τ ≤ T
Equation (14) aims to maximize simultaneously three ob-jectives: (i) the aggregated total collected profit of all tourists in UDgiven that each tourist u ∈ UDmust have only a single
itinerary Iu∗j ∈ Iu∗; (ii) the average amount of allocated
network resources; and (iii) the average amount of allocated computing resources at the edge. Together, these objectives ensure requirement R4. The N orm(value) function assures that all objectives stay in the same interval of values. The aggregated profit of the itineraries and the overall average resource allocation have equal weights. Thus, Equation (14) may choose itineraries that do not have the highest individ-ual profit, but provides the best balance with the resource allocation and, as a consequence, an improved experience to the set of tourists as a whole.
Although the constraint represented by Equation (7) ensures that every itinerary Iu∗j ∈ Iu∗ satisfies the time
constraint of tourist u, in order to meet requirement R1, we still have to ensure, for each tourist u ∈ UD, that exactly one
itinerary Iu∗j ∈ Iu∗ is chosen. This is accomplished by the
constraint represented by Equation (15).
If an itinerary Iu∗j is chosen to compose a solution, we
also need to associate one MEC host with each POI visit along this itinerary to provide computing resources. We achieve this with the constraint represented by Equation (16).
For each tourist u ∈ UDand chosen itinerary Iu∗j , we also
need to select at least the minimum amount of resources required for the set Au ∈ 2A of chosen applications, so
that the applications can execute properly. We have to take care of not allocating more than it is needed (requirement
R2). We ensure proper allocation of network resources with Equations (17) and (18). Similarly, Equations (19) and (20) ensure proper allocation of computing resources.
Finally, we have to make sure that the performed allo-cations do not exceed the amount of available network and computing resources, at any given time slot (requirement
R3). This is achieved with the constraints represented by Equations (21) and (22), respectively.
5
A
N EFFICIENT ALGORITHM FORMEC-PTR
5.1 Description of the algorithm
To solve the MEC-PTR problem, we propose the Multi-access Edge Computing Aware Personalized Itinerary Rec-ommendation (MEC-PIR) algorithm described in Algo-rithm 1. As illustrated in the latter, in the initialization step (line 1) the set I of candidate itineraries is set to empty. Then, for each tourist u ∈ UD, we solve the first stage of
the MEC-PTR problem by calling Algorithm 2 (line 3). The output of Algorithm 2 is the Pareto front Iu∗ for tourist
u, i.e., the set of optimal solutions for the multi-objective optimization problem. This set is then added to the set of candidate itineraries (line 4). After the Pareto front has been computed for all tourist u ∈ UD, we use the set I of
candidate itineraries as input to solve the second stage of the MEC-PTR problem (line 5). The result of the second stage is the set I∗of itineraries satisfying requirements R1 – R4 (line
6).
As described in Section 4.2, the first stage of the MEC-PTR problem is based on the TSPwP, which belongs to the class of NP-hard problems. To solve this part of the problem optimally and efficiently, MEC-PIR uses a variant of the shortest path problem with resource constraints (SP-PRC) [23], summarized in Algorithm 2. To solve the second stage of the MEC-PTR problem, MEC-PIR uses a traditional optimization tool (i.e., solver). In the following, we describe in more detail how we use the variant of the SPPRC to solve the first stage of the MEC-PTR problem.
Algorithm 1:The MEC-PIR Algorithm
Input : UD; G = (V, E); α;
(P op(vi), Dur(vi), Cat(vi)) ∀vi∈ V;
((Intu(c) ∀c ∈ C), vus, vfu, Bu) ∀u ∈ UD
Output: I∗satisfying R1-R4
1 I ← ∅
2 forall u ∈ UDdo
// Stage 1
3 Iu∗← Algorithm 2 (G = (V, E); α;
(P op(vi), Dur(vi), Cat(vi)) ∀vi∈ V;
((Intu(c) ∀c ∈ C), vus, vfu, Bu))
4 I ← I ∪ Iu∗
// Stage 2
5 Find I∗by solving Stage 2 (MEC-PTR) using I as input
5.2 Solution for the first stage
The SPPRC finds a shortest path among all paths that start from a source node, end at a destination node, and satisfy a set of constraints defined over a set of resources. A resource, in this context, corresponds to a quantity, for example, time or money, which varies along a path according to resource extension functions. A resource extension function is defined for every edge in the graph and every resource involved in the problem. Each function provides a lower bound on its corresponding resource related to the next vertex, given the value accumulated in the present vertex. The resource constraints are given as intervals, also known as resource windows, which limit the values that can be taken by the resources at every vertex along a path. These constraints are defined for every vertex and every consid-ered resource. Thus, if multiple resources are involved in the problem, the SPPRC becomes very close to a multi-criteria problem, since the paths may not be comparable for different resources. In this context, by solving the SPPRC, we obtain a set of optimal solutions, i.e., a Pareto front.
Indeed, due to the constraint represented by Equa-tion (9), to solve the first stage of the PTR, MEC-PIR employs the Elementary SPPRC (ESPPRC), a variant of the SPPRC algorithm that finds only elementary paths, i.e., paths in which no vertex is visited more than once. Additionally, we use two types of resource: a constrained resource (i.e., time) and an unconstrained one (i.e., score or profit). In the following, we describe how we map the first stage of MEC-PTR into the ESPPRC framework. We use a dynamic programming methodology.
ESPPRC procedure. For a given itinerary or path P =
(v0, v1, ..., vp−1, vp), let Res(P ) = vp be the resident vertex
of P (i.e., the last vertex of P ) and (v0, v1, ..., vp−1) be an
example of prefix path of P . For the sake of efficiency, itinerary (or paths) in dynamic programming algorithms are represented through labels. Thus, associated with ev-ery itinerary P there is a label R. A label stores multiple information, for example, its resident vertex, its predecessor edge, its predecessor label, and its current vector of resource values. For the first stage of MEC-PTR, two resources are critical to be stored in the labels:
• Spent(R) ∈ R: constrained resource that represents the
amount of time spent along the itinerary P . Time is consumed whenever the tourist visits a POI or move from one POI to another. As described in Section 4.2, for every tourist u ∈ UD, the time consumed moving
from POI i to POI j and visiting j is represented by Costu(i, j) .
• P rof it(R) ∈ R: unconstrained resource that represents
the profit (or score) of the itinerary P . As described in Section 4.2, for every tourist u ∈ UD, each POI vi ∈ P
has a profit equals to αIntu(Cat(vi)) + (1 − α)P op(vi)
.
In Algorithm 2, we call a function getLabel to obtain a label from a path, and a function getPath to obtain a path from a label. Algorithm 2 operates over two main sets: P, the set of useful paths, and Q, the set of unprocessed paths, i.e., paths that have not yet been extended. The useful paths P ∈ P have already been processed and they are Pareto-optimal paths or prefixes of Pareto-Pareto-optimal paths. The set P
is initially empty (line 1), while the set Q is initiated with the trivial path (vus) (line 2). In summary, the main loop
(line 3) consists of: 1) selecting and removing a path Q ∈ Q (line 4), 2) making all feasible extensions from Q (lines 5-10), 3) adding Q to P (line 11), and 4) identifying and removing dominated paths from P ∪ Q (lines 12-17). In the end, the algorithm obtains the set of non-dominated paths (or itineraries) that end in vertex vuf (line 18), discarding
eventual prefixes contained in P .
Algorithm 2: Dynamic programming ESPPRC –
Stage 1 (MEC-PTR)
Input : G = (V, E); α;
(P op(vi), Dur(vi), Cat(vi)) ∀vi∈ V;
((Intu(c) ∀c ∈ C), vus, vfu, Bu)
Output:set Iu∗= {Iu∗1 , . . . , Iu∗k } of non-dominated
itinerary (or path) solutions for a tourist u ∈ UD
1 P ← ∅ 2 Q ← {(vsu)}
3 while Q 6= ∅ do
4 Choose a path Q ∈ Q and remove Q from Q 5 forall vj∈ V | (vj6= Res(Q) and vj∈ Q) do/
6 R ←getLabel(Q)
7 f easible, R0← Algorithm 3
(R, vj, α, P op(vj), Dur(vj), Intu(Cat(vj)), Bu)
8 if f easible = true then
9 Q0← getPath(R0) 10 Add the path Q0to Q 11 Add the path Q to P
12 forall pair of paths (P1, P2) ∈ P ∪ Qand
(Res(P1) = Res(P2)) do
13 R1← getLabel(P1)
14 R2← getLabel(P2)
15 dominates ←Algorithm 4(R1, R2)
16 if dominates = true then
17 Remove the path P2
18 Filter P such that Res(P ) = vuf ∀P ∈ P
19 return P
Let Ξ be the set of all solutions of the ESPPRC, where each element X ∈ Ξ is a set of Pareto-optimal paths, such that:
∃X ∈ Ξ | X ⊆ {(Q, P ) | Q ∈ Q, P ∈ Z(Q)} ∪ P, (23) where Z(Q) = {P | (Q, P ) ∈ F (vi, vj)) ∩ G} represents
the set of all feasible extensions. The set F (vi, vj) has all
resource-feasible paths from vertex vito vertex vj.
The condition described by Equation (23) is held for the initialization of Algorithm 2 (lines 1-2), since vi = vsu and
vj = Res(P ) = ∅. For every vertex vj ∈ V (line 5), the
con-dition described by Equation (23) is verified (line 8) before adding the extended path Q0to Q (line 10). This depends on Algorithm 3 (called in line 7) described latter in this section. In addition, to be efficient, Algorithm 2 must avoid making extensions over dominated prefix paths, i.e., paths that are not part of the Pareto front. Thus, after processing every path Q ∈ Q (lines 4-11), the algorithm takes every pair of paths (P1, P2) ∈ P ∪ Q where Res(P1) = Res(P2) (line
removes the path P2 (line 17). This procedure depends on
Algorithm 4 (called in line 15) described latter in this section.
Extension procedure.The goal of Algorithm 3 is to verify if
path P (described by label R) can be extended to vertex vj.
After identifying the path P associated with label R (line 1) and the resident vertex vi = Res(P ) of this path (line
2), the algorithm includes into label R0(associated with the extended path P0) the information about the time consumed for travelling from vi to vj and for visiting the vertex (or
POI) vj (lines 3-4). The algorithm also includes into label
R0 the information about the profit of the path P0 (line 5). Finally, the algorithm verifies if the constrained resource Spend(R0) is inside its resource window (line 6), which can be seen as the interval [0, Bu− Costu(i, j)]. The algorithm
returns true, if the extension is feasible (line 7), or false (line 9), otherwise.
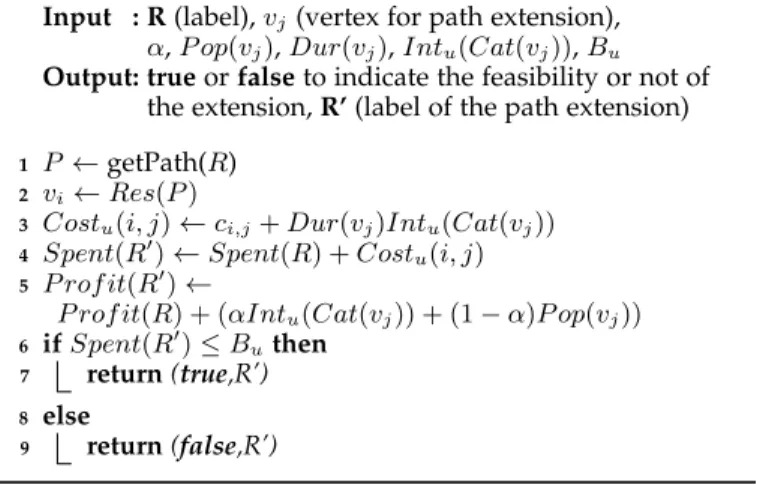
Algorithm 3:Extension
Input : R(label), vj(vertex for path extension),
α, P op(vj), Dur(vj), Intu(Cat(vj)), Bu
Output: trueor false to indicate the feasibility or not of the extension, R’ (label of the path extension)
1 P ←getPath(R) 2 vi← Res(P )
3 Costu(i, j) ← ci,j+ Dur(vj)Intu(Cat(vj))
4 Spent(R0) ← Spent(R) + Costu(i, j)
5 P rof it(R0) ←
P rof it(R) + (αIntu(Cat(vj)) + (1 − α)P op(vj))
6 if Spent(R0) ≤ Buthen
7 return (true,R’)
8 else
9 return (false,R’)
Dominance procedure. In general terms, dominance rules
identify non-useful paths by comparing the resource vector T (Q) and the set of all feasible extensions Z(Q) with the corresponding T (P ) and Z(P ), such that Res(P ) = Res(Q). In the context of the first stage of MEC-PTR, as described by Algorithm 4, this comparison consists in verifying if label R1(corresponding to path P1) provides a
higher or equal profit and consumes less or equal time than label R2(that corresponds to path P2) (line 1). The algorithm
returns true, if the condition is satisfied (line 2), or false (line 4), otherwise. When the condition is true, it means that path P2(represented by label R2) must be removed, since it was
identified as equal or worse than P1 (represented by label
R1).
Algorithm 4:Dominance
Input : R1(label), R2(label)
Output: trueif R1dominates R2, false otherwise
1 if (P rof it(R1) ≥ P rof it(R2)) and
(Spent(R1) ≤ Spent(R2)) then
2 return true
3 else
4 return false
6
E
XPERIMENTAL EVALUATIONThis section evaluates the performance of MEC-PIR using real-world travel histories. In the following, we first de-scribe how we obtain these travel histories and then present an analysis of the visiting-related statistics found in our dataset (Section 6.1). Later, we outline the baseline algorithm (Section 6.2) used for comparison. Finally, we detail the experimental methodology (Section 6.3) and discuss the obtained results (Section 6.4).
6.1 Mining tourist travel histories from real data
In order to achieve a realistic evaluation, we use real data to derive POI information, tourist travel histories, and visiting-related statistics. More specifically, we use the Google Places API2 to obtain a list of POIs from four cities in Europe, namely: London, Madrid, Barcelona, and Athens (one list per city). These cities are important from a touristic point of view and guarantee variety and diversity in our evaluation. For each city, we select the first 30 POIs with the highest rat-ing, i.e., we use |V| = 30. In each list, each POI is identified by an id, name, latitude and longitude (Lat(vi), Long(vi)),
and the category (Cat(vi)) it belongs to. The cost ci,j of
an edge connecting two POIs vi and vj in the same list
is computed using the Google Matrix Distance API3 in the
walking mode.
Following the approach proposed in [6], [10], [11], we use the Flickr API4to extract geotagged photos and derive
user travel histories. We collect photos taken from 01-01-2017 to 12-31-2018 for the four considered cities. Each photo is tagged with the tourist (user) id of the photo owner, timestamp, and latitude/longitude geo-coordinates.
For each city, we combine its photo dataset with its POI list to generate the set S of travel histories in the city. First, we match each photo to the corresponding POI using the geo-coordinates of the photo and of the POIs. A photo is mapped to a POI if their geo-coordinates differ by less than 100 meters according to the Haversine formula. If this condition holds for more than one POI, the photo is associated with the nearest POI, so that each photo is mapped to a single POI. Then, for each user, we construct the travel history Su sorting the photos by user id and
timestamp. After that, for each user, we group consecutive POI visits as an individual travel sequence if the consecutive POI visits differ by at most 8 hours, i.e, we use tsplit = 8.
For each travel sequence Suk⊆ Suand for each POI vi∈ Suk,
we take the time of the first and the last photo taken by user u at vi as the arrival (tavi) and departure (tdvi) time in that
POI, respectively. Finally, we discard travel sequences with cycles (repeated POI visits) or with less than 3 POI visits.
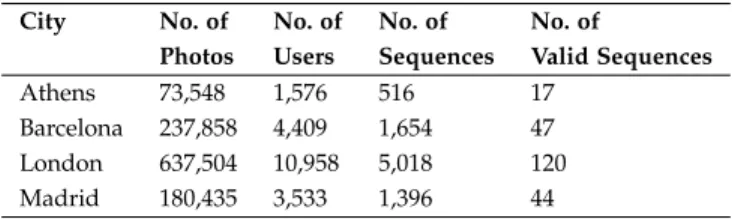
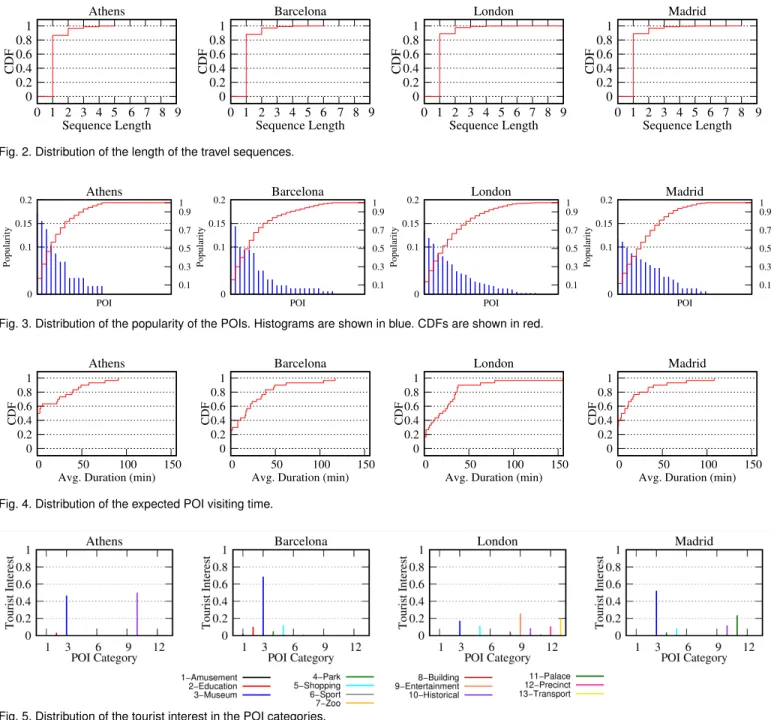
Table 2 summarizes the number of photos, number of users, number of travel sequences, and number of travel sequences with at least 3 POI visits (valid sequences) found in our dataset. Indeed, we do not observe travel sequences with cycles. However, the number of sequences with 3 or more POIs is small. Fig. 2 shows the cumulative distribution function (CDF) of the length of the travel sequences found
2. https://developers.google.com/places/web-service/intro 3. https://developers.google.com/maps/documentation/ distance-matrix/start
in our dataset for each city. Sequences with 3 or more POIs represent less than 5% of the sequences found in each city. The longest sequence in Athens has 5 POIs, while in Barcelona, London, and Madrid the longest sequence has 6, 9, and 8 POIs, respectively.
TABLE 2 Dataset summary.
City No. of No. of No. of No. of
Photos Users Sequences Valid Sequences
Athens 73,548 1,576 516 17
Barcelona 237,858 4,409 1,654 47
London 637,504 10,958 5,018 120
Madrid 180,435 3,533 1,396 44
Based on the obtained set of travel histories (S) of each city, we can compute the visiting-related statistics: popularity of the POI (P op(vi)), expected POI visiting
time (Dur(vi)), and tourist’s interests in a given category
(Intu(c)) using the Equations (1), (2) and (3), respectively.
In the following, we present an analysis of the visiting-related statistics found in our database. These statistics were computed after removing all sequences with less than 3 POIs.
Fig. 3 shows the distribution of the popularity of the POIs per city. Recall that the popularity of a POI vi ∈ V
is calculated using Equation (1). In each graphic of the figure, we present the histogram (y-axis on the left) and the CDF (y-axis on the right) of the popularity of the POIs. The x-axis presents the POIs. For comparison purpose, in each city, the popularity is displayed as a percentage of the total number of visits (i.e., relative values). The top 10 POIs (in terms of popularity) represents 89%, 83%, 79% and 80% of all POI visits in Athens, Barcelona, London, and Madrid, respectively. Indeed, in Athens, all the visits are concentrated in only 15 POIs (i.e., 50% of the POIs). The number of POIs with no visits in Barcelona, London, and Madrid are 7, 5, and 10, respectively.
Fig. 4 shows the CDF of the expected POI visiting time (in minutes) per city. Recall that the expected visiting time at a POI vi ∈ V is computed using Equation (2). In all cities,
the expected POI visiting time is short, for example, 50% lasts less than 20 minutes and 90% lasts less than 1 hour. Athens presented the distribution with the shortest expected POI visiting time, in which 60% lasts less than 4 minutes. The longest expected POI visiting time found in Athens, Barcelona, London, and Madrid are 91, 117, 155, and 108 minutes, respectively.
Finally, we analyze the distribution of the interest in the categories of the POIs. Recall that the interest of a tourist u ∈ U in a category c ∈ C is calculated using Equation (3). Fig. 5 presents the tourist’s interest per POI category in our database for each city. In total, there are 13 POI categories. For comparison purposes, the interest is displayed as a percentage of the sum of the interests. In Athens and Barcelona, tourist’s interest is concentrated in a few categories. For example, in Athens, all the interest is related to Education, Museum, and Historical. On the other hand, tourist’s interest in London and Madrid is more diffused among the categories. For example, in London, no
category receives more than 25.5% of the interest.
In the next sections, we use the obtained travel histories and the visiting-related statistics obtained from our dataset as inputs to MEC-PIR. We also use these travel histories as ground truth for the subsequent evaluation.
6.2 Baseline algorithm
We compare MEC-PIR against PersTour [6], a state-of-the-art algorithm for recommending personalized itinerary for an individual tourist based on POI popularity and tourist interest preferences. PersTour solves the PersTour problem using an Integer Programming Model. However, it does not take into account MEC resources and service application demands while generating the itinerary. Thus, in order to use PersTour to solve the MEC-PTR problem, we adapt the algorithm as follows:
• Since PersTour is designed for a single tourist, in order to produce itineraries for every tourist u ∈ UD, we
run |UD| independent instances of PersTour, i.e., one
instance per tourist.
• We use the single itinerary per tourist that is generated
by PersTour as input to our implementation of the second stage of MEC-PTR. Since PersTour is unaware of the limited resources, this approach may lead to infeasible solutions. When this happens, we solve the problem by relaxing the constraints dealing with mini-mum allocation for service applications. Thus, in terms of user experience, the effective performance of PersTour is even worse than will be shown in the following section. We call this modified version of PersTour as Resource-aware PersTour (RA-PersTour).
6.3 Evaluation methodology
In our evaluation, we consider that two service applica-tions are available for tourists: augmented reality and video streaming (i.e., A = {augmented reality, video streaming}). The requirements of an augmented reality MEC service were taken from [24], while the requirements of a video streaming application were based in the Netflix stream service website5. Table 3 shows the network and processing
requirements for both service applications. TABLE 3
Requirements of the service applications.
Application λmin
a λmaxa ψmina ψamax
Augmented reality 1 Mbps 10 Mbps 0.1 RC 1 RC Video streaming 1.5 Mbps 25 Mbps 0 (None) 0 (None)
Based on [25], we assume the amount of connectivity resources available at each POI is λvi = 75 Mbps. As for
computing resources, we consider two MEC hosts (|M| = 2), each one with 37.5 Reference Cores (RCs), i.e., ψm= 37.5
RC. Based on [24], we assume that one RC is equivalent to the processing power of an Intel Haswell i7-4770 3.40GHz.
For each city, we use the valid travel sequences found in our dataset and the tourist interests derived from them as tourist profiles. Based on theses profiles, we generate a set
0 0.2 0.4 0.6 0.8 1 0 1 2 3 4 5 6 7 8 9 CDF Sequence Length Athens 0 0.2 0.4 0.6 0.8 1 0 1 2 3 4 5 6 7 8 9 CDF Sequence Length Barcelona 0 0.2 0.4 0.6 0.8 1 0 1 2 3 4 5 6 7 8 9 CDF Sequence Length London 0 0.2 0.4 0.6 0.8 1 0 1 2 3 4 5 6 7 8 9 CDF Sequence Length Madrid
Fig. 2. Distribution of the length of the travel sequences.
0 0.1 0.15 0.2 0.1 0.3 0.5 0.7 0.9 1 Popularity POI Athens 0 0.1 0.15 0.2 0.1 0.3 0.5 0.7 0.9 1 Popularity POI Barcelona 0 0.1 0.15 0.2 0.1 0.3 0.5 0.7 0.9 1 Popularity POI London 0 0.1 0.15 0.2 0.1 0.3 0.5 0.7 0.9 1 Popularity POI Madrid
Fig. 3. Distribution of the popularity of the POIs. Histograms are shown in blue. CDFs are shown in red.
0 0.2 0.4 0.6 0.8 1 0 50 100 150 CDF
Avg. Duration (min)
Athens 0 0.2 0.4 0.6 0.8 1 0 50 100 150 CDF
Avg. Duration (min)
Barcelona 0 0.2 0.4 0.6 0.8 1 0 50 100 150 CDF
Avg. Duration (min)
London 0 0.2 0.4 0.6 0.8 1 0 50 100 150 CDF
Avg. Duration (min)
Madrid
Fig. 4. Distribution of the expected POI visiting time.
Fig. 5. Distribution of the tourist interest in the POI categories.
with 250 tourists for each city, i.e., for each city, we consider |UD| =250. For each tourist u ∈ UD, we associate one service
application profile selected randomly from the set 2|A|, the power set for A. By applying this approach, some tourists may be associated with no service application, which is also the truth in the real world.
For each city, we provide the set of POIs (V), the ICT infrastructure information, and the set of tourists along with their preference and application profiles to MEC-PIR and RA-PersTour. We evaluate both algorithms using leave-one-out cross-validation [26]. To this end, we use all travel sequences of a tourist to build her interest (Intu(c), ∀c ∈ C),
except the one we want to test. We also use the starting POI (vu
s), ending POI (vfu), and budget (Bu) of the testing
travel sequence as the corresponding starting POI, ending POI, and budget of the tourist profile.
Similar to other works related to recommendation
algo-rithms [6], [11], [12], we use metrics such as Recall,
Preci-sion, and F-score to evaluate MEC-PIR against RA-PersTour. We also introduce two new metrics, namely, Allocation
Efficiencyand User Experience to assess the performance
of the algorithms on allocating resources in the edge and the overall user experience provided by the recommended itinerary. The metrics are detailed in the following.
• Recall: the fraction of POIs from the real-world
test-ing travel sequence that also exists in the generated itinerary. Let Suk be the real-world testing travel
se-quence and Iu∗j be the generated itinerary. The Recall is
defined as: Recall(Iu∗j ) = |Iu∗j ∩ Suk| / |Suk|.
• Precision: the fraction of POIs from the generated
itinerary (Iu∗j ) that also exists in the real-world testing
travel sequence (Sku), i.e., P recision(I j u∗) =|I j u∗∩Suk| |Ij u∗| .
F-score(Iu∗j ) =
2 × P recision(Iu∗j ) × Recall(I j u∗)
P recision(Iu∗j ) + Recall(Iu∗j )
.
• Allocation Efficiency (AE): the amount of
comput-ing and network resource allocated to the generated itinerary (Iu∗j ), relative to the maximum amount
de-manded by the set of chosen service applications (λmax u
and ψmax
u ). This is only calculated for those tourists
that make use of at least one service application and it is defined as:
AE(Iu∗j ) = X
vi∈V
p(Iu∗j , vi)
2|Iu∗j |λmaxu
+ X
vi∈V
X
m∈M
q(Iu∗j , vi, m)
2|Iu∗j |ψmaxu
.
• User Experience (UE): determines the relation
be-tween the allocation efficiency associated with the generated itinerary (AE(Iu∗j )) and the profit as
per-ceived by the tourist for this itinerary (P rof (Iu∗j )).
The rationale is that high AE alone does not make an itinerary good/better, and UE also embeds the tourist interest within it. Formally, U E(Iu∗j ) =
AE(Iu∗j )N orm(P rof (I j u∗)).
Table 4 along with Table 3 summarize the main parame-ters and their values employed in the evaluation.
TABLE 4 Model parameters.
Parameter Value
A {augmented reality,video streaming}
λvi 75 Mbps ψm 37.5 RCs |UD| 250 |V| 30 |M| 2 α 0.5 tsplit 8 hours ∆t 1 minute T 480 minutes
All experiments were performed in a virtual machine (VM) that runs Debian 9 GNU/Linux and is configured with 16 vCPUs, 64 GB RAM, and 40 GB of virtual disk. The VM is hosted in a server with 2 Intel Xeon Silver 4114 @ 2.20GHz. In MEC-PIR, the first stage of the MEC-PTR problem is implemented using C++. The second stage of the problem is implemented using Python 2.7.12, docplex 2.8.125, and IBM CPLEX 12.8.0 (as the solver). The PersTour algorithm is also implemented using Python 2.7.12, docplex 2.8.125, and IBM CPLEX 12.8.0.
6.4 Results and discussion
As described in Section 6.3, we provide the same input to MEC-PIR and to RA-PersTour. The output of both al-gorithms is a set I∗, containing one itinerary for each
tourist u ∈ UD. For both sets, we compute the metrics
Recall, Precision, F-score, AE, and UE for every itinerary
Iu∗j ∈ I∗. Table 5 summarizes the performance achieved by
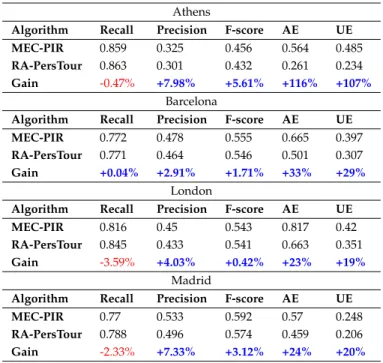
both algorithms in each metric, for each city considered in the evaluation. These results correspond to the average of the values found for the itineraries.
By design, our algorithm may accept some penalty in the scores in order to improve resource allocation and user experience. In practice, this approach has shown that the negative impact is negligible. MEC-PIR outperforms RA-PersTour in all metrics, except Recall of three cities. Even though, the difference was very low. The advantages in performance are higher for the metrics AE and UE, meaning that MEC-PIR has the ability to choose itineraries that provide better resource allocation and better overall user experience. Since our algorithm achieves better performance also in the metric F-score, this means that MEC-PIR is also satisfying the user interest. In the evaluated dataset, MEC-PIR improved in at least 19% the
UE, which corresponds to the city of London. In the city of Athens, our algorithm improved in more than 100% the UE.
TABLE 5
Average performance of MEC-PIR and RA-PersTour.
Athens
Algorithm Recall Precision F-score AE UE MEC-PIR 0.859 0.325 0.456 0.564 0.485 RA-PersTour 0.863 0.301 0.432 0.261 0.234
Gain -0.47% +7.98% +5.61% +116% +107%
Barcelona
Algorithm Recall Precision F-score AE UE MEC-PIR 0.772 0.478 0.555 0.665 0.397 RA-PersTour 0.771 0.464 0.546 0.501 0.307
Gain +0.04% +2.91% +1.71% +33% +29%
London
Algorithm Recall Precision F-score AE UE MEC-PIR 0.816 0.45 0.543 0.817 0.42 RA-PersTour 0.845 0.433 0.541 0.663 0.351
Gain -3.59% +4.03% +0.42% +23% +19%
Madrid
Algorithm Recall Precision F-score AE UE MEC-PIR 0.77 0.533 0.592 0.57 0.248 RA-PersTour 0.788 0.496 0.574 0.459 0.206
Gain -2.33% +7.33% +3.12% +24% +20%
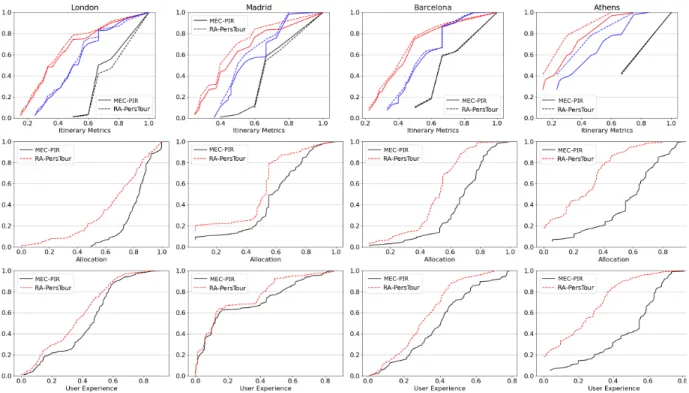
To illustrate how the metric values are distributed over the itineraries belonging to the solution (I∗), Fig. 6 shows
the CDF of the evaluation metrics for both algorithms. Ac-cording to the CDFs of AE and UE, in addition to achieving better average performance than RA-PersTour, MEC-PIR also systematically performs better resource allocation and better overall user experience. In other words, the average improvement of MEC-PIR does not come from punishing cer-tain tourists in order to benefit others. Naturally, the level of improvement varies according to the resource constraints faced by each tourist along her tour. On the other hand, MEC-PIR works with the Pareto front solutions for a tourist, which means a set of solutions in which may exist itineraries with scores lower the highest. This means that we were aware of some impact in the traditional metrics, i.e., Recall,
Precision, and F-score. However, the size and the extent of
this impact was unknown in advance. As shown in Fig. 6, the negative impact is negligible for all tourist, i.e., no one has her score notably affected in order to improve the overall gain. Actually, in most of the traditional metrics, MEC-PIR outperforms RA-PersTour.
MEC-PIR
MEC-PIR MEC-PIR MEC-PIR
MEC-PIR MEC-PIR
MEC-PIR
MEC-PIR MEC-PIR MEC-PIR
MEC-PIR
MEC-PIR
Fig. 6. CDF of the evaluation metrics. In the CDF of the Itinerary Metrics, black, red and blue colors representing, respectively, theRecall, Precision andF-score, with the performance of MEC-PIR being displayed with continuous lines and that of RA-PersTour represented by dashed lines. Each column represents the results for a city.
0 100 200 300 400 500 600
Barcelona Madrid London Athens
20.4 13.8 34.2 18.8 15.4 34.3 20.1 18.1 38.3 79.1 431.3 510.4 Time (sec) Stage 1 Stage 2 Total
Fig. 7. MEC-PIR execution time.
in each stage per city. For all cities, with the exception of Athens that contains a large set of candidate itineraries to choose from (with more than 9,000 paths), MEC-PIR takes less then 40 seconds to solve the entire MEC-PTR problem. For Athens, the entire problem takes less than 10 minutes to be solved and the vast majority of the time is spent to solve the second stage of the problem, which depends on the solver performance. Indeed, our approach to solve the first stage of the problem using a dynamic programming version of the ESPPRC has proven to be very efficient, taking less than 2 minutes for Athens and less than 30 seconds for the other cities. This is an important result since the databases of other cities may demand scalability similar to the one observed in Athens. In summary, the experimental results demonstrate that MEC-PIR achieves gains from near 20% up to more than 100% in both resource allocation efficiency and user experience, while presenting performance similar to RA-PersTour in the traditional metrics for evaluation of personalized itinerary recommendation. In addition, MEC-PIR solves the MEC-PTR problem for instances of realistic size in a reasonable amount of time.
7
C
ONCLUSIONOur work is motivated by the next-generation touristic services, where tourists will augment their visiting experi-ence with service applications employing Multi-access Edge Computing. In this context, we formalize the problem of rec-ommending personalized itineraries for tourists, i.e., taking into consideration not only the POIs and user interests, but also (i) the resource demands of the used service applica-tions; and (ii) the availability of MEC resources to support the services, defined as MEC-PTR.
The objective of MEC-PTR is to improve the overall physical and virtual experience of the tourists by maximiz-ing the sum of scores for the chosen itineraries and prioritiz-ing resource allocation at the network edge, while respectprioritiz-ing the capacity of the computing and network resources. We introduced the MEC-PIR algorithm, which efficiently solves the MEC-PTR problem. We compare MEC-PIR with RA-PersTour, a state-of-the-art solution adapted to this sce-nario. Results show that MEC-PIR performs better than RA-PersTour from near 20% up to 100% in resource allocation efficiency and also in user experience, while presenting a similar performance in traditional metrics of personalized itinerary recommendation.
Although satisfactory results were obtained with the Dynamic Programming version of the ESPPRC for the first stage of the problem, the second stage may face scalability issues under specific conditions, as suggested by the eval-uation of Athens city. As a future work, we intend to in-vestigate some meta-heuristic approaches, e.g., Ant Colony Optimization, in order to speed up the second stage. We also plan to include a degree of uncertainty in the model, since not all tourists may follow the recommendation and may, for example, extrapolate the visiting time, affecting (or being affected by) the resource allocation. We are also interested