UNIVERSITÉ DE MONTRÉAL
FABRICATION AND CHARACTERIZATION OF FIBER OPTICAL
COMPONENTS FOR APPLICATION IN GUIDING, SENSING AND
MOLDING OF THZ AND MID
IR RADIATION
ANNA MAZHOROVA
DÉPARTEMENT DE GÉNIE PHYSIQUE ÉCOLE POLYTECHNIQUE DE MONTRÉAL
THÈSE PRÉSENTÉE EN VUE DE L’OBTENTION DU DIPLÔME DE PHILOSOPHIAE DOCTOR
(GÉNIE PHYSIQUE) AOÛT 2012
UNIVERSITÉ DE MONTRÉAL
ÉCOLE POLYTECHNIQUE DE MONTRÉAL
Cette thèse intitulée:
FABRICATION AND CHARACTERIZATION OF FIBER OPTICAL
COMPONENTS FOR APPLICATION IN GUIDING, SENSING AND
MOLDING OF THZ AND MID
IR RADIATION
présentée par: MAZHOROVA Anna
en vue de l’obtention du diplôme de : Philosophiae Doctor a été dûment acceptée par le jury d’examen constitué de : Mme BOUDOUX Caroline, Ph.D., présidente
M. SKOROBOGATIY Maksim A., Ph.D., membre et directeur de recherche M. CALOZ Christophe, Ph.D., membre
DEDICATION
« Le travail éloigne de nous trois grands maux: l'ennui, le vice et le besoin » Voltaire
I’d like to dedicate this thesis to my family and friends, especially…
to Stepan for your faithful love, support, making me laugh when I needed it; to my friend Andrey for his patience and understanding;
to Dad and Mom for instilling the importance of hard work
and higher education; to grandma, grandpa and my friend Olga for encouragement;
to the families of Francis, Mathieu, Denis and Victoria may you also be motivated and encouraged to reach your dreams.
ACKNOWLEDGEMENTS
It’s amazing to sit and think how many people over the past three years and four months, or around one thousand, two hundred and twenty days to be more precise, have contributed to, or supported my own motivation to complete this PhD, and it’s even more difficult to attempt to acknowledge all those who have contributed to this process in other ways over that time, or even before it started. However, I would like to express my heartfelt gratitude to my supervisor and research director Prof. Maksim Skorobogatiy who was abundantly helpful and offered invaluable assistance, support and guidance during my PhD.
During the last two years, I had the pleasure of visiting the Ultrafast Optical Processing Research Group at INRS-EMT, Varennes. It was there where I met prof. Roberto Morandotti and had the chance to work with him and his people. I would like to thank him and his postdocs Marco Peccianti and Matteo Clerici for the help and collaboration with the composite film project.
It was a great pleasure to work with prof. Mohammed Zourob (Biosensors, BioMEMS and Bionanotechnology Research Group at INRS-EMT, Varennes). Thanks to collaboration with him, and his postdocs Andy Ng and Raja Chinnappan, in June 2012 I became award winner of the “Étudiants-chercheurs étoiles” (of the Fonds de Recherche du Quebec Nature et technologies) competition with my paper entitled “Label-free bacteria detection using evanescent mode of a suspended core terahertz fiber”.
I have been surrounded by wonderful colleagues Stepan Gorgutsa, Andrey Markov, Bora Ung, Mathieu Rozé, Alexandre Dupuis, Hang Qu. I would like to thank them for the helpful discussions, fiber fabrication and simply mutual support.
Finally I would like to give a special acknowledgement to our ex-technician Francis Boismenu. He offered not only excellent technical assistance when I need it but also much appreciated moral support at any situation.
RÉSUMÉ
Le domaine du térahertz (THz) se réfère aux ondes électromagnétiques dont les fréquences sont comprises entre 0.1 et 10 THz, ou encore pour des longueurs d'onde entre 3 mm et 30 μm. Ce type de radiation, qui se situe entre les ondes radios et la lumière infrarouge, possède des propriétés uniques. Les ondes térahertz peuvent passer à travers diverses substances amorphes, plusieurs matériaux synthétiques et des textiles, mais aussi des diélectriques non polaires tels des matériaux à base de pâtes et papiers, qui sont aussi partiellement transparents aux ondes térahertz. Plusieurs biomolécules, protéines, explosifs ou narcotiques, possèdent aussi des lignes d'absorption caractéristiques (entre 0.1 and 2 THz) tels des « codes barres » permettant de les identifier. Il y a deux avantages principaux à l'utilisation des ondes THz: d'une part elles peuvent pénétrer des matériaux normalement opaques à d'autres fréquences, et d'autre part, et elles permettent une haute sélectivité chimique. Par ailleurs, les ondes THz possèdent une basse énergie (1 THz = 4.1 meV), soit un million de fois plus faible que les rayons X, et ne causent pas d'effets photo-ionisant néfastes aux tissus biologiques. Ceci offre un avantage majeur autant pour l'imagerie de tissus biologiques que dans un contexte médical opérationnel, pour lesquels diverses substances doivent être exposées à la radiation THz. Dans le cadre de cette thèse, j'ai travaillé sur trois sujets de recherche principaux.
Le premier sujet concerne le développement de nouvelles méthodes de fabrication et de caractérisation térahertz de couches minces composites contenant une matrice de microfils alignés en métal (alliage d'étain) ou en verres semi-conducteurs de chalcogénures (As2Se3). Les matrices de microfils sont fabriquées par la technique d'empilement-et-étirage de fibres employant de multiples étapes de co-étirage de métaux et verres semi-conducteurs à basse température de fusion, avec les polymères. Les fibres sont ensuite empilées et comprimées ensembles pour former des couches minces en composites (i.e. couches de métamatériaux). La transmission optique à travers ces couches minces de métamatériaux a été effectuée sur toute la plage des térahertz (0.120 THz) en combinant les mesures d'un spectromètre infrarouge à transformée de Fourier (FTIR) ainsi qu'un spectromètre térahertz résolu dans le temps (THz-TDS). Les couches de métamatériaux comportant des microfils de métal démontrent de fortes propriétés polarisantes, alors que ceux contenant des microfils semi-conducteurs permettent un large contrôle de l'indice de réfraction tout en étant insensibles à la polarisation incidente. Grâce
au formalisme théorique des matrices de transfert, j'ai démontré une approche permettant d'évaluer l'indice de réfraction complexe des couches de métamatériaux composites. J'ai par la suite développé l'algorithme employé pour extraire les propriétés optiques de l'alliage de métal utilisé dans la fabrication des couches de métamatériaux via l'approximation des milieux effectifs. Finalement, j'ai étudié les obstacles à surmonter dans la fabrication des métamatériaux avec des fils métalliques de dimensions sub-micrométriques, via un processus itératif d'empilement et étirage, en comparant les couches fabriquées après 2, 3 et 4 étirages successifs. Lorsqu'on utilise des alliages de métal on a observé des effets de séparation de phase et la formation de nano-grillages sur les microfils de métal.
La principale difficulté dans le design de guides d'onde térahertz réside dans le fait que pratiquement tous les matériaux connus sont hautement absorbants dans la région du térahertz. Puisque les milieux gazeux sont ceux offrant le moins de résistance à la propagation des ondes THz, une approche efficace pour le design de guides d'ondes est de maximiser la fraction de puissance THz guidée dans les régions gazeuses. Différents types de guides d'ondes THz ont été démontrés sur la base de ce concept. Par exemple, un guide d'onde sous-longueur d'onde comportant un cœur de taille beaucoup plus petit que la longueur d'onde de la lumière, et par conséquent, une large fraction de la puissance THz est guidée en dehors du cœur à hautes pertes.
Un guide d'onde opérant selon ce principe a récemment été démontré par notre groupe de recherche. Ce guide d'onde présente une fibre sous-longueur d'onde suspendue par des ponts étroits au milieu d'un grand tube. Les larges canaux créés par les ponts et le tube forment un système opto-fluidique offrant un accès facile pour l'insertion de substances liquides à analyser ou pour la purge avec des gaz sans humidité. Particulièrement, le guide d'onde THz sous-longueur d'onde employé dans nos expériences comporte un cœur de 150 µm suspendu par trois ponts de 20 µm d'épaisseur au centre d'un tube de 5.1 mm de diamètre et 4 cm de long. Ce type de guide d'onde présente des avantages majeurs pour des applications en biosensing. Premièrement, ce guide d'onde permet un accès direct et facile au cœur de la fibre et au champ évanescent guidé à son pourtour. Deuxièmement, la gaine externe permet d'isoler efficacement le mode guidé par le cœur, de l'environnement extérieur (e.g. supports à fibre), prévenant ainsi toute perturbation externe indésirable sur le signal térahertz se propageant dans le cœur.
Pour cette thèse, j'ai démontré pour la première fois un capteur de bactéries E. coli basé sur le champ évanescent du mode fondamental d'une fibre à cœur suspendu. Ce dispositif est capable de détecter des bactéries E. coli à des concentrations de l'ordre du 104
-109cfu/ml. Le cœur de la fibre est rendu biofonctionnel par l’adsorption de bactériophages T4 qui se fixent aux bactéries cibles pour ensuite les lyser (i.e. détruire). À l'aide de microscopie électronique à balayage (MEB) nous avons démontré que les bactéries E. coli sont d'abord capturées par les phages et ensuite détruites en des fragments de taille ~1m qui demeurent fixés sur les parois de la fibre. La fixation des phages aux bactéries et la lyse subséquente sont étroitement corrélées à une forte augmentation de l’absorption des ondes térahertz. Ce signal permet de détecter les bactéries et d’en mesurer la concentration. La technique de détection proposée ne repose pas sur le marquage des bactéries E. coli ni sur la signature d’absorption spectrale spécifique à ces bactéries dans le spectre térahertz.
Finalement dans le dernier sujet de recherche de ma thèse, j'ai étudié les performances d'un guide d'onde capillaire à base de verres en chalcogénures permettant une transmission couvrant les spectres de l'infrarouge moyen (IR-m) et du térahertz. Les verres de chalcogénures sont d'un grand intérêt pour des applications potentielles dans les régions de l'infrarouge proche (IR-p) et de l'infrarouge moyen (114 µm), et ce en raison des pertes relativement faibles et des non-linéarités optiques élevées. De plus, les fibres optiques microstructurées à base de verres de chalcogénures ouvrent la porte à de nombreuses possibilités pour le développement d'innovations dans le spectre IR-m où les applications émergentes en télédétection, génération de supercontinuum et propagation guidée de lumière IR, et la transmission de radiation laser CO et CO2, ont été démontrées. Nous proposons ici que l'emploi des verres de chalcogénures représente aussi d'un grand intérêt pour le spectre THz, et ce pour différentes raisons. Plus particulièrement, ces verres offrent un haut indice de réfraction et leur absorption dans le THz présente plusieurs régions de transmission à relativement faibles pertes et haute non-linéarité optique.
En exploitant les propriétés uniques des verres de chalcogénures dans les spectres IR-m et THz, nous prévoyons la possibilité de créer une source de radiation THz cohérente à fibre pompée par une source laser dans l'IR-m. À cet effet, nous montrons que les capillaires en verres de chalcogénures As38Se62 peuvent agir en tant que guides d'ondes sur toute la région spectrale de l'infrarouge moyen et du térahertz. Ces capillaires sont fabriqués via une technique à double creuset. Cette approche permet la production de capillaires en verre avec des épaisseurs de l'ordre
de 12 µm à 130 µm. Ces capillaires montrent un guidage à faibles pertes sur toute la plage de l'IR-m et du THz. Nous démontrons expérimentalement que le guidage à faibles pertes avec de minces capillaires implique divers mécanismes physiques dont les réflexions de Fresnel à la parois des capillaires, un guidage anti-résonant (de type "ARROW") causé par l'interférence à l'intérieur des parois des capillaires, en plus du guidage par réflexion totale interne dans lequel les minces parois des capillaires agissent tel un guide d'onde poreux sous-longueur d'onde, ce dernier type de guidage pouvant être observé à de grandes longueur d'ondes dans la région du THz.
ABSTRACT
The terahertz (THz) range refers to electromagnetic waves with frequencies between 100 GHz and 10 THz, or wavelengths between 3 mm and 30 μm. Light between radio waves and infrared has some unique properties. Terahertz waves pass through a variety of amorphous substances, many synthetics and textiles, but also nonpolar dielectric materials, like paper-based materials and cardboard, are transparent to the terahertz waves. Many biomolecules, proteins, explosives or narcotics also have unique characteristic absorption lines, so-called spectral “fingerprints”, at frequencies between 0.1 and 2 THz. There are two main advantages of the terahertz radiation: penetration of conventionally opaque materials on the one hand, and their non-ionising nature on the other hand. Particularly, THz waves have low photon energies (1 THz = 4.1 meV), one million times weaker than X-rays, and will not cause harmful photoionization in biological tissues. This has advantages both for imaging biological materials and in operational contexts where different objects have to be exposed to THz radiation. Within the scope of this work I would like to address three main research topics.
In Chapter 2, I describe fabrication method and THz characterization of composite films containing either aligned metallic (tin alloy) microwires or chalcogenide As2Se3 microwires. The microwire arrays are made by stack-and-draw fiber fabrication technique using multi-step co-drawing of low-melting-temperature metals or semiconductor glasses together with polymers. Fibers are then stacked together and pressed into composite films. Transmission through metamaterial films is studied in the whole THz range (0.120 THz) using a combination of FTIR and TDS. Metal containing metamaterials are found to have strong polarizing properties, while semiconductor containing materials are polarization independent and could have a designable high refractive index. Using the transfer matrix theory, it was shown how to retrieve the complex polarization dependent refractive index of the composite films. We then detail the selfconsistent algorithm for retrieving the optical properties of the metal alloy used in the fabrication of the metamaterial layers by using an effective medium approximation. Finally, we study challenges in fabrication of metamaterials with sub-micrometer metallic wires by repeated stack-and-draw process by comparing samples made using 2, 3 and 4 consecutive drawings. When using metallic alloys we observe phase separation effects and nano-grids formation on small metallic wires.
In Chapter 3, we have studied fabrication and bacteria detection application of the low-loss subwavelength THz microstructured fibers. This is the second research topic discussed in my thesis. In fact, in June 2012 I became one of the award winners of the “Étudiantschercheurs étoiles” (of the Fonds de Recherche du Quebec Nature et Technologies) competition with my paper entitled “Label-free bacteria detection using evanescent mode of a suspended core terahertz fiber”.
One of the key difficulties in the design of terahertz waveguides lies in the fact that almost all materials are highly absorbing in the terahertz region. Since the lowest absorption loss occurs in dry gases, an efficient waveguide design must maximize the fraction of power guided in the gas. Different types of THz waveguides have been proposed based on this concept including a subwavelength waveguide featuring a core with a size much smaller than the wavelength of light in which a large fraction of the guided light is found outside of the lossy core region. A practical design of such a waveguide was recently proposed in our research group and presents a subwavelength fiber suspended on thin bridges in the middle of a larger protective tube. Large channels formed by the bridges and a tube make a convenient opto-microfluidic system that is easy to fill with liquid analytes or purge with dry gases. Particularly, the THz subwavelength waveguide used in our experiments features a 150 µm core fiber suspended by three 20 µm-thick bridges in the center of a 5.1 mm diameter tube of 4 cm in length. This waveguide design presents several important advantages for bio-sensing applications. First, the waveguide structure allows direct and convenient access to the fiber core and to the evanescent wave guided around it. Second, the outer cladding effectively isolates the core-guided mode from the surrounding environment, (e.g. fiber holders), thereby preventing the undesirable external perturbations of the terahertz signal.
Next, for the first time an E. coli bacteria sensor based on the evanescent field of the fundamental mode of a suspended-core terahertz fiber was proposed. The sensor is capable of E. coli detection at concentrations in the range of 104109cfu/ml. The fiber core is biofunctionalized with T4 bacteriophages which bind and eventually destroy (lyse) their bacterial target. Using environmental SEM we demonstrate that E. coli is first captured by the phages on the fiber surface. After 25 minutes, most of the bacteria is infected by phages and then destroyed with ~1m-size fragments remaining bound to the fiber surface. The bacteria-binding and
subsequent lysis unambiguously correlate with a strong increase of the fiber absorption. This signal allows the detection and quantification of bacteria concentration. Presented bacteria detection method is label-free and it does not rely on the presence of any bacterial “fingerprint” features in the THz spectrum.
Finally, in Chapter 4, low-loss chalcogenide capillary-based waveguides that operate both in the mid-IR and THz spectral ranges are investigated. Chalcogenide glasses have attracted strong interest in a view of optical applications in the near-IR and mid-IR spectral ranges (114 µm) due to their relatively low losses and high nonlinearities. Furthermore, chalcogenide glass-based microstructured fibers open many interesting possibilities for a large number of applications in the mid-IR spectral range, where applications in optical sensing, supercontinuum generation and single-mode propagation of IR light, transmission of the CO and CO2 laser radiation have already been demonstrated. We believe that chalcogenide glasses can be also of great interest to the THz spectral range for several reasons. Particularly, these glasses offer very high refractive index, and their absorption losses show several regions of relatively low loss and high nonlinearity.
By exploiting the outstanding performance of chalcogenide glasses in the mid-IR and THz spectral ranges one can envision building fiber-based THz light sources with pumping in the mid-IR. We show that chalcogenide glass As38Se62 capillaries can act as efficient waveguides in the whole mid-infrared terahertz spectral range. The capillaries are fabricated using a double crucible drawing technique. This technique allows producing of the glass capillaries with wall thicknesses in the range of 12 µm to 130 µm. Such capillaries show low loss guidance in the whole mid-IRTHz spectral range. We demonstrate experimentally that low loss guidance with thin capillaries involves various guidance mechanisms including Fresnel reflections at the capillary inner walls, resonant guidance (ARROW type) due to light interference in the thin capillary walls, as well as total internal reflection guidance where very thin capillary walls act as a subwavelength waveguide which is especially easy to observe in the THz spectral range.
TABLE OF CONTENTS
DEDICATION ... III ACKNOWLEDGEMENTS ... IV RÉSUMÉ ... V ABSTRACT ... IX TABLE OF CONTENTS ...XII LIST OF FIGURES ... XV LIST OF SYMBOLS AND ACRONYMS ... XXII
INTRODUCTION ... 1
SCIENTIFIC OUTCOMES OF MY DOCTORAL RESEARCH ... 10
CHAPTER 1 MOTIVATION AND OBJECTIVES OF MY RESEARCH ... 12
1.1 Motivation and objectives of my research ... 12
1.2 Origins and main project results ... 14
1.3 Structure of the thesis ... 15
CHAPTER 2 LITERATURE REVIEW ... 17
2.1 Metamaterials in the THz spectral range ... 17
2.1.1 Effective medium approaches ... 18
2.1.2 Wire grid theory ... 19
2.1.3 Metamaterials for THz optical components ... 21
2.1.4 Fabrication methods ... 23
2.2 Chemical or biological detection methods that operate in the terahertz spectral range . 26 2.3 Guiding THz waves using thin chalcogenide capillaries ... 30
CHAPTER 3 COMPOSITE THZ MATERIALS USING ALIGNED METALLIC AND
SEMICONDUCTOR MICROWIRES, EXPERIMENTS AND INTERPRETATION ... 33
3.1 Introduction ... 33
3.2 Fabrication process ... 34
3.3 Transmission measurements ... 36
3.4 Interpretation of the experimental data ... 39
3.4.1 Procedure for retrieving the refractive index and losses of pure polymers ... 39
3.4.2 Procedure for retrieving the refractive index and permittivity of metamaterial layers 42 3.4.3 Extracted refractive index and permittivity of the films ... 44
3.5 Discussion ... 49
3.5.1 Effective medium theory ... 49
3.5.2 Nanostructured inclusions ... 51
3.6 Conclusion ... 51
CHAPTER 4 LABEL-FREE BACTERIA DETECTION USING EVANESCENT MODE OF A SUSPENDED CORE TERAHERTZ FIBER ... 53
4.1 Introduction ... 53
4.2 Terahertz subwavelength fiber ... 53
4.3 Materials and methods ... 55
4.3.1 Bacteria culture ... 55
4.3.2 Phage production ... 55
4.4 Characterization ... 56
4.5 Results and Discussion ... 61
4.6 Simple theoretical model to explain changes in the fiber absorption loss ... 63
CHAPTER 5 THIN CHALCOGENIDE CAPILLARIES AS EFFICIENT WAVEGUIDES
FROM MID-IR TO THZ ... 69
5.1 Introduction ... 69
5.2 Glass synthesis and capillaries fabrication ... 69
5.3 Absorption loss of the As38Se62 glass ... 71
5.4 Results and discussion ... 72
5.4.1 Capillaries in mid-IR spectral range ... 75
5.4.2 Capillaries in the THz spectral range ... 78
5.5 Conclusion ... 81
GENERAL DISCUSSION ... 82
CONCLUSION ... 91
LIST OF FIGURES
Fig. 1.1. Pictures of the adaptable-path-length THz-TDS setup for measuring the transmission of THz waveguides a) at 0 cm length, in the absence of a waveguide, the mirror assembly is translated to the far left so that the focal points of the input and output parabolic mirrors are in focus; b) at maximum length of 45 cm. In our setup, waveguides up to 50 cm in length can be measured by simply translating the position of these two mirrors along the rail, as illustrated. ... 2 Fig. 1.2. a) The schematic diagram of a THz dipole photoconductive antenna, b) photograph of the chip with six antennas on it. It is based on low temperature-grown GaAs and optimized for the laser source at 780 nm emission wavelength with 120 fs pulse duration (which is used in our setup). ... 3 Fig. 1.3. a) Photoconductive antenna acting in the THz generation regime: photocarriers are accelerated by the voltage bias. b) Photoconductive antenna acting as a THz detector: photocurrent is proportional to ETHz( )t . ... 4
Fig. 1.4. The THz electric field is measured point-by-point in the time-domain (ETHz( )t ) using a THz detector (photoconductive antenna). b) The Fourier transform of the time signal gives an amplitude ( ETHz( )f ) and phase (phase E THz( )f ) information. Presence of water vapor
absorption peaks in the amplitude spectrum could be observed. ... 4 Fig. 1.5. Basic scheme of a THz-TDS transmission experiment: sample under study is a parallel plate with thickness dand complex refractive index n. ... 5 Fig. 2.1 Wire array medium ... 20 Fig. 2.2. (a) Schematic of a metal-dielectric preform, drawn into a metamaterial via heating. (b) SEM micrograph of a fabricated 590 m indium-filled PMMA fiber cross-section. (c) Experimentally measured metamaterial transmittance, the electric field E is either parallel (solid line) or perpendicular (dashed line) to the wires. A measurement for an array of 500 m PMMA fibers is also shown (dotted line) [Reprinted from Ref. [63]]. ... 24 Fig. 2.3. (a) Optical microscope image of the metamaterial array. (b) SEM micrograph of i) the cross section of the metamaterial fiber and ii) of its 250 nm silver coating. (c) Optical
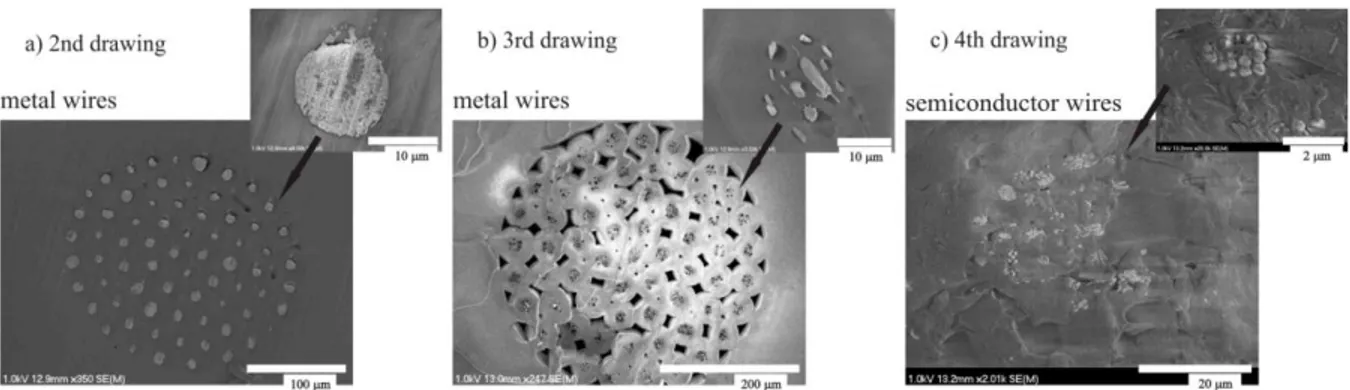
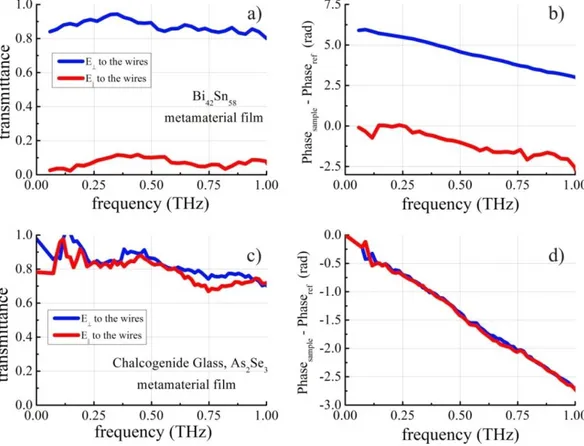
microscope image of the cross section of (i) 350 μm, (ii) 300 μm and (iii) 250 μm fiber originating from the same preform. (c) Cross-sectional image of the spooled 250 μm fibers. [Adapted from Ref.[65]] ... 25 Fig. 2.4. (a) Optical microscopy image of one portion of an as-fabricated paper metamaterial sample. (b) Experimentally measured transmission spectra of the paper metamaterial sample coated with a series of glucose solution [Reprinted from Ref. [72]]. ... 26 Fig. 2.5 Parallel plate waveguide (PPWG) [Reprinted from Ref.[68]]. ... 27 Fig. 2.6. Experimental setup for THz evanescent wave sensing by using a subwavelength plastic wire. The inset illustrates the cross section of interaction between THz evanescent wave and the sample where D1 refers to the separation between wire and top surface of sample and D2 denotes the depth of the PP holder [Reprinted from Ref. [78]] ... 28 Fig. 2.7. a) Size of the plasmon’s tail in visible range (typical size is less than 100 nm) and b) probing length of the evanescent field of an optical waveguide (in THz spectral range) that are used to detect changes in the optical properties at the interfaces. ... 29 Fig. 3.1. SEM pictures of the cross-sections of fabricated wire-array metamaterial fibers. a) metal wire fiber after 2nd drawing, b) metal wire fiber after 3rd drawing, c) semiconductor wire fiber after 4th drawing. Insets show magnification of individual wires. Inset of c) shows cluster of nanowires with the individual fiber diameters as small as 200nm. ... 34 Fig. 3.2. Optical micrographs of a film containing (a) metal, and (b) semiconductor microwire arrays. The metamaterial layer is sandwiched between the two polymer layers. Figures (c) and (d) present top view of the films where metal and semiconductor wires can be seen to traverse the entire span of the film. ... 35 Fig. 3.3. FTIR transmission spectra (0.1–20 THz) of a metamaterial film containing ordered (a) metal and (b) semiconductor wires. Strong polarization dependence of transmission spectrum is observed for metallic wire arrays. ... 37 Fig. 3.4. Transmission spectra (a, c) and phase difference (b, d) of THz light through metamaterial film containing (a, b) ordered metallic wires, (c, d) ordered semiconductor wires. ... 38
Fig. 3.5. Schematic of (a) one layer of plastic and (b) a metamaterial film modeled as a three layer system. The subscripts indicate the layer number, while the + and the – signs distinguish incoming and outgoing waves, respectively. ... 39 Fig. 3.6. Transmission spectra (a) and phase difference (b) of THz light through a plastic slabs. 40 Fig. 3.7. a) real part of the refractive index and b) absorption losses of pure plastics PC, PSU. ... 42 Fig. 3.8. Extracted (a) refractive index, and (b) permittivity of a metamaterial layer containing metal wires. ... 46 Fig. 3.9. Extracted (a) refractive index, and (b) permittivity of a metamaterial layer containing chalcogenide glass wires ... 48 Fig. 3.10. Microwires after 2nd drawing featuring nanogrids. Microwires were obtained by dissolving PC polymer matrix. In the inset, shown is a pure Bi, Sn lamellar structure due to phase separation of an alloy. ... 51 Fig. 4.1. (a, b) The THz fiber featuring a 150 µm core suspended by three 20 µm-thick bridges in the center of a 5.1 mm diameter tube, (c) 4 cm-long fiber piece used in the experiments. ... 54 Fig. 4.2. (a) Schematic of the experimental setup: the fiber is placed between the focal points of the two parabolic mirrors, (b) schematic presentation of phages adsorbed onto the fiber core. The capsid adsorbed onto the fiber, while the tail (which is specific to the bacteria) faces towards the cladding for bacteria capturing. ... 55 Fig. 4.3. SEM images illustrating each step of the experiment (a) step 1 – phages are immobilized on the fiber core surface, (b) step 2 – capturing of E.coli bacteria by the phages, and lysis of the bacteria, (c) step 3 – fiber is washed with PBS, bacteria chunks remain bound to the core surface. ... 56 Fig. 4.4. (a) Transmission spectrum of the fiber during each step of the experiment: step 1 – black line, only phages, step 2 – red line, transmission of the fiber decreased due binding of E. coli bacteria to the phages, step 3 – blue line, fiber is washed with PBS. Fiber transmission is increased but not up to the level of the first step, suggesting that some bacteria (or parts of it) remain bound to the fiber via specific interaction with the phages. (b) Difference in transmission between each step of the experiment. ... 57
Fig. 4.5. Zoom-in of the waveguide core, dashed line marks the area covered with the bacteriophages. Bacteria are clustered in the phage-covered surface with the rest of the surface blocked by BSA. ... 58 Fig. 4.6. SEM images of the fiber core (a) after 20 min since the beginning of the 2nd step; (b) after 30 min before washing with PBS (end of the 2nd step); (c) after 30 min after washing with PBS. The bacteria shape changed from a uniform rod shape to a random shape. Eventually, the bacteria cell wall ruptures and releases intracellular components with only the cell membrane left on the fiber. ... 59 Fig. 4.7. Absorption losses of the fiber. (a) reference sensorgram; (b) sensorgram for bacteria concentration at 106cfu/ml as a function of time; (c) Correlation between the changes in the fiber absorption losses and bacteria concentration: difference between base level (absorption losses of the fiber with phages immobilized on the fiber core) and losses of the “washed” fiber is shown in blue triangles, as a function of a concentration. Black dots correspond to the difference between absorption losses of the fiber after 2nd and 3rd steps (before and after fiber washing). ... 62 Fig. 4.8. SEM images of the fiber core with bacteria concentration of (a) 109 cfu/ml and 10 min interaction time (b) with a concentration of 106 cfu/ml, 10 min interaction time. ... 63 Fig. 4.9. Transverse distribution of power flow for the fundamental mode of (a) the real waveguide and of (b) the simplified design of the waveguide profile. The field is confined in the central solid core and is guided by total internal reflection. ... 64 Fig. 4.10. (a) Randomly distributed 1 µm water cylinders on the waveguide core’s surface for a given value of surface coverage. (b) Absorption loss of the fundamental mode for the fiber with a bacteria layer as a function of the bacteria coverage ratio. The crossing of the dash lines in the figure corresponds to the experimentally measured value of the propagation losses minus the theoretically estimated coupling loss for the 109 cfu/ml concentration of bacteria. ... 66 Fig. 5.1. Fabricated chalcogenide glass capillaries with different wall thickness in the range of (b) 12 µm to (a) 130 µm by double crucible glass drawing technique. To perform an imaging of thin wall capillaries, such as capillary with 12 µm walls shown at (b), they were glued in epoxy and then polished. ... 69
Fig. 5.2. Set-up for drawing capillaries using the double-crucible method. ... 70 Fig. 5.3. Absorption loss of the As38Se62 rod with diameter 350 µm. Absorption bands in the 3–5 µm spectral range corresponds to impurity absorptions due to SeH bond at 3.53, 4.12, 4.57 µm. Also strong absorption bands at 2.72.93 µm and 6.31 µm are due to OH–group and water. ... 71 Fig. 5.4. (a) Profile of the capillary waveguide. (b) Fabry-Pérot etalon. ... 72 Fig. 5.5. (a) Absorption losses of capillary with 22 µm average wall thickness in spectral range from 214 µm, measured with the cut-back method. (b) Measured period of the resonances
as a function of product of two consecutive resonance wavelengths m1m (µm2) from Fig. 5.5 (a) of absorption losses. (c) Measured period of the resonances f as a function of frequency. Blue dashed line is the experimental fit of the resonances, which gives the wall thickness value of tfit 21.2 4.8 µm, which is in a good agreement with measured with optical microscope wall thickness t22.1 5.5 µm. ... 75
Fig. 5.6. (a) Absorption losses of the capillary with average wall thickness 40 µm in the spectral range 214 µm. (b) measured period of the resonances m1m (difference between the
two adjacent absorption loss maxima m1,m) as a function of product of two consecutive
resonance wavelengths m1m (µm
2
) from Fig. 5.6 (a) of absorption losses. (c) Measured period of the resonances f as a function of frequency. Blue line is the experimental fit of the resonances, which gives the wall thickness value of tfit 41.4 5.6 µm, which is in a good
agreement with measurements via the optical microscope t40.1 6.2 µm ... 76
Fig. 5.7. (a) Absorption losses of the capillary in the spectral range 214 µm, it tends to show a featureless spectrum with ~15 dB/m losses. (b) and (c) optical micrographs of the capillary with outer diameter of 0.98 mm and averaged wall thickness 117 µm. ... 77 Fig. 5.8. (a) Transmittance by field of the effectively single mode 50 cm-long capillary with 98 µm average wall thickness and 0.95 mm diameter in the spectral range between 0.1 2.5 THz. At lower frequencies (< 0.3 THz) guidance mechanism is of TIR type with losses ~44 dB/m, while at higher frequencies (> 0.3 THz) guidance is of ARROW type with total losses ranging in the 58 93 dB/m range depending on the operation frequency;
(b) and (c) optical micrographs of the capillary used in the experiments with outer diameter of 0.95 mm and averaged wall thickness 98 µm .Orange dashed lines correspond to the positions of the water lines in the THz spectrum. ... 78 Fig. 5.9. Longitudinal energy flux distributions for (a) ARROW type fundamental (HE11 mode) in thick wall capillary (98 µm thickness, 0.95 mm diameter) at 0.57 THz, (b) total internal reflection (TIR) type mode guided by the deeply subwavelength capillary walls at 0.18 THz of the same capillary. ... 79 Fig. 5.10. (a) Transmittance of the capillary with average wall thickness 18 µm in the 0.12.0 THz spectral range with ~19 dB/m transmission loss at 0.75 THz. (b)(c) photograph of the capillary used in the experiments with outer diameter of 1.56 mm and average wall thickness 18 µm . ... 80 Fig. 5.11 (a) THz electric field ETHz( )t as a function of the delay line displacement and (b) associated recalculated time in picoseconds. (c) Zoom-in of the THz electric field ETHz( )t
measured point-by-point in the time-domain with N1024 points, t 68.2ps and dx10m . The Fourier transform of the time signal gives an amplitude ETHz( )f with fmax 7.5THz (d)-(e) and with a frequency resolution df 14.66THz (Fig. 5.11 (f)). ... 83 Fig. 5.12. Comparison of the typical spectra from the THz Emitter measured at a) 12% and b) 65% of humidity. Water absorption lines are indicated by red dashed lines in the range of 03 THz. At high humidity levels the spectrum is very much altered by absorption lines. .. 84 Fig. 5.13. a) a top view and b) front view of the THz fiber, fixed between two irises and placed between the focal points of the two parabolic mirrors for the label free bacteria detection. . 85 Fig. 5.14. a) Front view of the chalcogenide glass capillary, suspended on the threads fixed over the holder placed on 3-axis translation stage. This kind of holder was used, because thin-walled capillaries are very fragile. b) The capillary was aligned with respect of the two apertures and placed between the focal points of the two parabolic mirrors. ... 86 Fig. 5.15. (a) Transmission spectrums of the fiber during each step of the label-free bacteria detection experiment: step 1- black line, only phages, step 2 – red line, transmission of the fiber decreased due binding of E. coli bacteria to the phages, step 3 – blue line, fiber is washed with PBS. Green line –a reference spectrum. Positions of the water absorption lines
are indicated by orange dashed lines. (b) The THz subwavelength waveguide used in our experiments features a 150 μm core fiber suspended by three 20 μm-thick bridges in the center of a 5.1 mm diameter tube. (c) Transverse distribution of the power flow of the real waveguide at 0.25 THz. ... 87
LIST OF SYMBOLS AND ACRONYMS
Permittivity
Permeability
ARROW Antiresonant reflecting optical waveguides As2Se3 Arsenic triselenide
BSA Bovine serum albumin
cfu Colony-forming unit
E. coli Escherichia coli bacteria
FTIR Fourier transform infrared spectroscopy FeF2 Iron(II) fluoride
GHz Gigahertz
MnF2 Manganese fluoride
PBS Phosphate buffered saline
PC Polycarbonate polymer
pfu Plaque-forming unit
PMMA Poly (methyl methacrylate) polymer
PSU Polysulfone polymer
PP Polypropylene
SPR Surface plasmon resonance
SRR Split-ring resonator
SEM Scanning electron microscope
THz Terahertz
INTRODUCTION
Invention of the terahertz time-domain spectroscopy (THz–TDS) in the early 1990’s opened a new chapter in terahertz science and simultaneously spawned numerous efforts to develop terahertz applications and tools. Terahertz (THz) radiation has big potential for such applications as biomedical sensing, noninvasive imaging and spectroscopy. More recently, much attention has been given to probing explosives and biological samples, which have unique terahertz spectral signatures. And efficient waveguide for THz radiation is a key element for many practical applications. Various designs of such waveguides have been already proposed. However, almost all materials are highly absorbent in the THz region making design of low loss waveguides very challenging. Even air might exhibit high absorption loss if the water vapor content in it is not controlled. In the same time a variety of THz components and devices based on THz metamaterials have been presented, including perfect absorbers, filters, polarizers, THz amplitude and phase modulators and etc. [1-3].
My thesis is dedicated to the fiber optics for guiding and molding of the THz and mid-IR radiation as well as for bio-sensing applications. And for the reader unfamiliar with the principles of THz-TDS, in the Introduction I would like to describe our experimental setup and procedure including basic methods of the THz generation and detection; data acquisition and interpretation; standard methods of the fiber loss characterization.
Terahertz Time-domain Spectroscopy
“Terahertz (THz) fields” is a generic term for waves with a spectrum between 0.1 and 10 THz. To get a better grasp of the frequency region we are referring to it is useful to mention that the frequency of 1 THz corresponds to a wavelength of 300 m or 0.3 mm and to a wavenumber of 33 cm-1. THz fields have wavelengths extending from 3 mm (0.1 THz or 100 GHz) up to 30 m (10 THz); this wavelength interval ranges between the top edge of the millimeter wave spectrum to the bottom edge of the optical spectrum corresponding to the boundary of the far-infrared spectral region.
In order to study transmission properties of the developed waveguides, we require a setup that can accurately measure the THz transmission spectrum of the waveguides of different length. While spectroscopy setups are generally designed to measure very thin samples, thus a
conventional setup must be adapted for the samples of variable length. Additionally special care must be taken to insure proper coupling of the THz light into and out of the waveguide. Our THz Time Domain Spectroscopy setup consists of a frequency-doubled femtosecond fiber laser (MenloSystems C−fiber laser) used as a pump source and of two identical GaAs dipole antennae used as an emitter and a detector, respectively, yielding a spectrum ranging from ~0.1 to 3 THz. Contrary to standard THz-TDS setups where the configuration of parabolic mirrors is static, our setup has mirrors mounted on the translation rails, shown at Fig. 1.1. This flexible geometry facilitates mirrors placement, allowing measurement of waveguides up to 45 cm in length without the need of realigning the setup.
Fig. 1.1. Pictures of the adaptable-path-length THz-TDS setup for measuring the transmission of THz waveguides a) at 0 cm length, in the absence of a waveguide, the mirror assembly is translated to the far left so that the focal points of the input and output parabolic mirrors are in focus; b) at maximum length of 45 cm. In our setup, waveguides up to 50 cm in length can be measured by simply translating the position of these two mirrors along the rail, as illustrated.
A femtosecond laser is used in order to provide synchronization and repeatability between the measurements. This laser produces a train of pulses at a repetition rate around 100 MHz and pulse lengths around 120 fs. The pulse train then is split into two with a beam splitter, with one half utilized in generating the THz signal used to probe the sample and the other half employed in
gating the detector. Because the radiation is coherent, electric field E t( ) can be measured directly, instead of just intensity I t( )I t( ) E t( )2
Fig. 1.2. a) The schematic diagram of a THz dipole photoconductive antenna, b) photograph of the chip with six antennas on it. It is based on low temperature-grown GaAs and optimized for the laser source at 780 nm emission wavelength with 120 fs pulse duration (which is used in our setup).
The schematic diagram of a dipole photoconductive antenna is shown at Fig. 1.2. The metal transmission lines are typically deposited on either a semi-insulating GaAs substrate or a low temperature-grown GaAs film on semi-insulating GaAs. The femtosecond laser pulse focused on the biased antenna gap (shown in the diagram) causes photogenerated electrons to rapidly traverse the gap, creating a transient photocurrent that produces a THz electromagnetic pulse. The change in current is extremely rapid so I t( )
J t
as given by Maxwell’s equations. Emitted THz radiation is then collected by the Silicon lens.When photoconductive antenna is used as a detector, a time-varying current in the photoconductive antenna is provided by the time-dependent electric field induced by the THz pulse. A part of the excitation laser pulse is delivered to the detector and together with incident THz wave creates photo-electrons. The measured current at the electrodes relative to the timing of the laser pulse reproduces the THz waveform in the time domain (schematic is shown at Fig. 1.3).
Fig. 1.3. a) Photoconductive antenna acting in the THz generation regime: photocarriers are accelerated by the voltage bias. b) Photoconductive antenna acting as a THz detector: photocurrent is proportional to ETHz( )t .
Fig. 1.4. The THz electric field is measured point-by-point in the time-domain (ETHz( )t ) using a
THz detector (photoconductive antenna). b) The Fourier transform of the time signal gives an amplitude ( ETHz( )f ) and phase (phase E THz( )f ) information. Presence of water vapor
All of the above can be summarized as follows. At the emitter, the optical pump beam stimulates THz pulsed radiation via charge transport. The diverging THz beam is collimated and focuses onto the sample by a Silicon lens and a pair of parabolic mirrors. After passing through the sample, the THz beam is re-collimated and focused onto the detector by an identical set of lenses and mirrors. At the detector, the initially divided probe beam optically gates the THz receiver with a short time duration compared with the arriving THz pulse duration. Synchronizing between the optical gating pulse and the THz pulse allows the coherent detection of the THz signal at a time instance. A complete temporal scan of the THz signal is enabled by the discrete micro-motion of a mechanical stage controlling the optical delay line.
THz-Time domain Spectroscopy setup is capable to provide both amplitude and phase information. Amplitude of the typical pulse (ETHz( )t ) generated by a pulsed broadband THz source is achieved through by point by point sampling of the electric field with a time resolved measurements and is illustrated in Fig. 1.4 a). In general during the transmission measurements amplitude yields information about the absorption of the sample whereas the phase gives information about its refractive index see Fig. 1.4 b).
Basic data analysis in THz spectroscopy
Fig. 1.5. Basic scheme of a THz-TDS transmission experiment: sample under study is a parallel plate with thickness d and complex refractive index n.
In a THz-TDS experiment one measures a signal that is proportional to the electric field of the THz pulse E t( ). To get the frequency information, a Fourier transform is applied:
1 ( ) ( ) 2 i t E e E t dt
, (1.1) Let us consider a typical spectroscopic experiment: usually two signals are measured, one for the pulse propagating through the sample and one as a reference pulse (Esam, E ). From these data it refis possible to extract information about the dielectric constant of the sample, usually absorption coefficient , and the real part of the refractive index nreal.
In the transmission spectroscopy, the sample is properly prepared with smooth surfaces and a well defined thickness. To analyze the data correctly, several assumptions about the geometry of the spectroscopic setup have to be made. First, when the THz pulse goes through the sample it undergoes reflections at the sample interfaces and gains a phase shift Psam. In the simplest case we consider only reflection and transmission at the first and the second interfaces. If we assume normal incidence and planar surfaces without scattering, we can use the well known expressions for the Fresnel equations. Further, we assume that the medium surrounding the sample is the dry air so we can set its complex refractive index equal to 1. Thus for the signal transmitted through the sample we obtain:
0 ( ) ( ) ( ) ( , ) ( ) sam as sam sa E E t P d t (1.2) with 2 1 ( ) as t n , (1.3) 2 ( ) 1 ( ) sa n t n , (1.4) where nnrealinim denotes the complex refractive index of the sample and d is the sample thickness. The phase shift accumulated by the pulse while crossing the sample is described by:
( , ) exp sam n d P d i c , (1.5)
For the reference pulse we have no reflections at the interfaces, only the phase shift accumulated during the propagation at distance d through the air:
0 0 ( ) ( ) ( , ) exp ref ref i d E E P d E c , (1.6)
If we make the quotient of Esam( ) and Eref( ) we get:
2
4 ( ) ( ) exp 1 ( ) 1 sam ref E n d H i n E n c , (1.7) This quantity is also called transfer function H( ) of the systemWe are interested in the absorption coefficient 2nim c and the real part of the refractive index nreal. Quantities available from the experiment are Esam( ) and Eref( ) . So we have to solve Equation (1.7) for nreal and nim. The ratio of the Fourier transforms is a complex number that we write as:
( ) ( ) exp ( ) ( ) sam ref E R i E , (1.8) At this point we have to introduce a further assumption to make an Equation (1.7) analytically solvable. For the calculation of the t -factors (Eq. 1.3, Eq. 1.4) we assume that the material has no absorption, i.e. nnreal, Equation (1.7) then simplifies to:
2
4 ( )
( ) 1
( ) exp ( ) exp 1 exp
( ) ( ( ) 1) 2 sam real real ref real n E d R i i n d E n c . (1.9)
Solving Equation (1.9) for nreal and we get:
( ) ( ) 1 real c n d , (1.10)
2 ( ) 1 2 2 ln 4 ( ) real im real n R n c d n , (1.11)In THz-TDS, we are also interested in measuring ( ) '( )i ''( ), i.e. the real and imaginary part of the permittivity. Hence, the real and the imaginary parts of the dielectric constant are determined from the following equations:
2 2 '( ) ( ) ( ) 2 c n , (1.12) ''( ) c n( ) ( ) , (1.13)Cutback method
A standard technique for measuring the fiber transmission loss is the cutback method [4]. Within this method a direct power transmission through the fibers of different lengths is measured. The input end of the fiber under test remains fixed during the procedure, and all the cuts are performed at the fiber output end. By plotting the transmission intensity versus the fiber length on a log-log plot, one can extract the fiber loss coefficient. The main advantage of this procedure is that it eliminates the need to estimate the input coupling efficiency into the waveguide. While being a very powerful method for measuring losses in telecommunication fibers, the standard cutback method must be modified to be applicable in the case of the short fibers exhibiting high losses.
Assuming single mode propagation, the equation governing the input and output electric fields of the fiber can be written in the frequency domain as:
2 1 2 ( ) ( ) exp exp 2 effout ref eff
L E E T T C i L , (1.14)
where, Eout( ) and Eref( ) are the complex electric fields at angular frequency on the entrance and exit ends of the fiber, respectively; T and 1 T2 are the total transmission coefficients that take into account the reflections at the entrance and exit faces, respectively; C is the coupling coefficient, which is the same for the entrance and exit faces; eff is the propagation constant of the fundamental mode; eff is the effective material loss that the propagating mode experiences; and L is the fiber length.
At least two different lengths of the fiber are required for calculating its THz properties
(
eff and eff ). Applying Equation (1. 14) to two different lengths (L and 1 L ), the transfer 2 function can be determined from the ratio of Eout1( ) and Eout2( ) which reads:
1 2 1 1 2 2 ( ) ( ) exp exp ( ) ( ) 2 eff out eff out L L E L L E , (1.15)The C , T and 1 T2 coefficients are cancelled, because the positions of the fiber and antenna do not change during the cut back measurement. Then eff and eff of the fiber are obtained from the amplitude and the phase of the transfer function. However, the cutback technique is a destructive method and is prone to errors due to variations in the cleave quality and realignment of the fiber output end.
SCIENTIFIC OUTCOMES OF MY DOCTORAL RESEARCH
Journal papers:
1. A. Mazhorova, A. Markov, B. Ung, M. Rozé, S. Gorgutsa, and M. Skorobogatiy,
“Thin chalcogenide capillaries as efficient waveguides from mid-IR to THz,” J. Opt. Soc. Am. B 29, 2116-2123 (2012).
http://www.opticsinfobase.org/josab/abstract.cfm?URI=josab-29-8-2116
2. A. Mazhorova, A. Markov, A. Ng, R. Chinnappan, O. Skorobogata, M. Zourob, and
M. Skorobogatiy, “Label-free bacteria detection using evanescent mode of a suspended core terahertz fiber,” Opt. Express 20, 5344-5355 (2012).
http://www.opticsinfobase.org/oe/abstract.cfm?URI=oe-20-5-5344
3. A. Mazhorova, J.-F. Gu, A. Dupuis, M. Peccianti, T. Ozaki, R. Morandotti,
H. Minamide, M. Tang, Y. Wang, H. Ito, M. Skorobogatiy, “Composite THz materials using aligned metallic and semiconductor microwires, experiments and interpretation”, Opt. Express 18, 24632-24647 (2010).
http://www.opticsinfobase.org/oe/abstract.cfm?URI=oe-18-24-24632
4. B. Ung, A. Mazhorova, A. Dupuis, M. Rozé, and M. Skorobogatiy, “Polymer microstructured optical fibers for terahertz wave guiding,” Opt. Express 19, 848-861 (2011). http://www.opticsinfobase.org/oe/abstract.cfm?URI=oe-19-26-B848 5. December issue OPN:
B. Ung, M. Rozé, A. Mazhorova, M. Walther and M. Skorobogatiy, “Suspended Core Subwavelength Plastic Fibers for THz Guidance,” Optics Photonics News, special December issue that highlights the most exciting peer-reviewed optics research to have emerged over the past 12 months, 41 (2011).
6. One of the Top 10 downloaded Optics Express articles in May 2011:
M. Roze, B. Ung, A. Mazhorova, M. Walther, M. Skorobogatiy, “Suspended core subwavelength fibers: towards practical designs for low-loss terahertz guidance,” Opt. Express 19, 9127-9138 (2011).
http://www.opticsinfobase.org/oe/abstract.cfm?URI=oe-19-10-9127
7. A. Dupuis, A. Mazhorova, F. Désévédavy, M. Rozé, and M. Skorobogatiy, “Spectral characterization of porous dielectric subwavelength THz fibers fabricated using a
microstructured molding technique,” Opt. Express 18, 13813-13828 (2010). http://www.opticsinfobase.org/oe/abstract.cfm?URI=oe-18-13-13813
Conference proceedings:
1. A. Mazhorova, A. Markov, B. Ung, M. Rozé, S. Gorgutsa, and M. Skorobogatiy “THz
wave guiding using hollow capillaries”, Photonics North, June 6-8 (2012)
2. A. Mazhorova, A. Markov, A. Ng, R. Chinnappan, M. Zourob, and M. Skorobogatiy,
“Label-free bacteria detection using evanescent mode of a suspended core terahertz fiber,” in CLEO: Science and Innovations, OSA Technical Digest (online) (Optical Society of America, 2012), paper CTu3B.6.
3. A. Mazhorova, M. Zourob, and M. Skorobogatiy, “Suspended core polyethylene fiber
for bio-sensing applications in the terahertz region,” in Optical Sensors, OSA Technical Digest (CD) (Optical Society of America, 2011), paper STuC3.
4. Invited Talk: M. Skorobogatiy, B. Ung, A. Mazhorova, M. Rozé, A. Dupuis, “Plastic fibers for terahertz wave guiding,” ECOC 2011, Tu.6.LeCervin.1, Geneva, Switzerland, September 18-22, 2011.
5. B. Ung, M. Rozé, A. Mazhorova, M. Walther, and M. Skorobogatiy, “Suspended core subwavelength fibers for practical low-loss terahertz guidance,” in Optical Sensors, OSA Technical Digest (CD) (Optical Society of America, 2011), paper STuC2.
6. A. Mazhorova, J.F. Gu, S. Gorgutsa, M. Peccianti, T. Ozaki, R. Morandotti, M. Tang,
H. Minamide, H. Ito, M. Skorobogatiy, “THz metamaterials using aligned metallic or semiconductor nanowires,” We-P.31, Proceedings of IEEE34th International Conference on Infrared, Millimeter, and Terahertz Waves, IRMMW-THz 2010
7. A. Dupuis, A. Mazhorova, F. Desevedavy, M. Skorobogatiy, “Loss and Spectral Measurements of Porous and Non-Porous Subwavelength THz Fibers,” JWA117, CLEO (2010)
Award
June 2012 award winner of the “Étudiantschercheurs étoiles” (Fonds de Recherche du Quebec, Nature et Technologies) competition with paper entitled “Label-free bacteria detection using evanescent mode of a suspended core terahertz fiber”.
CHAPTER 1
MOTIVATION AND OBJECTIVES OF MY RESEARCH
1.1 Motivation and objectives of my research
The THz spectral range is extremely promising for a large number of possible applications, and is one of the less explored and exploited region of the electromagnetic spectrum, referring to electromagnetic waves with frequencies between 100 GHz and 10 THz, or wavelengths between 3 mm and 30 μm, i.e. in the gap between the realms of electronics and photonics. Much of the motivation to advance THz science and technology could be explained by the unique characteristics of THz radiation.
From the fundamental point of view this is the highest electromagnetic frequency at which the electric field vector and its time dynamics could be measured directly. It allows, for example, determining the complex refractive index of the sample without performing the Kramers-Kronig analysis, which is usually employed for mid-infrared spectroscopy and requires two independent measurements.
At the same time, THz radiation is very beneficial for the practical applications as it is non-ionizing one and most dry materials are transparent to few cm in depth. So that THz pulses have the ability to pass through such materials as clothing, foods and packing. Plus the THz region is also rich with vibrational signatures, enabling chemical sensing of illicit materials such as explosives and narcotics, thus offering a considerable potential for material characterization, biological sensing, security scanning, quality control.
Still there are some challenges that limit real-life implementation of the THz spectroscopy. First of all, THz emission systems are still bulk, as they consist of free-space optics together with a large nitrogen purged cage, that is needed to minimize the effects of absorption from the ambient water vapor (as an example, photograph of our THz-TDS setup is shown in Fig. 1.6). And in general such systems are very inconvenient to work with, especially in applications that require scanning, as the user has to bring the sample into the nitrogen purged cage, or even modify the whole system depending on the requirements (size of the sample, its dimensions). In response to this challenge we propose our solution: THz fibers designed for flexible delivery of THz light.
Fig. 1.6. Photograph of the THz Time Domain Spectroscopy setup built in our group.
Second, almost all materials are highly absorbing in the THz spectral range. For example, standard bulk material loss for Polyethylene is 0.2 cm-1, which means that one can transmit only 10% and only up to ~23 cm with a solid core fiber made from Polyethylene. The same is valid for most plastics. Therefore using of solid core fibers is out of the question. Thus, our solution is development of the hollow and porous core fibers, where THz light is guided mostly in the low-loss gas, filling the waveguide.
Metamaterials and frequency selective surfaces attract constant significant attention as they allow designing materials with desirable optical properties, such as refractive index and permittivity that can be used for fabrication of the optical components for guiding and molding of the THz and mid-IR radiation, for example, wire-grid polarizers. However fabrication of 3D THz metamaterials is still quite challenging and labor-intense. Present-day fabrication methods typically involve fabrication of 2D metamaterials layers by the means of lithography, these layers are then stacked to the 3D multilayer structures. As a solution we propose fiber based metal-containing structures.
At a glance it may look like we deal with several completely different questions. However the unifying factor is the usage of fiber drawing techniques to find a fiber-based solution.
1.2 Origins and main project results
I’ve joined the Complex Photonic Structures and Processes group in 2009. At that time we have already presented subwavelength fiber with a porous core and had already performed theoretical simulations. My goal was in general not only to be able to fabricate such fibers and improve fabrication techniques, but rather to find possible applications of them.
Our original theoretical investigations have predicted that addition of an array of subwavelength holes into the crossection of a subwavelength fiber increases the fraction of power guided in the air, thus leading to a lower absorption loss [5-7]. The idea of adding holes into a subwavelength fiber was inspired by the earlier work of Nagel et al. [8]. The authors have demonstrated that addition of a single subwavelength hole into the center of the solid core can result in strong field confinement inside this hole. However, in their case diameter of the waveguide was comparable to the wavelength, and the central hole was very small. In contrast with our waveguide that features much smaller, comparing to the THz wavelength, fiber diameter along with big holes. In our case addition of several holes within the subwavelength fiber reduces the fiber absorption loss by forcing a greater portion of the radiation to guide in the dry low-loss gas filling the porous fiber core. Exploring this approach we were later able to make a waveguide with the subwavelength (150 m) fiber core suspended on the thin bridges in the middle of large protective tube [9]. Such waveguide design provides several important advantages for bio-sensing applications. First, the waveguide structure allows direct and convenient access to the fiber core and to the evanescent wave guided around it. Second, the outer cladding effectively isolates the core-guided mode from the surrounding environment, (e.g. fiber holders), thereby preventing the undesirable external perturbations of the terahertz signal. Overall we have found that described waveguide is very well suited for biosensing applications.
At the same time we started to work on fibers with incorporated metal or semiconductor wires. As it was already mentioned, fabrication of 3D metamaterials is still challenging [10]. 2D metamaterials are typically fabricated by the means of lithography direct writing, or two-photon polymerization however all these techniques are only suitable for relatively small shapes of 1-2
m [11]. Thus for the fabrication of 3D metamaterials the only choice is 3D printing or stereolithography, still the resolution of this method is about ±20 m in XY plane and ±50 m in Z-direction [12]. In our group we had investigated a new approach of co-drawing the metal wires
of low melting temperature alloys together with polymers into microstructured fibers that are then pressed into composite films. A process for the production of fine metal wire directly from the melt was first reported by Taylor in 1924 [13]. In this technique, which is called Taylor-wire or microwire process, the metal to be drawn is contained in a glass tube with the one end closed. Then this end is melted, softened and drawn into glass cladded microwire.
And recently we had an industrial collaboration with fiber manufacturer CorActive Inc. (Québec) within the CRD grant. During this collaboration we have fabricated the As2Se3 chalcogenide glass capillaries with different wall thickness in the range from 12 µm to 130 µm by double crucible glass drawing technique. Produced capillaries were extensively studied in the broad spectral range from mid-IR to THz and we found that to act as efficient waveguides.
According to the three main research objectives, during my PhD studies I was mainly working on the three general types of fibers presented above. Each fiber concept resulted in the practical application as a solution to the currently existing challenges in THz research domain and is described in details in corresponding section of the current thesis.
1.3 Structure of the thesis
This thesis is organized as follows:
Chapter 2 provides a literature review of the modern metamaterials and their applications in the THz spectral range, including basics of the metamaterial operation principles, description of their fabrication techniques, and characterization of their optical properties. Chapter 2.2 provides a literature review of the different methods for highly sensitive chemical and biological detection in the THz operation range. In Chapter 2.3, I review recent studies of the transmission characteristics of the hollow-core waveguides with resonant dielectric reflectors in the form of capillaries. In what follows we call such waveguides pipe waveguides.
Chapter 3 represents my first paper “Composite THz materials using aligned metallic and semiconductor microwires, experiments and interpretation” published in Opt. Express in 2010. This paper is devoted to the experimental and theoretical work concerning THz composite films and includes detailed description of the fabrication and characterization techniques.
Chapter 4 represents my second paper “Label-free bacteria detection using evanescent mode of a suspended core terahertz fiber,” also published in Opt. Express in 2012. In this chapter
I present the results on the development of the E. coli bacteria sensor based on the evanescent field of the fundamental mode of a suspended-core terahertz fiber.
Chapter 5 represents my third paper “Thin chalcogenide capillaries as efficient waveguides from mid-IR to THz,” published in the J. Opt. Soc. Am. B in 2012. It is devoted to the investigation of low-loss chalcogenide capillary-based waveguides in mid-IR and THz spectral regions.
Finally, general discussion of the achieved results and future research perspectives are presented.