HAL Id: hal-02116744
https://hal.archives-ouvertes.fr/hal-02116744
Submitted on 1 May 2019
HAL is a multi-disciplinary open access
archive for the deposit and dissemination of
sci-entific research documents, whether they are
pub-lished or not. The documents may come from
teaching and research institutions in France or
abroad, or from public or private research centers.
L’archive ouverte pluridisciplinaire HAL, est
destinée au dépôt et à la diffusion de documents
scientifiques de niveau recherche, publiés ou non,
émanant des établissements d’enseignement et de
recherche français ou étrangers, des laboratoires
publics ou privés.
Photoluminescence properties of silicon nanocrystals as
a function of their size
Gilles Ledoux, O. Guillois, D. Porterat, C. Reynaud, F. Huisken, B. Kohn, V
Paillard
To cite this version:
Gilles Ledoux, O. Guillois, D. Porterat, C. Reynaud, F. Huisken, et al.. Photoluminescence properties
of silicon nanocrystals as a function of their size. Physical Review B: Condensed Matter and Materials
Physics (1998-2015), American Physical Society, 2000. �hal-02116744�
Photoluminescence properties of silicon nanocrystals as a function of their size
G. Ledoux,*O. Guillois, D. Porterat, and C. Reynaud
Service des Photons Atomes et Mole´cules, CEA Saclay, F-91191 Gif/Yvette Cedex, France
F. Huisken and B. Kohn
Max-Planck-Institut fu¨r Stro¨mungsforschung, Bunsenstrasse 10, D-37073 Go¨ttingen, Germany
V. Paillard
Laboratoire de Physique des Solides, Universite´ Paul Sabatier et CNRS (UMR 5477), 118 route de Narbonne, F-31062 Toulouse Cedex 4, France
共Received 19 April 2000兲
We present results on the photoluminescence共PL兲 properties of silicon nanocrystals as a function of their size. The nanocrystals are synthesized by laser pyrolysis of silane in a gas flow reactor and deposited at low energy on a substrate after a mechanical velocity and size selection. Both the photoluminescence spectroscopy and yield have been studied as well as the effect of aging of the samples in air. The measurements show that the PL of the silicon nanocrystallites follows the quantum confinement model very closely. The apparent PL yields are rather high共up to 18%兲. From evaluation of the size distribution obtained by atomic force micros-copy it is concluded that the intrinsic PL yield of the nanocrystals can reach almost 100%. These results enabled us to develop a simple theoretical model to describe the PL of silicon nanocrystals. This model can also explain the changes of PL with aging of the sample, just by invoking a decrease of the size of the crystalline core as a result of oxidation.
I. INTRODUCTION
The study of silicon nanostructures is a very active field of research because of the strong room-temperature photolu-minescence 共PL兲 and the observation of quantum size ef-fects. A bright red PL was first observed for porous Si.1 It was explained by a widening of the band gap as a result of quantum confinement, thus shifting the PL into the visible for crystallite sizes below 5 nm共for a review, see Refs. 2 and 3兲. The small volume of these nanocrystals is also respon-sible for efficient radiative recombination4,5since the spatial confinement by potential barriers prevents the diffusion of carriers to nonradiative recombination centers. This quantum confinement model for porous silicon is usually accepted, although the details of the recombination mechanism are still under debate.6
On the experimental side, the limitation comes from the difficulty of deriving a correct size distribution of the Si nanocrystals present in porous silicon.7–9Thus, it is difficult to assess the validity of the quantum confinement model. Several different techniques are under development to pro-duce Si nanostructures with control of the nanocrystal size: high-dose Si implantation in SiO2,10,11sputter deposition,12
laser ablation,13,14 and plasma-enhanced chemical vapor deposition of substoichiometric silicon oxide.15
Another elegant solution is to use the low-energy cluster beam deposition共LECBD兲 method.16Thanks to the improve-ments made in the field of cluster beams, it is now possible to deposit covalently bound clusters on a substrate while they retain their gas phase properties. Nanoscale silicon clusters can be produced in the gas phase and their size distribution can be measured.17 So the size distributions determined by time-of-flight mass spectrometry can in principle be
con-served on the substrate and the photoluminescence properties can be determined as a function of the size of the Si nano-crystallites.
Recently, it has been proved that CO2 laser pyrolysis of
silane is a versatile source for silicon clusters and nanocrystals17 that is particularly well adapted to the forma-tion of Si nanocrystals 共nc-Si兲 with sizes in the range of a few nanometers, where the PL properties are known to be optimal. In the supersonic beam extracted from this source, the velocities of the clusters are size dependent.18 Conse-quently, a mechanical selection with a time-of-flight chopper can be used to produce a low-energy beam of size-selected neutral silicon clusters. The elaboration of this technique rep-resents a major breakthrough in preparing a cluster model system, well controllable and reproducible. Thus, well-defined thin films of size-selected nc-Si can be formed on a substrate by LECBD.
It has been shown previously that such deposits of Si nanoclusters exhibit strong photoluminescence in the red when their sizes are in the range between 3 and 5 nm,17and that the PL energy shifts to larger wavelengths when the mean size increases. We present here an extended study of the size effects on the PL properties of such films, with the aim of addressing the issue of quantum confinement as an explanation for the PL characteristics of silicon nanostruc-tures. We have studied several samples with varying mean size and size distribution. The samples were characterized by different techniques including infrared spectroscopy and atomic force microscopy 共AFM兲. We also studied the effect of aging of the samples in context with their progressive oxidation in ambient air.
Our primary objective was to understand an astrophysical spectroscopic feature, named extended red emission 共ERE兲
PHYSICAL REVIEW B VOLUME 62, NUMBER 23 15 DECEMBER 2000-I
PRB 62
and attributed to the photoluminescence of an interstellar dust component. It manifests itself in a 120–190 nm broad emission band, with a maximum occurring at wavelengths between 600 and 850 nm depending on the source observed, and a high photon conversion efficiency19共⭓10%兲. We have found a striking analogy between the PL behavior of silicon nanocrystals and the characteristics observed for the ERE bands.20 To back up this model and to make comparisons with astronomical observations we have to know the PL spectrum of such nanoparticles as a function of their size as well as their absolute PL efficiencies. The quantum yield of the PL of Si nanocrystals is larger by several orders of mag-nitude than that of bulk silicon. So, starting from nc-Si, it is expected that the PL yield will decrease when one goes to larger sizes. On the other hand, the very small particles are expected to be less efficient due to the increasing role of the surface; but these size effects are not well known. In spite of the difficulties inherent in absolute yield measurements, we have paid particular attention to the experimental setup, in order to measure the quantum yield as precisely as possible, to determine the range of sizes where the yield is the highest, and to study its variation on either side. As will be discussed in another publication,21 the results presented here allow us to successfully model the ERE observations made in differ-ent astrophysical environmdiffer-ents. Moreover, they give us valu-able insight into the fundamental process of the photolumi-nescence of Si nanocrystals, which will be the subject of this paper.
The paper is organized as follows. In Sec. II we present the techniques applied to produce the films and to determine their size distributions and describe the apparatus used to carry out the PL and quantum yield measurements. Section III will be devoted to the presentation of the results obtained on the PL spectroscopy, the PL quantum yield, and the effect of sample aging on the PL properties. In the last section we will discuss the results in the framework of the quantum confinement model.
II. EXPERIMENT
The samples studied in this work were synthesized at the Max-Planck-Institut fu¨r Stro¨mungsforschung employing CO2
laser pyrolysis of silane in a gas flow reactor. Since a com-plete description of the apparatus has been presented
earlier18,22,23 only the general principles of the experiment will be recalled here. A conical nozzle is placed near the pyrolysis ‘‘flame’’ and extracts the clusters and nanoparticles from the flow reactor. They are skimmed into a low-pressure vacuum chamber and form a ‘‘molecular beam’’ of noninter-acting clusters. In this molecular beam, the cluster velocity is mass dependent; the smaller the particles, the faster they are. Therefore, thanks to a rotating chopper synchronized with the pulsed pyrolysis laser, the size distribution of the clusters can be significantly narrowed. The clusters are then depos-ited on a substrate for further studies. The translational en-ergy of the clusters is rather low 共less than 0.4 eV per atom for a 4 nm particle, corresponding to roughly 10% of the binding energy兲 so that we are working under the conditions of LECBD where the deposition does not alter the properties of the gas phase clusters.16
The size distribution of the clusters is determined in situ by time-of-flight mass spectrometry 共TOFMS兲. Without fur-ther size selection, the typical size distributions are log-normal with average sizes varying from 3 to 6 nm 共depend-ing on the conditions in the flow reactor兲 and a full width at half maximum 共FWHM兲 of around 2 nm. The chopper al-lows one to obtain size distributions as narrow as 0.6 nm
共FWHM兲 and with a most probable size between 2.8 and 7
nm. The characteristics of the two sets of samples studied here are summarized in Table I. For all samples, we used a 1 mm slit in the chopper disk that was rotated at a frequency of 400 Hz, except for sample A where a 3 mm slit and a lower frequency 共200 Hz兲 were used, in order to obtain a broader distribution. The beam of nanoclusters was shaped by a 1-mm-wide and 10-mm-high aperture before the particles were deposited on the substrate. Two sets of samples were prepared. The first one 共samples A–E兲 was deposited on a KBr substrate while the second one 共samples K–N兲, which was synthesized and characterized later, was deposited on fused quartz substrates. There does not seem to be any influ-ence of the substrate on the PL properties since the clusters are loosely bonded to it.
Because a precise knowledge of the size distribution of the deposited clusters is required, we have made every effort to control it. In the size-selective mode, the beam fluence is rather low and the deposition times are typically in the range of several hours. Therefore, regular control of the TOF dis-tribution is performed during the deposition.
TABLE I. Characteristic parameters and PL properties of the different nc-Si samples studied. Sample identifier Average size共nm兲 Width of size distribution共nm兲 PL maximum 共nm兲 PL maximum 共eV兲 PL width 共nm兲 Measured efficiency共%兲 Corrected efficiency共%兲 A 3.44 1.02 680 1.82 190 9 105 B 3.46 0.63 610 2.03 165 2 17 C 3.88 0.61 710 1.75 155 15 109 D 4.05 0.62 750 1.65 150 ⭓6 ⭓39 E 4.45 0.78 800 1.55 145 18 102 K 2.8 0.86 635 1.95 115 ⭓1 ⭓3 L 3.2 1.08 725 1.71 145 8 95 M 3.6 1.16 ⬃860a ⬃1.44a ⬃170a ⬃10a ⬃100 N 4.8 1.16 ⭓900a ⭐1.35a ⬃200a ⬃0.25a ⬃1
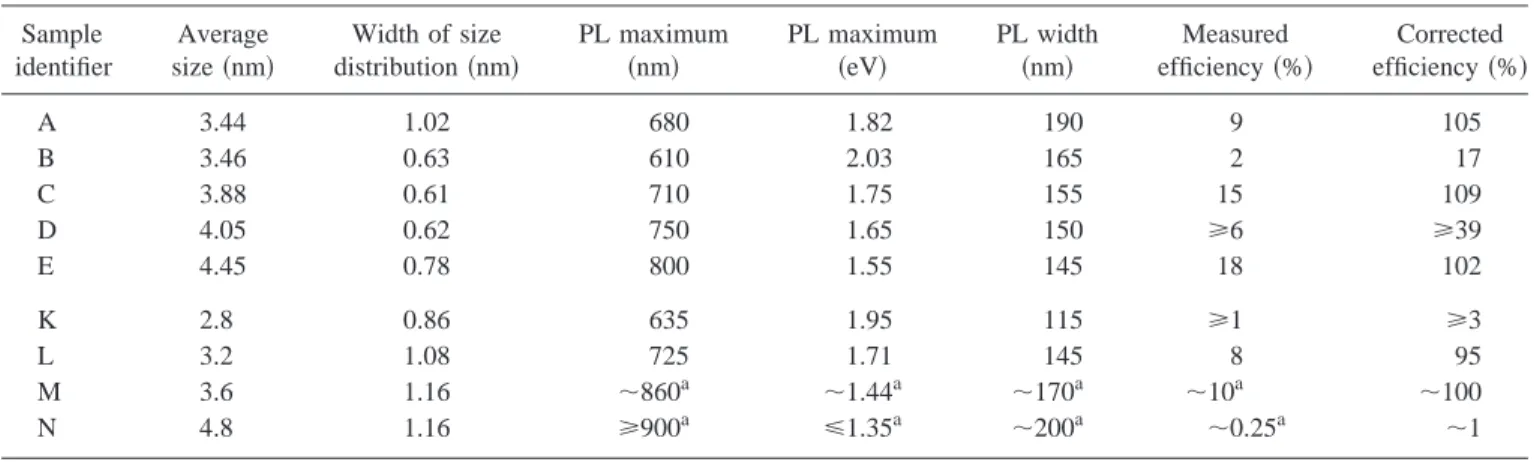
For the second set of samples, additional studies by atomic force microscopy allowed an ex situ analysis of the size distribution. For this purpose, short deposits 共10 s to 1 min兲 on mica substrates were performed, and AFM images were recorded in the tapping mode. Homogeneously distrib-uted spherical nanoparticles without any agglomeration are apparent on these AFM images, a typical example of which is shown in Fig. 1. A simple numerical analysis, evaluating the height of the nanoparticles, allows the determination of their size distribution. The result of this analysis is shown in Fig. 1 together with the size distribution measured by TOFMS during the preparation of the sample. The good overall agreement with the TOFMS measurement confirms the absence of any modification induced by the deposition. However, some differences between the AFM and TOFMS measurements are also clearly seen: the AFM size distribu-tion seems broader and the AFM image shows a few larger particles between 7 and 30 nm which are not observed in the TOFMS measurement. The larger width of the AFM size distribution is probably due to the difficulty of the AFM image analysis because the substrate is not perfectly planar. The absence of the larger particles in the TOFMS distribu-tion can be explained by the fact that the corresponding masses, ranging from 106 to 107amu, are too high to be detected by the channel plates. These big particles probably come from the unchopped part of the beam or they are ema-nating from the flow reactor and passing through the chopper slit at a later time. We have checked the first point by im-proving the shielding so as to prevent nonchopped particles from reaching the substrate, and indeed the number of big particles decreased drastically共by a factor of 5兲. In the fol-lowing, only sample K was prepared in this ‘‘protected’’ mode; all other samples contain a certain quantity of par-ticles bigger than 10 nm, representing at most 10% of the total number of particles. As will be seen below, these big particles can play an important role in the PL yield of the samples, and we will be led to correct our results with re-spect to their presence.
Other deposits on holey carbon foil have been checked by high-resolution transmission electron microscopy
共HRTEM兲.24With this technique, the particles appear as pure
crystalline silicon cores surrounded by an amorphous layer. This layer is most probably made of SiOx since, in infrared
spectra, the Si-O band at 1080 cm⫺1is very strong.25,26It has also been shown that the thickness of the amorphous layer increases with increasing size of the particles, always repre-senting approximately 10% of the total diameter.24 The lat-tice parameter also changes with the size of the nanopar-ticles, resulting in a small contraction for clusters larger than 3.3 nm or a small dilatation for smaller particles.24 The lat-tice parameter varies by 4% in the size regime between 2 and 25 nm, and for a given size there is a dispersion of the lattice parameter of about 2%.
In order to determine both the PL spectroscopy and the quantum yield of our nc-Si samples, a dedicated experimen-tal setup has been built at the CEA in Saclay. The fourth harmonic共266 nm兲 of a Nd:YAG 共yttrium aluminum garnet兲 laser is used as the exciting source. The beam is first filtered by a set of UG11 filters to eliminate the second harmonic
共532 nm兲 and the fundamental. A beam splitter reflects part
of the beam 共⬃8%兲 to a control diode which monitors the variations of the incident power. The laser beam is focused by a lens of 300 mm focal length to a spot of 1 mm diameter on the sample, which is placed under vacuum ( p
⭐10⫺6mbar). The PL is detected by a simple optical setup made of a lens, a monochromator, and a photomultiplier. The lens is fixed in a 2 f /2 f configuration with respect to the sample and the entrance slit共2 mm wide兲 of the monochro-mator. The entire image of the laser spot on the sample 共1 mm diameter兲 is directed into the monochromator. A mea-surement of the transmission of the laser radiation at 266 nm by the samples is systematically performed by mounting the sample in front of the photodiode.
The absolute response of the detection system was deter-mined by means of a tungsten ribbon lamp so that all mea-surements could be corrected for the wavelength-dependent detection efficiency as well as for the detectivity of the apparatus.27This calibration was confirmed by measuring the PL of a standard sample, namely, rhodamine 6G dye diluted in ethanol, which is known to have a PL yield of 95%.28,29 Samples of independently well-characterized30 porous Si were used for a cross check. The calibration was regularly checked using these PL standards.
In order to avoid nonlinear effects,31–34 all PL measure-ments were made at very low incident laser energy共less than 1J/cm2兲. Additional experiments at higher fluence that will be reported elsewhere35have shown that, below this fluence, nonlinear effects are absent. However, it should be noted that the use of such low laser intensity in combination with very thin films makes the PL spectra sometimes very noisy, in spite of the high PL yields of the samples.
III. RESULTS
A. Photoluminescence spectroscopy
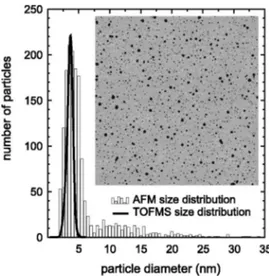
Figures 2 and 3 report the PL spectra of the different samples studied together with their size distributions as mea-sured by TOFMS. The maximum positions and the band-widths are reported in Table I. It is noted that the PL is strongly dependent on the size distribution. The PL peak shifts to the blue when the average size of the nanoparticles
FIG. 1. Size distribution derived from a 6⫻6m2AFM image
共in the inset兲 compared with the size distribution measured by TOFMS during sample preparation.
becomes smaller. A change of the average size from 4.8 nm
共sample N兲 to 2.8 nm 共sample K兲 results in a shift of the peak
wavelength from a value above 900 to 610 nm. The PL spec-tra have almost Gaussian profiles with a width varying from 115 to almost 200 nm. Broader PL spectra were found for deposits where the size distribution was also broader
共samples A and L兲.
In Fig. 4 we report PL spectra taken from a single sample
共sample A兲 but at different lateral positions in the x direction.
It appears that the PL is shifted continuously with the dis-placement of the analyzed position. This phenomenon is ob-served for all samples but it is most pronounced for this sample because the chopper was operated at a lower fre-quency 共200 Hz兲 and the disk had a larger slit 共3 mm兲. The small sketch given in the inset of Fig. 4 illustrates how the size selection may lead to an inhomogeneous size distribu-tion within a given sample. The transmission funcdistribu-tion of our chopper with 3 mm slit running at 200 Hz and a 1-mm-wide aperture behind the rotating disk is an isosceles trapezoid with a basis of 58s, while the time needed to open or close the 1-mm-wide slit aperture is 14.5s. As long as the slit is fully open, the particles will be deposited homogeneously on the substrate as far as the particle size is concerned. During the preparation of sample A, the delay between chopper and CO2laser was such that the chopper just began to close the
aperture when the first particles of the cluster pulse arrived. Therefore, while the slit was closed by the clockwise-rotating chopper disk, continually larger particles were
de-posited on a continually narrower strip located at the right edge of the deposited film. Whereas the smaller particles are found on the entire film, the larger nanoparticles are encoun-tered only on the right side as is illustrated in the inset of Fig. 4. Therefore, going along the sample from left to right, we expect a shift of the PL curves from smaller to larger wave-lengths, which is exactly what we observe. It follows that the variation of the PL as a function of the position on the sample can be attributed to the size effect. This point will be discussed in more detail in Sec. IV. We have also studied the PL as a function of the y position on the sample. By moving over 5 mm we see a displacement of less than 20 nm of the PL peak. This has to be compared to the almost 100 nm displacement of the peak in the x direction for a displace-ment of 1 mm. At the same time the intensity varies by less than a factor of 2. This indicates that, in the y direction, the film is homogeneous.
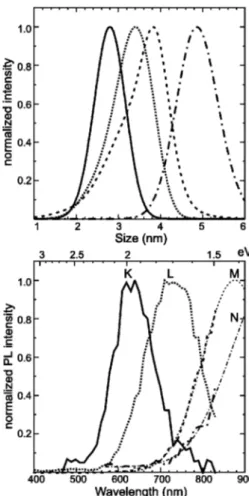
Figure 5 presents three PL spectra measured at different excitation wavelengths on a commercial Jobin-Yvon spec-trofluorimeter. These measurements were obtained for an older sample characterized by an average particle size of 3.92 nm.17 With increasing excitation wavelength, the posi-tion of the maximum of PL remains unchanged whereas the intensity drops significantly. The lower part of the figure shows the excitation spectrum measured at the PL peak wavelength共740 nm兲. For comparison, this is drawn together with the absorption spectra of two samples of porous silicon
FIG. 2. Size distributions as determined by TOFMS 共upper
panel兲 and normalized photoluminescence spectra 共lower panel兲 for the first set of samples studied.
FIG. 3. Size distributions as determined by TOFMS 共upper
panel兲 and normalized photoluminescence spectra 共lower panel兲 for the second set of samples studied. For samples M and N the Gauss-ian fits have been included共thin lines兲.
taken from the literature.36 Note the very similar spectral behavior between absorption and excitation curves.
B. Photoluminescence efficiency
Photoluminescence yields have been measured for all samples. They were determined according to the calibration procedure described in Sec. II. Integration of the calibrated PL signal is performed over the entire wavelength range where PL occurs. For the samples M and N, for which only a limited part of the PL peak could be recorded, the integra-tion is made using the Gaussian fit, and thus the yield values must be used carefully. The results are then related to the number of absorbed UV photons deduced from the absor-bance measurement of each sample at 266 nm. This gives the apparent PL yields reported in the seventh column of Table I. It should be emphasized that the values must be considered as rather high, ranging from 0.25% to 18%. For two samples
共D and K兲 the films were so thin that the absorption was too
low to be accurately determined. Thus, the values reported for these samples represent only a lower limit.
As explained in Sec. II, AFM analysis of our deposits revealed that about 10% of the particles present on the samples were larger than 10 nm. These big particles do not contribute to the PL 共at least not in this wavelength range兲; but they absorb a substantial portion of the exciting light since their cross section can be a hundred times larger, for it varies with the cube of the radius. Using the AFM results, we have estimated their contribution to the measured absorbance of the samples. Subtracting this large-particle contribution, we obtain lower absorbance and, consequently, higher yields. The corrected yield values are reported in the last column of Table I.
The highest PL efficiencies, reaching nearly 100%, are observed for samples with nanoparticle sizes in the range between 3.2 and 4.5 nm. For sample N (d⫽4.8 nm) the yield decreases to 1%. Although this value has been determined using the Gaussian fit, we believe that the possible error
cannot correspond to two orders of magnitude. For the small-est cluster size 共sample K兲, the results are also problematic since the absorption could not be accurately determined. Fi-nally, sample B has a peculiar behavior that will be discussed in more detail in Sec. IV.
C. Aging effects
When the silicon nanoparticles are taken out of the syn-thesis apparatus they do not immediately show photolumi-nescence upon illumination with a UV lamp emitting at 256 nm; at least the PL is not observed with the naked eye. It takes from a few hours to a few days until the luminescence becomes clearly visible. This effect is correlated with the progressive oxidation of the surface, leading to the passiva-tion of the dangling bonds that are expected to play the role of nonradiative recombination centers. Indeed, it has been shown in a previous publication26 that the IR bands associ-ated with Si-O bonds increase with time for these samples. The first set of samples was checked just after preparation in another PL experiment carried out in Toulouse, then after approximately one month in Saclay, and finally eight months after preparation again in Toulouse. Table II reports the maxima of the PL curves for these different experiments. In Fig. 6 we display the PL spectra measured in Toulouse for two samples共B and D兲 of the first series as well as the results obtained in Saclay for two samples 共K and L兲 of the second series, just after preparation and two months later. Both Table II and Fig. 6 clearly reveal that, with time, the PL
FIG. 4. Photoluminescence spectra obtained at different x posi-tions on sample A. Going from the left to the right, the PL curves shift to larger wavelengths. Their peak positions are indicated above the curves. The sketch on the left illustrates the fact that a clockwise-rotating chopper produces a film with larger particles concentrated on the right-hand side of the deposit.
FIG. 5. Top panel: PL spectra obtained for different excitation wavelengths. The small structures appearing at 700, 840, and from 890 to 1000 nm are badly filtered lines of the Xe lamp used for these measurements. Bottom panel: Excitation spectrum of a sample of Si nanoparticles in comparison with the absorption spec-tra of two porous silicon samples共Ref. 36兲.
shifts systematically to the blue. Depending on the sample and the aging, this blueshift amounts to 30–60 nm. The samples of the first series were checked again after 18 months and essentially the same results were obtained as after eight months, i.e., no further shift was observed.
IV. DISCUSSION
In this section, we will discuss the experimental results in terms of size effects in the framework of the quantum con-finement model. In this theory, the PL energy is blueshifted with respect to the band gap of bulk silicon (E0⫽1.17 eV)
and obeys a power law with an exponent equal to⫺1.39 for the particle diameter d measured in nanometers:37
EPL共d兲⫽E0⫹
3.73
d1.39. 共1兲
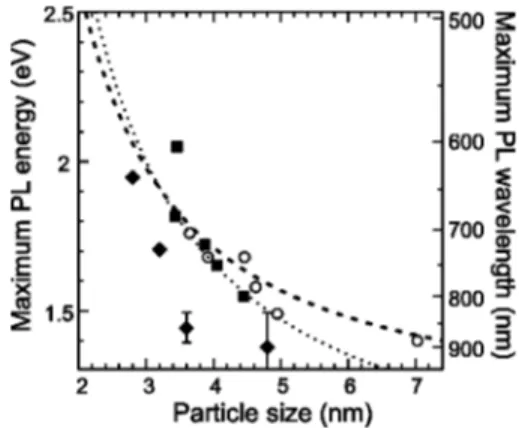
In Fig. 7, the peak energies of the measured PL spectra are plotted as a function of the most probable particle size and compared with the theoretical calculations of the exciton en-ergy by Delerue, Allan, and Lannoo.37It is clearly seen that the experimental results follow the general trend of the the-oretical law. The scatter of the experimental data could origi-nate from the following effects.
共i兲 Only the most probable size of the particles has been
considered here. The particles have a size distribution共with a full width at half maximum between 0.6 and 1.2 nm兲 that
should be taken into account because the absorbance in-creases with increasing size. Consideration of this effect is expected to shift the data points to larger sizes.
共ii兲 The sensitivity of the TOFMS is not really constant,
and in particular, it decreases for larger particles. As has been noted before, very large particles are not detected by the TOFMS. A correction according to this effect should also slightly shift the experimental data points to larger diameters.
共iii兲 The samples were checked for PL after different
pe-riods of time after the deposition. As has been reported above, due to progressive oxidation, the PL shifts with time to the blue. To correct for this effect, the data points should be shifted to smaller diameters for the older samples.
共iv兲 It has been shown by Hofmeister, Huisken, and
Kohn24that the lattice parameter of the crystalline core of Si nanoparticles depends on the nature and structure of the sur-face layer which, in turn, is a function of the particle size. In contrast, the calculations of Delerue, Allan, and Lannoo37are based on the lattice parameter of bulk silicon.
In the following we would like to give a rough estimation of the lattice effect. According to Hofmeister, Huisken, and Kohn,24 the change of spacing of the 兵111其 lattice plane fringes with respect to the bulk value (d兵111其⫽0.3134 nm)
can be written
⌬d兵111其⫽
0.023
d ⫺0.0064 共nm兲, 共2兲
where d is the size of the crystalline core in nanometers. Studies of the PL of porous silicon under high pressure38 show a shift of the PL to the red with increasing pressure. In these experiments, the PL varies with pressure in a roughly linear relationship with a proportionality factor f⫽4
⫻10⫺2eV/GPa. Then from the compressibility of Si 关
⫽0.01 GPa⫺1 共Ref. 39兲兴, we can derive the expected dis-placement⌬E of the PL energy as a function of the change in lattice parameter⌬a/a, which is equal to ⌬d兵111其/d兵111其:
⌬E⫽f 3⌬a
a . 共3兲
TABLE II. Evolution of the PL peak position共in eV兲 with time as measured for the five samples of the first series. The last line gives the estimated proportion of the oxide thickness compared to the total size of the oxidized particle as observed in the final stage 共see Sec. IV兲.
Sample A B C D E
Shortly after production 1.74 1.84 1.74 1.62 1.55 2–5 months after preparation 1.82 2.03 1.75 1.65 1.55 8 months after preparation 1.88 2.03 1.83 1.73 1.73
Derived oxide thickness共%兲 11 12 8 11 16
FIG. 6. PL spectra for four nanocrystalline Si samples共B, D, K, and L兲 measured shortly after production 共dotted curves兲 and eight months共samples B and D兲 or two months 共samples K and L兲 later
共solid curves兲. For sample K, we have plotted the fit results instead
of the original data.
FIG. 7. Position of the PL maximum as a function of the size of the Si nanoclusters determined by TOFMS. For the data of the present work we have used filled symbols共squares for the first and diamonds for the second series兲 whereas the results of an earlier PL study 共Ref. 17兲 are plotted as open circles. The dashed curve rep-resents the theoretical results of Delerue, Allan, and Lannoo共Ref. 37兲, whereas the dotted curve includes the correction due to the lattice variation according to Eq.共4兲.
The combination of Eqs. 共1兲, 共2兲, and 共3兲 leads to a new relation giving the position of the maximum of the PL as a function of the size of the nanocrystals:
EPLcorr⫽E0⫹
3.73
d1.39⫹
0.881
d ⫺0.245. 共4兲
This relation, which represents an approximation of the ex-pected effect of the lattice-parameter changes on the PL as a function of the size, is plotted in Fig. 7 as the dotted curve. It seems that this curve gives a slightly better agreement with the measurements, but due to the scatter of the data it is difficult to draw any conclusion.
Consideration of the variation of the PL within a given sample may be better suited to compare theory and experi-ment. It was shown in Fig. 4 that this variation may be rather pronounced. In total, a shift of the PL maximum of over 100 nm was observed. As discussed in Sec. III A, the shaping of the Si cluster pulse by the chopper and following aperture may lead to an inhomogeneous size distribution across the deposited film. Within the given bandwidth transmitted by the chopper, the smaller particles are encountered on the left part of the deposit while the larger particles are concentrated on the right side. Since the closing time was 14.5 s the particles deposited on the right edge of the 1-mm-wide film were slower by ⌬v⫽s/t0⫺s/(t0⫹14.5) compared to those that were deposited at time t0 when the chopper just started
to close the aperture共s is the distance between the nozzle of the cluster source and the chopper兲. In an earlier publication,18 we established a correlation between the ve-locity of the Si nanoparticles and their size. This dependence can be parametrized by
v⫽a log10n⫹b 共m/s兲 共5兲
with a⫽⫺311 and b⫽2631. The number n of Si atoms con-stituting the nanoparticle is related to its diameter d by
n⫽26.2d3. 共6兲 With these relations, the small difference in deposition time can be translated into a difference in particle size. Now, tak-ing the average particle size measured by TOFMS as the one that was deposited on the middle of the strip, the entire size distribution across the film can easily be calculated. The largest size, which was deposited on the right edge of the film, is calculated to be d⫽3.88 nm while the smallest size
共distributed over the entire film兲 is d⫽2.86 nm. It is
interest-ing to note that this calculated size variation compares very well with the full width at half maximum 共1 nm兲 measured with the TOFMS共see Table I兲.
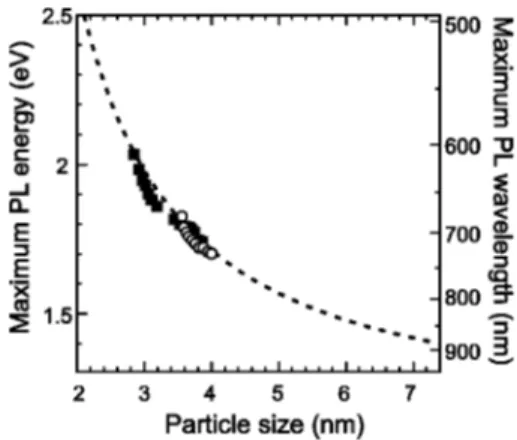
Figure 8 shows the PL maximum as a function of particle size as measured for different positions on sample A共solid squares兲. Now the agreement between the theoretical results of Delerue, Allan, and Lannoo37 and the measured data can be regarded as very good. Note that the agreement with the corrected model is also good in this range of particle sizes. A similar study was carried out for sample C, which was pro-duced with the fast-spinning chopper 共400 Hz兲. Here the opening or closing time was only 7.25s, and, correspond-ingly, the size dispersion was only ⌬d⫽4.00⫺3.56
⫽0.44 nm. The results, shown in Fig. 8 by the open circles,
are again in very good agreement with theory. It should be
pointed out that the experimental data points are much less scattered than was the case in Fig. 7. This is ascribed to the fact that all data points were measured on the same sample and all the Si nanoparticles have had the same history共same conditions of synthesis as well as same kind and degree of surface passivation in air兲, the only difference being their size. So indeed this measurement is much better suited for a comparison with theory than a collection of measurements of different nc-Si samples, each of which may have a different history.
The PL spectra obtained for different excitation wave-lengths show that the spectral variation of the PL is almost independent of the excitation energy, provided it is higher than the band gap of the material共see Fig. 5兲. In addition, the PL excitation spectrum compares very well with the reported absorption spectra for porous silicon 共see Fig. 5兲.36 These results show that the PL is well correlated with the absorp-tion of light by the core of the crystallites.
If one now takes a closer look at the efficiency results
共Table I兲, it can be seen that the corrected efficiencies are
rather high for most of the samples, nearly 100%. Only samples B and N have significantly lower efficiencies. In the case of sample B, it is interesting to point out that its PL is much bluer than expected from the size distribution. Thus, the real size may be smaller than the measured one. It fol-lows that the correction due to the presence of big particles would lead to a higher yield. The low yield observed for sample N is consistent with a spatial-confinement model where the PL yield is expected to decrease with size because the probability of finding a defect in the crystallite increases considerably.5 It is interesting to compare the yield values found here with the results of Credo, Mason, and Buratto.40 By studying single porous silicon nanoparticles, they found that a small portion共⬃3%兲 was luminescent with rather high yield共⬃88%兲 while the remaining particles showed no mea-surable PL, thus leading to a global yield of only 2.5% for the porous silicon layer. In contrast, in our study, it seems that every small particle of the deposit is luminescent.
With the knowledge of the size distribution and the theo-retical size dependence关Eq. 共1兲兴 it is now possible to model the measured PL spectra. For one given size d, we assume a PL spectrum described by a Gaussian instead of a Lorent-zian. This assumption is justified because we are dealing FIG. 8. Position of the PL maximum as a function of the Si nanocluster size at different lateral positions on sample A 共filled squares兲 and sample C 共open circles兲. The dashed line represents the theoretical results of Delerue, Allan, and Lannoo共Ref. 37兲.
with a group of particles with a given number of atoms that may have different shapes or even different lattice param-eters as was discussed before. With these considerations, the PL of a set of nanocrystals with a given diameter d is
fd共E兲⫽ 1 w
冑
/2e⫺2关E⫺EPL共d兲兴2/w2
, 共7兲
where we assume an intrinsic yield of photoluminescence of 100%. This last statement seems reasonable in view of our results on the PL yield of our samples. The width共FWHM兲 of the Gaussian is
冑
2 ln 2w. If we denote by n(d) the size distribution of the nanocrystals, the PL spectrum I(E) of one sample is given byI共E兲⫽␣
冕
0
⬁
n共d兲d3fd共E兲dd, 共8兲
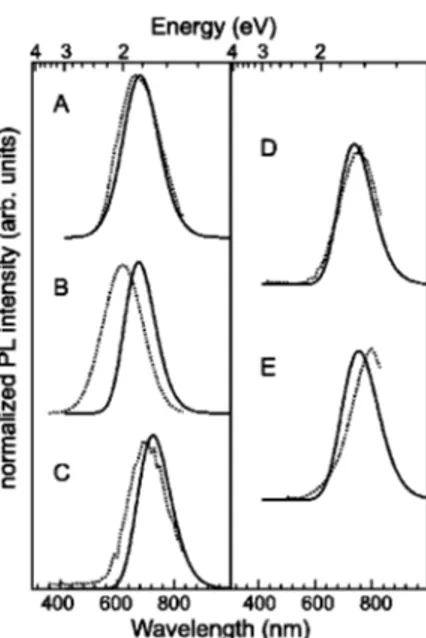
where␣is the absorption coefficient at the laser wavelength. The factor d3 takes into account the difference in absorption as a function of size. As we know that the absorption coef-ficient at the excitation wavelength also changes with size, one should normally write ␣(d)d3 instead. However, since the wavelength of the laser is in the UV, the changes of␣are rather small and, on the other hand, the size distribution in one sample is sufficiently narrow so that we can neglect this effect and assume␣to be the same for all sizes. The model calculations that have been carried out for all samples共A兲–
共E兲 of the first series are shown in Fig. 9. It is seen that the
theoretical and experimental spectra compare rather well, ex-cept for sample B whose peculiar behavior has already been discussed. As was stated before, in this model there is only one free parameter: the PL width for a given size. In order to obtain a good fit to the experimental spectra, this width was taken to be 0.25 eV in all calculations.
The width of 0.25 eV may appear rather broad. This high value and the fact that it does not depend on the size seem to point to an inhomogeneous broadening mechanism. In
elec-tron microscopy studies, Hofmeister, Huisken, and Kohn24 showed that the兵111其 lattice plane fringes vary by 2% for a given particle size between 2 and 25 nm. The variation of the lattice parameter共contraction for particles larger than 3.3 nm and dilatation for smaller particles兲 is attributed to the forces exerted by the oxide layer. The dispersion could be due to the different degrees of surface passivation for different par-ticles. We have seen that the shift in PL with a change in the lattice parameter can be estimated according to Eq. 共3兲. A change of 2% of the lattice parameter results in a PL shift of 0.24 eV, which comes very near to the width used for our simulations.
It should be mentioned that Yorikawa and Muramatsu41 employed very similar model calculations to reproduce the evolution of the PL peak maximum in porous silicon samples. However, they used the measured PL spectra to determine the two parameters of a log-normal size distribu-tion. In contrast, we know the size distribution, and our only free parameter is the width of the PL response for an en-semble of Si particles with a given size d.
Finally, it has been shown in Fig. 6 and Table II that, with time, the PL of the samples is shifted to the blue. This effect can also be understood as a size effect. With time, the oxide layer on the particles grows, so the crystalline core should diminish and thus lead to a bluer PL. By using the relation of Eq. 共1兲, we can deduce from the PL shift the change in the nc-Si core volume before and after oxidation. Then we can estimate the thickness of the oxide layer. However, to make this estimation, we have to take into account the volume of the oxide, which is not the same as for pure silicon. Silicon oxides have densities varying from 2.13 to 2.65 g/cm3,42 close to the value of pure silicon 共2.33 g/cm3兲. The main difference is due to the molecular weights: SiO has a mo-lecular weight of 44, SiO2 of 60, and Si of 28. Because we do not know exactly what kind of oxide is formed we will assume an average value, namely, 52. Then it follows that the volume containing the same number of Si atoms is a factor of 1.86 larger for silicon oxide than for crystalline silicon. For the two-month-old samples of the second series we obtain the result that the thickness of the oxide layer is 6% of the total particle diameter. For the different samples of the first series the results of the calculation are reported in Table II. The oxide thickness is 8–16 % of the particle di-ameter after eight months of oxidation. From these results it appears that the oxidation slows down, and our latest experi-ments have shown that, after eight months, the oxidation is essentially stopped. HRTEM measurements have revealed that, in the final stage of oxidation, the thickness of the oxide layer represents 10% of the total particle diameter, for diam-eters in the range between 6 and 30 nm.24 The present data, derived from the PL spectra, give similar results but in the range between 3 and 5 nm. This shows that the present evaluation is consistent with the more direct HRTEM analy-sis. It further confirms the statement that the oxidation of nc-Si particles is a self-limiting process because of the in-crease of the interface curvature. The same self-limiting oxi-dation effect was reported earlier for silicon nanowires ex-posed to an oxidizing atmosphere and to very high temperatures.43
FIG. 9. Experimental PL curves 共dotted lines兲 in comparison with the model calculations 共solid curves兲 based on the measured size distributions for the first series.
V. CONCLUSIONS
We have measured the photoluminescence properties of silicon nanocrystals as a function of their size. Our results can be well understood in the quantum confinement model since the experimental variation of the PL position is close to the theoretical behavior and since the internal PL yields of the nanocrystals are close to 100%. The PL shift with aging of the samples under normal atmosphere is also consistent with this model. Surface oxidation is confirmed to be a self-limiting process in nc-Si particles.
Using the theoretical dependence of the PL energy on the size of the Si nanoparticles,37 we are in a position to predict the optical response of a given nc-Si sample once the size distribution within the sample is known. With these simple calculations, we were able to reproduce the measured PL spectra and thus confirm the direct correlation between size distribution and spectral response. Furthermore, the results of the present study can be used to successfully explain the astrophysical phenomenon of extended red emission. Just by invoking different size distributions of Si nanoparticles with varying maximum position and width, it is possible to repro-duce any ERE observation known to date.21Size effects and their quantum confinement manifestations appear as a key to explain a long-standing problem in astrophysics.
The present investigations have been carried out within a
collaboration between three laboratories. While the samples were prepared in Go¨ttingen, the optical characterization was performed in Toulouse and Saclay. Except that the samples were exposed to the ambient air, nothing is known about the details of their surface passivation. Indeed, the oxide layer plays a role not only in the position of the PL, but also in the width because of its influence on the lattice parameter. Therefore, in another series of experiments, it is planned to carry out similar studies under much better defined condi-tions. For this purpose, it is necessary to measure the PL in exactly the same apparatus where the samples are prepared, without exposing them to air. By transferring the nc-Si samples into another vacuum chamber, we will be able to achieve a controlled surface treatment of the size-selected Si nanoparticles with oxygen or hydrogen or other reagents and study their photoluminescence as a function of the kind and degree of surface passivation. With these studies, we hope to collect a wealth of valuable experimental data, useful not only for potential applications of light-emitting Si nanopar-ticles in optoelectronic devices, but also for providing a cru-cial test for the quantum confinement model.
ACKNOWLEDGMENT
This work was supported by PROCOPE, a bilateral coop-eration between France and Germany.
*Present address: Max-Planck-Institut fu¨r Stro¨mungsforschung, D-37073 Go¨ttingen; Email address: gledoux@gwdg.de
1
L. T. Canham, Appl. Phys. Lett. 57, 1046共1990兲.
2L. T. Canham, Phys. Status Solidi B 190, 9共1995兲.
3A. G. Cullis, L. T. Canham, and P. D. J. Calcott, J. Appl. Phys.
82, 908共1997兲.
4L. E. Brus, P. F. Szajowski, W. L. Wilson, T. D. Harris, S.
Schup-pler, and P. H. Citrin, J. Am. Chem. Soc. 117, 2915共1995兲.
5R. B. Wehrspohn, J.-N. Chazalviel, F. Ozanam, and I. Solomon,
Eur. Phys. J. B 8, 179共1999兲.
6M. V. Wolkin, J. Jorne, P. M. Fauchet, G. Allan, and C. Delerue,
Phys. Rev. Lett. 82, 197共1999兲.
7A. G. Cullis and L. T. Canham, Nature共London兲 353, 335 共1991兲. 8R. A. Bley, S. M. Kauzlarich, J. E. Davis, and H. W. H. Lee,
Chem. Mater. 8, 1881共1996兲.
9D. P. Yu, Z. G. Bai, J. J. Wang, Y. H. Zou, W. Qian, J. S. Fu, H.
Z. Zhang, Y. Ding, G. C. Xiong, L. P. You, J. Xu, and S. Q. Feng, Phys. Rev. B 59, R2498共1999兲.
10T. Shimizu-Iwayama, N. Kurumado, D. E. Hole, and P. D.
Townsend, J. Appl. Phys. 83, 6018共1998兲.
11J. Linros, N. Lalic, A. Galeckas, and V. Grivickas, J. Appl. Phys.
86, 6128共1999兲.
12R. K. Soni, L. F. Fonseca, O. Resta, M. Buzaianu, and S. Z.
Weisz, J. Lumin. 83–84, 187共1999兲.
13K. Murakami, T. Suzuki, T. Makimura, and M. Tamura, Appl.
Phys. A: Mater. Sci. Process. 69, S13共1999兲.
14L. Patrone, D. Nelson, V. I. Safarov, M. Sentis, W. Marine, and
S. Giorgio, J. Appl. Phys. 87, 3829共2000兲.
15F. Iacona, G. Franzo, and C. Spinella, J. Appl. Phys. 87, 1295
共2000兲.
16P. Me´linon et al., Int. J. Mod. Phys. B 9, 339共1995兲.
17M. Ehbrecht, B. Kohn, F. Huisken, M. A. Laguna, and V.
Pail-lard, Phys. Rev. B 56, 6958共1997兲.
18M. Ehbrecht and F. Huisken, Phys. Rev. B 59, 2975共1999兲. 19K. G. Gordon, A. N. Witt, and B. C. Friedmann, Astrophys. J.
498, 522共1998兲.
20G. Ledoux, M. Ehbrecht, O. Guillois, F. Huisken, B. Kohn, M. A.
Laguna, I. Nenner, V. Paillard, R. Papoular, D. Porterat, and C. Reynaud, Astron. Astrophys. 333, L39共1998兲.
21G. Ledoux, O. Guillois, F. Huisken, B. Kohn, D. Porterat, and C.
Reynaud共unpublished兲.
22M. Ehbrecht, H. Ferkel, V. V. Smirnov, O. M. Stelmakh, W.
Zhang, and F. Huisken, Rev. Sci. Instrum. 66, 3833共1995兲.
23F. Huisken, H. Hofmeister, B. Kohn, M. A. Laguna, and V.
Pail-lard, Appl. Surf. Sci. 154–155, 305共2000兲.
24H. Hofmeister, F. Huisken, and B. Kohn, Eur. Phys. J. D 9, 137
共1999兲.
25F. Huisken, B. Kohn, R. Alexandrescu, S. Cocojaru, A.
Crunte-anu, G. Ledoux, and C. Reynaud, J. Nanopart. Res. 1, 293 共1999兲.
26F. Huisken, B. Kohn, and V. Paillard, Appl. Phys. Lett. 74, 3776
共1999兲.
27G. Ledoux, Ph.D. thesis, Ecole Centrale de Lyon, Ecully, France
共1999兲.
28R. F. Kubin and A. N. Fletcher, J. Lumin. 27, 455共1982兲. 29J. Georges, N. Arnaud, and L. Parise, Appl. Spectrosc. 50, 1505
共1996兲.
30J.-C. Vial, R. Herino, S. Billat, A. Bsiesy, F. Gaspard, M. Ligeon,
I. Mihalcescu, F. Mu¨ller, and R. Romestain, IEEE Trans. Nucl. Sci. 39, 563共1992兲.
31
Y. H. Xie, I. N. Germanenko, V. F. Voronin, and S. V. Gapo-nenko, Semiconductors 29, 350共1995兲.
32M. A. Tischler, R. T. Collins, J. H. Stathis, and J. C. Tsang, Appl.
Phys. Lett. 60, 639共1992兲.
33M. E. Kompan and I. Y. Shabanov, Fiz. Tverd. Tela共St.
Peters-burg兲 39, 1165 共1997兲, 关Phys. Solid State 39, 1030 共1997兲兴.
34I. M. Chang, S. C. Pan, and Y. F. Chen, Phys. Rev. B 48, 8747
共1993兲.
35D. Amans, O. Guillois, G. Ledoux, D. Porterat, and C. Reynaud
共unpublished兲.
36W. Theiss, Surf. Sci. Rep. 29, 91共1997兲.
37C. Delerue, G. Allan, and M. Lannoo, Phys. Rev. B 48, 11 024
共1993兲.
38A. K. Sood, K. Jayaram, and D. V. Muthu, J. Appl. Phys. 72,
4963共1992兲.
39G. W. C. Kaye and T. H. Laby, Tables of Physical and Chemical
Constants, 15th ed.共Longmans, London, 1993兲.
40G. M. Credo, M. D. Mason, and S. K. Buratto, Appl. Phys. Lett.
74, 1978共1999兲.
41H. Yorikawa and S. Muramatsu, J. Appl. Phys. 84, 3354共1998兲. 42Handbook of Chemistry and Physics, 72nd ed., edited by D. R.
Linde共CRC Press, Boca Raton, FL, 1991兲.
43H. I. Liu, D. K. Biegelsen, F. A. Ponce, N. M. Johnson, and R. F.