Aspects of dissolved inorganic carbon dynamics in the
upwelling system off the Galician coast
Alberto V. Borges*, Michel Frankignoulle
Unite´ d’Oce´anographie Chimique, Institut de Physique B5, Universite´ de Lie`ge, B4000 Lie`ge, Sart Tilman, Belgium Received 30 November 2000; accepted 20 August 2001
Abstract
In the present paper, we report data on the partial pressure of CO2( pCO2) in surface seawater off the Galician coast,
obtained during four cruises carried out in summer (upwelling conditions). Over the continental shelf, two processes that have opposite effects control pCO2in surface waters: (a) the input from upwelling of deep cold water with high CO2content that
causes oversaturation of CO2and (b) primary production that tends to decrease pCO2. In offshore waters, the distribution of
pCO2is mainly controlled by temperature change. In two distinct hydrographic coastal regions, the Rı´as Baixas area (RBA) and
the Cape Finisterre area (CFA), the patterns of the distribution of pCO2are complex but, in the Rı´as Baixas area, the averaged
pCO2values are systematically lower and temperature values higher. These differences between the two hydrographic regions
are mainly related to the combination of outwelling from the Rı´as and the width of the continental shelf. In the Rı´as Baixas area, outwelling affects significantly the adjacent inner continental shelf but to a much lesser extent the outer continental shelf. In the Cape Finisterre area, the continental shelf is narrower and the ratio between the surface area of the shelf to the length of the shelf break is lower, inducing during an upwelling event, lower temperature and higher pCO2values in surface waters than in the
Rı´as Baixas area.D 2002 Elsevier Science B.V. All rights reserved.
Keywords: pCO2; Upwelling; Continental margin exchange; Galician coast
1. Introduction
Tsunogai et al. (1999) and Wang et al. (2000) have recently shown that the East China Sea is a sink of atmospheric CO2 with net annual air – sea fluxes of
CO2ranging between 3.3 and 7.7 mmol C m 2
day 1. These results led Tsunogai et al. (1999) to formulate the concept of the ‘‘continental shelf pump’’, i.e. a net influx between 0.5 and 1.0 Gt C year 1, if
these air – sea fluxes are extrapolated to the worldwide continental shelf surface area. Frankignoulle and Borges (2001) found similar net annual air – sea fluxes in the Gulf of Biscay, which extrapolated to the surface area of the Northern European continental shelf give an additional net influx of atmospheric CO2of about
45% to the influx estimated by Takahashi et al. (1995) and Sarmiento et al. (1995) for the open North Atlantic Ocean. These results are based on high temporal and spatial resolution data sets of direct measurements of the gradient of CO2across the air – sea interface and
show that continental shelves are a significant compo-nent of the global carbon cycle. This assertion is corroborated by other studies based on various indirect
0924-7963/02/$ - see front matterD 2002 Elsevier Science B.V. All rights reserved. PII: S 0 9 2 4 - 7 9 6 3 ( 0 2 ) 0 0 0 3 1 - 3
* Corresponding author. Tel.: 3663367; fax:
+32-4-3662355.
E-mail address: Alberto.Borges@ulg.ac.be (A.V. Borges).
approaches such as the budget of carbon fluxes across the continental shelf margin (Walsh, 1988, 1991; Wollast, 1998), the net ecosystem metabolism of continental shelves (Gattuso et al., 1998) and a carbon biogeochemical model calibrated with pCO2field data
in the Baltic Sea (Thomas and Schneider, 1999). Upwelling systems are characterised by high pri-mary production rates ranging from 60 to 2000 g C 2 year 1off the Moroccan and Chilean coasts, respec-tively, making these areas sites of significant carbon fluxes across the continental shelf margin (e.g. Walsh, 1988; Alongi, 1988; A´ lvarez-Salgado et al., 2002). Upwelling brings to the surface deep water with a high CO2content that induces oversaturation of CO2with
respect to the atmosphere. For instance, in the Peruvian and Chilean coastal upwelling systems that are known to be among the most productive oceanic areas world-wide, huge oversaturation of CO2with respect to the
atmosphere has been reported with pCO2values up to
1200 Aatm, although very low values down to 140 Aatm have also been observed in relation to dissolved inorganic carbon fixation by phytoplankton (Kelley and Hood, 1971; Simpson and Zirino, 1980; Copin-Monte´gut and Raimbault, 1994; Torres et al., 1999). Other coastal upwelling systems also show a wide range of pCO2values such as 130 – 690 Aatm off the
California coast (Simpson, 1984; van Green et al., 2000), 300 – 450 Aatm off the Mauritanian coast (Co-pin-Monte´gut and Avril, 1995; Lefe`vre et al., 1998; Bakker et al., 1999) and 365 – 750 Aatm off the Omani coast (Ko¨rtzinger et al., 1997; Goyet et al., 1998). This variability is due to the opposing effects of upwelling and primary production on surface water pCO2, which
also induce strong spatial heterogeneity as illustrated by high-resolution surface mapping off the Portu-guese, the Californian and the Galician coasts (Pe´rez et al., 1999; van Green et al., 2000; Borges and Frankignoulle, in press). In general, the available data sets do not fully cover the annual cycle so that it is unclear if upwelling systems behave, at an annual basis, as sinks or sources of atmospheric CO2.
In a recent paper, Borges and Frankignoulle (in press) report the distribution of surface water pCO2off
the Galician coast (Northwestern Spain) obtained dur-ing six cruises. Surface water pCO2values over the
continental shelf range between 265 and 415 Aatm during summer (upwelling season) and between 316 and 345 Aatm during winter (downwelling season).
The computed air – sea fluxes of CO2 over the
con-tinental shelf yield a net influx in the range of 2.3 to 4.7 mmol C m 2day 1during the upwelling season and 3.5 to 7.0 mmol C m 2day 1at an annual basis for the Liss and Merlivat (1986) and the Tans et al. (1990) formulations of the CO2exchange
coeffi-cient, respectively. One of the aspects of the distribu-tion of surface water pCO2 over the Galician
continental shelf highlighted by Borges and Frank-ignoulle (in press) is the contrast between the northern area of the sampling region situated off Cape Finisterre and the southern area situated off the Rı´as Baixas (i.e. coastal indentations). For any given summer cruise, the (spatially) averaged pCO2 values are lower and
temperature higher off the Rı´as Baixas than off Cape Finisterre, where oversaturation of CO2 related to
upwelling was observed during all four summer cruises. The fact that the contrast between these two hydrographic regions was observed during all cruises strongly suggests that it is not coincidental but a systematic feature.
The most straightforward hypothesis to explain the contrast between the two hydrographic regions is the presence of the Rı´as Baixas themselves. During the upwelling season, when the input of fresh water is relatively low ( < 10 m3s 1, Nogueira et al., 1997), the Rı´as Baixas function as an extension of the continental shelf and not as rivers or estuaries. This means that upwelling occurs within the Rı´as as first described by Fraga (1981) and clearly evidenced by numerous studies (e.g. A´ lvarez-Salgado et al., 1993, 1999; Doval et al., 1997; Nogueira et al., 1997, 1998). The water circulation in the Rı´as is two layered, the bottom layer corresponding to upwelled Eastern North Atlantic Water (ENAW) that enters the Rı´a during an upwelling event and pushes the surface layer water out of the Rı´a. This phenomenon is described in literature as ‘‘outw-elling’’ from the Rı´as. The outwelled surface water is modified ENAW that entered the Rı´a during the upwelling event of the previous upwelling cycle (period typically of 14 days, A´ lvarez-Salgado et al., 1993). Thus, the physico-chemical and biological characteristics of this water mass are related to the relaxation stage that preceded the on-going upwelling event. The outwelled water is warm and has undergone high primary production (e.g. Tilstone et al., 1999) related to the input of nutrients from upwelled ENAW, to sediment remineralization and to a lesser extent by
the input of fresh water (e.g. A´ lvarez-Salgado et al., 1993).
The purpose of the present work is to discuss some aspects of dissolved inorganic carbon dynamics based on data collected during four cruises carried out off the Galician coast during the upwelling season as a contribution to the Ocean Margin EXchange (OMEX II) project. In Section 3.1, the main processes that control pCO2over the continental shelf and in the
off-shore waters of the Galician coastal upwelling system are described and discussed. In Section 3.2, the potential influence of the Rı´as to explain the differ-ence between the two hydrographic regions over the continental shelf is explored by the analysis of data obtained within and around the Rı´a of Vigo. In Section 3.3, with simple simulations, we explore the hypothesis of the effect of the width of the continental shelf to explain the difference between the two con-tinental shelf hydrographic regions. Finally, in Section 3.4, we examine the possibility that the difference between the two hydrographic regions over the con-tinental shelf could be related to the synopticity of sampling and bias in data integration.
2. Materials and methods
Data presented in this paper were obtained on board the R.V. Belgica and the R.R.S. Charles Darwin during four cruises (Belgica 97/14 – 18/06 to 07/07/97, Belg-ica 98/15 – 14/06 to 14/07/98, CD114 – 29/07 to 24/08/ 98 and Belgica 99/19 – 30/08 to 21/09/99). Underway parameters (seawater pCO2, dissolved oxygen,
salin-ity, in situ temperature and fluorescence) were sampled with a frequency of 1 min from the nontoxic seawater supply of the ship (pump inlet at 2.5 m). A non-dispersive infrared gas analyser (Li-CorR, LI-6262) was used to measure pCO2in wet air equilibrated with
seawater. Before 1998, pCO2was measured in
equili-brated air dried with DrieriteR and the data were converted into wet air using the algorithms proposed by DOE (1994). The Li-CorR was calibrated daily using three gas standards of 0.0 Aatm (pure nitrogen, Air Liquide Belgium), 351.0 Aatm (Air Liquide Bel-gium) and 360.5 Aatm (National Oceanic and Atmos-pheric Administration). The pCO2values are corrected
for the temperature difference between in situ seawater and water in the equilibrator, using the algorithm
proposed by Copin-Monte´gut (1988) (the offset in temperature was typically f 0.5 jC). More details on the equilibration technique, equilibrator design and quality control can be found in Frankignoulle et al. (2001). The accuracy of the pCO2 measurement by
equilibration is estimated to F 2 Aatm (including cumulated uncertainties on temperature correction and instrument calibration). A second Li-CorR was used to measure atmospheric pCO2sampled at the bow
of the ship at approximately 10 m height. Total Alkalinity (TAlk) was determined using the classical Gran electrotitration method, on 100 ml GF/F filtered samples. The precision of TAlk measurements obtained on board is F 4 Amol kg 1. The measure-ment of pH was obtained using a Ross combination electrode (ORIONR), calibrated on the Total Hydro-gen Ion Concentration Scale (mol kg SW 1), using the TRIS and AMP buffers proposed by Dickson (1993). The precision of the pH measurement is estimated to be F 0.004 pH units. Total dissolved in-organic carbon (DIC) was calculated from the pH and TAlk measurements with the dissociation constants of carbonic acid from Roy et al. (1993), the borate molality obtained from the Culkin (1965) ratio to sa-linity, the dissociation constant of boric acid from Dickson (1990) and the carbon dioxide solubility coefficient of Weiss (1974), with an estimated accu-racy of F 5 Amol kg 1. Underway dissolved oxygen was measured using a galvanic electrode (KentR) calibrated, every 12 h, from discrete samples measured by the Winkler method using a potentiometric end-point determination, with an estimated accuracy of F2 Amol kg 1( F 0.5% of level of saturation). The oxygen saturation level (%O2) is computed from the
observed concentration of dissolved O2and the
con-centration of O2at saturation calculated using the
al-gorithm proposed by Benson and Krause (1984). The concentration of chlorophyll a was determined from GF/F filtered samples, by the fluorimetric method (Arar and Collins, 1997), with a precision of F 4%. Underway fluorescence was determined with a Turner DesignsR10AU fluorimeter. Salinity and in situ tem-perature were measured using a SeaBirdR21 (Belgica) and a Falmouth Scientific InstrumentsR (Charles Darwin) thermosalinograph, with an estimated accu-racy of F 0.05 and F 0.01 jC, respectively. Vertical profile data were obtained from a 12 bottle rosette coupled to a CTD (SeaBirdR19).
3. Results and discussion
3.1. Spatial and temporal variability of pCO2in the
off-shore and the continental shelf waters off the Galician coast
3.1.1. General setting and characterization of the different hydrographic regions
Table 1 summarizes the atmospheric and seawater pCO2 and temperature data obtained during four
cruises carried out off the Galician coast during sum-mer. For each cruise, the data were separated into four hydrographic regions, the Cape Finisterre area (CFA), the Rı´as Baixas area (RBA), the Coastal Transition Zone (i.e. upwelling filaments, CTZ) and the remain-ing off-shore area (OSA) shown in Fig. 1. Upwellremain-ing occurred during all four cruises but with variable intensity. As shown by average surface water temper-ature, the June 1997 cruise corresponded to the tran-sition of strong upwelling relaxation to moderate active upwelling conditions, the first leg of the Sep-tember 1999 cruise (from the 4th to the 11th) corre-sponded to strong upwelling relaxation conditions, while the remaining cruises corresponded to strong
active upwelling conditions. In spite of a wide range of pCO2and temperature values, the (spatially) averaged
values in the RBA are systematically lower for pCO2
and higher for temperature than in the CFA. The averaged values in the CTZ are systematically lower for pCO2and temperature than in the OSA.
Atmospheric pCO2data for any given cruise show a
wide range of values. This can be explained by the presence of air masses of offshore and of continental origin, as discussed in detail by Borges and Frankig-noulle (2002b). Interestingly, a decrease of both the average value and the range of variability was ob-served from the first to the second leg of the September 1999 cruise. This could be explained by the southward winds associated to the active upwelling event that occurred during the second leg of the cruise that brought into the study region an air mass with offshore and oceanic characteristics (most probably from the Gulf of Biscay).
3.1.2. Property – property plots
Fig. 2 shows surface water parameters from two selected summer cruises plotted versus temperature, a convenient way to analyse data in upwelling areas.
Table 1
Summary of averaged values of water temperature (jC), surface seawater pCO2(Aatm), the air – sea gradient of CO2(DpCO2) and atmospheric
pCO2, obtained off the Galician coast during four summer cruises
Cruise Region Water temperature Seawater pCO2 DpCO2 Atmospheric pCO2
21 June – 2 July 1997 CFA 16.6 (17.7, 14.2) 337 (386, 289) 27 362 (363, 362)
(upwelling relaxation) RBA 17.7 (19.0, 15.2) 324 (343, 266) 36
OSA 18.2 (19.2, 17.5) 338 (346, 328) 23
27 June – 7 July 1998 CFA 14.1 (16.0, 13.4) 358 (397, 263) 1 359 (373, 354)
(active upwelling) RBA 15.3 (17.2, 13.5) 315 (384, 274) 46
CTZ 17.2 (17.5, 14.1) 331 (367, 308) 27
OSA 17.8 (18.8, 17.5) 342 (359, 329) 18
11 – 21 August 1998 CFA 14.1 (15.8, 13.1) 352 (383, 322) + 2 353 (364, 348)
(active upwelling) RBA 14.8 (16.9, 13.0) 341 (390, 310) 14
CTZ 15.8 (17.5, 14.1) 326 (349, 302) 28
OSA 18.2 (19.7, 17.5) 339 (351, 329) 14
4 – 11 September 1999 CFA 16.7 (17.7, 15.6) 351 (384, 315) 14 365 (392, 343)
(upwelling relaxation) RBA 18.4 (19.8, 16.5) 349 (364, 306) 18
CTZ 16.9 (17.5, 15.3) 344 (381, 321) 15
OSA 19.6 (21.2, 17.5) 361 (374, 329) + 1
14 – 18 September 1999 CFA 15.9 (17.0, 14.5) 356 (415, 267) 1 357 (369, 355)
(active upwelling) RBA 16.8 (18.4, 15.4) 339 (394, 294) 19
CTZ 17.3 (17.5, 17.1) 341 (346, 334) 16
OSA 18.5 (19.8, 17.5) 351 (363, 337) 6
Atmospheric pCO2data for the June 1997 cruise are from Barrow Point (Keeling and Whorf, 1999). Numbers in brackets correspond to
Surface water pCO2 versus temperature shows a
relatively complex pattern; however, some trends are consistent for both cruises, as, for instance, the highest pCO2values associated to the lowest temperature as
expected in a system where upwelling brings to the surface cold, deep and CO2-rich water (Fig. 2A,B).
The lowest pCO2values are associated to intermediate
temperatures. In the high temperature range, surface seawater is close to atmospheric equilibrium.
For the June 1998 cruise, the theoretical evolution of a water parcel characterized by the highest pCO2
value (397 Aatm at 13.4 jC) was computed in the one hand when allowed to warm and in the other hand when allowed to mix with a water parcel with the highest temperature ( pCO2= 352 Aatm at 18.8 jC),
assuming that salinity and Total Alkalinity remain constant at 35.7 and 2.340 mmol kg 1, respectively.
It is clear that the observed pCO2data points do not
follow either of these theoretical curves (lines 1 and 2 in Fig. 2A), which is due to the effect of net phyto-planktonic fixation of dissolved inorganic carbon, as the temperature increases, i.e. as the water mass ages. This is corroborated by the good relationship between pCO2normalized to an average temperature of 16 jC
[ pCO2(16 jC)] and %O2 (Fig. 2G,H). It should be
noted that at the time scale of 14 days (the periodicity of the cycle of active upwelling and upwelling relax-ation), the effect of air – sea exchange of CO2can be
neglected in relation to other processes such as bio-logical activity. Indeed, if the water parcel character-ized by the highest pCO2value (397 Aatm) observed
during the June 1998 cruise was allowed to exchange CO2with the atmosphere during 14 days (in absence
of other processes), then a decrease of pCO2of only
Fig. 1. Location of the study site with the different hydrographic areas and their surface areas: CFA = Cape Finisterre area; RBA = Rı´as Baixas area; OSA = Offshore area; CTZ = Coastal Transition Zone. The CTZ corresponds to upwelling filaments and is defined as off-shore waters with a surface water temperature lower than 17.5 jC based on Borges and Frankignoulle (2002b). L is the length of the shelf break for the CFA and the RBA.
11 Aatm would be observed (for a constant wind speed of 10 m s 1(average value during the cruise), using the Wanninkhof (1992) exchange coefficient formula-tion in a 1-min iterative computaformula-tion method (for details refer to Borges and Frankignoulle, 2002b) and assuming a mixed layer 20-m deep, tempera-ture = 13.4 jC, salinity = 35.7, TAlk = 2.340 mmol kg 1). Thus, the potential effect of air – sea CO2
exchange is one order of magnitude lower than the variability of f 100 Aatm due to other processes.
Depletion of NO3 is observed at temperatures
z 16 and z 18 jC for the June 1998 and the Septem-ber 1999 cruises, respectively (Fig. 2E,F). In a nitrate-depleted mixed layer, new primary production is replaced by regenerated primary production that, in theory, should not correspond to a significant net dissolved inorganic carbon fixation. For both cruises, a pCO2increase is observed with rising temperatures
in the nitrate-depleted waters (Fig. 2A,B). However, in the high temperature range, the pCO2(16 jC) values
remain relatively constant (Fig. 2C,D). This illustrates that the observed increase of pCO2with temperature
(Fig. 2A,B), in the nitrate-depleted waters, can be explained by the effect of temperature on the equili-brium constants of dissolved inorganic carbon and, in particular, the solubility coefficient of CO2( pCO2rise
of f 4% with temperature increase of 1 jC). 3.2. Spatial and temporal variability of pCO2in the
Rı´a of Vigo and adjacent continental shelf
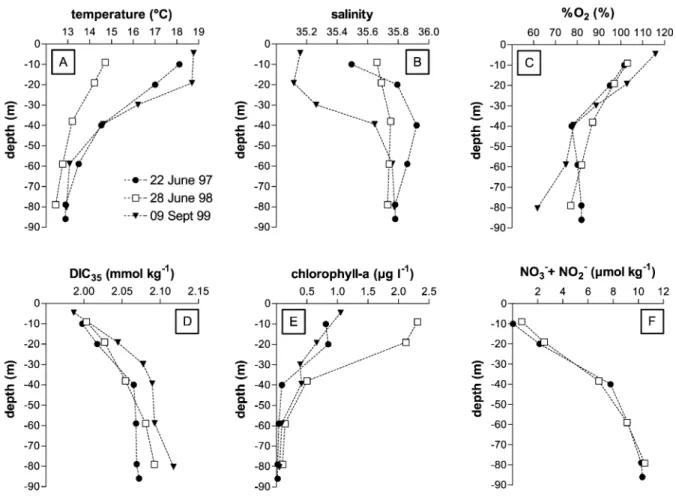
3.2.1. Vertical variability in front of the Rı´a of Vigo Fig. 3 shows vertical profile data obtained by re-peated sampling of a station in front of the Rı´a of Vigo. The temperature profiles show that the various sampling periods correspond to different hydrological conditions: upwelling relaxation (i.e. stratification) on the 22nd of June 1997 and on the 9th of September 1999 and active upwelling on the 28th of June 1998 (Fig. 3A). The salinity profiles show that surface waters are less saline on both the 22nd of June 1997
and the 9th of September 1999, however, on the 28th of June, salinity is fairly constant throughout the water column (Fig. 3B). The %O2 values are higher in
surface waters as would be expected from subsurface phytoplanktonic activity as also suggested by the chlorophyll a profiles and corroborated by the DIC35
profiles (Fig. 3C – E). The chlorophyll a profiles also suggest higher phytoplanktonic activity associated with active upwelling conditions. Either during active upwelling conditions (28th of June 1997) or upwelling relaxation (22nd of June 1997), very low nitrate con-centrations are observed in surface waters ( V 0.7 Amol kg 1). (No nitrate data are available for the 9th of September 1999 but for all three profiles, very low phosphate concentrations were measured in surface waters, with values V 0.14 Amol kg 1, Dr. Lei Chou, personal communication). The %O2and DIC35values
below 40 m from the 22nd of June 1997 and the 28th of June 1998 are very close. However, the %O2and
DIC35values below 40 m from the 9th of September
suggest enhanced degradation processes in the deeper water column. Surface water pCO2values (underway
measurements) on the 22nd of June 1997, the 28th of June 1998 and the 9th of September 1999 all show undersaturation: 336, 298 and 327 Aatm, respectively. The pCO2(16 jC) values are 308, 315 and 293 Aatm,
respectively, in accordance with surface DIC35values:
a slightly lower value on the 9th of September and similar values on the two other occasions. Neverthe-less, significant undersaturation of CO2 is observed
during active upwelling, which is due to enhanced primary production as shown above by the chlorophyll a and DIC35profiles.
The salinity profiles in Fig. 3 suggest an input of fresh water, particularly in September 1999. The TS diagrams in Fig. 4A show that the samples below 50 m fall on the regression line of ENAW that upwells off the Rı´as Baixas (Fraga et al., 1982). However, the data points above 50 m do not fall on a vertical line as would be expected if surface water were warm ENAW. This is true for all three stations, but more
Fig. 2. pCO2(Aatm), pCO2normalized to 16 jC (Aatm) and nitrate versus temperature (jC), and pCO2normalized to 16 jC versus oxygen
saturation level (%), for two summer cruises off the Galician coast. The horizontal dotted line corresponds to the CO2atmospheric equilibrium.
Solid lines show the theoretical evolutions of a water parcel with the highest pCO2value (397 Aatm at 13.4 jC) when allowed to warm (line 1)
and when allowed to mix with a water parcel with the highest temperature ( pCO2= 352 Aatm at 18.8 jC) (line 2). Nutrient data are courtesy of
pronounced for the two stations sampled during upwelling relaxation. Thus, the water in the surface layer has mixed with a less saline water mass outw-elled from the Rı´a of Vigo. The TS diagrams above the shelf break at the same latitude as the station in front of the Rı´a of Vigo show that the data points in the surface layer are closer to the expected vertical line (Fig. 4B). This means that the surface water at the shelf break mixed to a lesser extent with water outwelled from the Rı´a of Vigo. The profile from the June 1997 cruise that corresponded to an intense upwelling relaxation event shows the most pro-nounced effect from mixing with outwelled water at the shelf break (Fig. 4B).
3.2.2. Longitudinal and seasonal variability in the Rı´a of Vigo and the adjacent continental shelf
To further investigate the role of the Rı´as Baixas in the study area, Fig. 5 shows all the underway data we collected within and around the Rı´a of Vigo. These transects cover the continental shelf adjacent to the Rı´a of Vigo from the shelf break at about 9.3jE to the mouth of the Rı´a at 8.9jE and the Rı´a itself up to 8.7jE. The distribution of water temperature shows that sampling was carried out under various hydro-graphic conditions (Fig. 5B). Temperature is high along the transects carried out on the 20th of June 1997 and the 9th of September 1999 that correspond to upwelling relaxation conditions (see Table 1). The
Fig. 3. Vertical profiles of temperature (jC), salinity, oxygen saturation level (%), DIC35(mmol kg 1), chlorophyll a concentration (Ag l 1) and
NO3 + NO2 concentration (Amol kg 1), on three occasions at a station ( 8.96jE, 42.15jN) located f 5 km away from the mouth of the Rı´a
of Vigo. Chlorophyll a data are courtesy of Dr. L. Chou (ULB). Nutrient data are courtesy of Drs. X.A. A´ lvarez-Salgado (IIM) and M. Elskens (VUB).
other transects correspond to active upwelling condi-tions of variable intensity. The transect carried out on the 20th of August 1998 corresponds to very intense
upwelling conditions with temperatures over the shelf as low as 15 jC. However, the relative variation of temperature is as indicative of upwelling intensity as the absolute temperature values. For instance, between the 11th and the 20th of August 1998, water temper-ature at 9.1jE changed of about 1.5 jC (f 0.2 jC per day) while between the 9th and the 16th of September 1999 the temperature change was 2.5 jC, thus twice more rapid (f 0.4 jC per day). Therefore, the transect of the 16th of September 1999 can also be associated to strong active upwelling conditions. For the two upwelling relaxation transects (20th of June 1997 and the 9th of September 1999), the distribution of temperature is fairly homogeneous along the transect, while for the transects carried out during active up-welling conditions, the temperature within the Rı´a of Vigo is generally higher than over the adjacent con-tinental shelf. This can be related to the fact that the Rı´a of Vigo is shallower ( V 50 m) and more protected from wind speed (i.e. less turbulent) than the adjacent continental shelf, so that surface water will warm more rapidly. This means that the surface water mass on the continental shelf is only partly outwelled from the Rı´a; otherwise, it would be at the same temperature as the one of the Rı´a. We can conclude that during an up-welling event, the outwelled water from the Rı´a mixes with water upwelling directly on the shelf. On the 16th of September 1999, water temperature close to the mouth of the Rı´a was colder than over the adjacent shelf and than within the Rı´a, suggesting that under strong upwelling conditions, deep water outcrops more intensely at this site.
The distribution of salinity shows the influence of fresh water input in the Rı´a (Fig. 5A). During upwell-ing relaxation (20th of June 1997 and the 9th of September 1999), the influence of fresh water input on the surface layer is more marked than during up-welling conditions. This can be explained by the fact that, under stratified conditions, the fresh water mixes with surface water and remains in the surface layers. This lower salinity water then extends out over the shelf. On the other hand, during an upwelling event, the effect of fresh water input on surface water salinity will be smaller, due to the higher contribution of ENAW. On the 20th of June 1997, the less saline water extents over the entire shelf up to the shelf break, as also shown above by the TS diagrams (Fig. 4B). However, even under intense upwelling
condi-Fig. 4. TS diagrams at a station ( 8.96jE, 42.15jN) located f 5 km away from the mouth of the Rı´a of Vigo and at a station at the shelf break ( 9.30jE, 42.15jN). Solid line is the regression line of Eastern North Atlantic Water (ENAW, S = 35.586 + 0.106(T 11)) according to Fraga et al. (1982).
Fig. 5. Distribution of salinity, temperature (jC), pCO2(Aatm), oxygen saturation level (%) and pCO2normalized to 16 jC (Aatm) along six
transects from the shelf break into the Rı´a of Vigo, and average value (for each transect) of pCO2normalized to 16 jC versus oxygen saturation
level. The points in brackets correspond to the June 1997 data and were excluded from the linear regressions (see text). The horizontal dotted line is the CO2atmospheric equilibrium. The vertical dotted line shows the location of the mouth of the Rı´a of Vigo.
tions, there is a signal in the salinity distribution in the Rı´a and the adjacent continental shelf, as the upwelled ENAW mixes with the less saline surface water. The difference of average salinity values between the outer continental shelf (between 9.3jE and 9.1jE) and the inner continental shelf (between 9.1jE and 8.9jE) is f 0.12 during active upwelling condi-tions (27th of June 1998, 11th of August 1998, 20th of August 1998 and 16th of September 1999) and f 0.60 during upwelling relaxation conditions (20th of June 1997 and the 9th of September 1999), show-ing that the influence of outwelled water is more important on the inner continental shelf than on the outer continental shelf.
The distribution of pCO2shows moderate seasonal
variability over the outer continental shelf (range 319 – 360 Aatm) and intense variability within the Rı´a and over the inner continental shelf (range 250 – 425 Aatm) (Fig. 5C). It is also clear that the distribution of pCO2
is fairly homogeneous for a given transect over the outer continental shelf while showing strong gradients at the vicinity of the Rı´a. In the outer continental shelf, pCO2values are higher on the 9th of September 1999,
i.e. strong upwelling relaxation event, than on both the 20th of August 1998 and 16th of September 1999, i.e. strong upwelling events. This due to the temperature effect on equilibrium constants because the two trans-ects carried out under strong upwelling events show higher pCO2(16 jC) values than the others (Fig. 5E).
Both pCO2 and pCO2 (16 jC) show higher values
within the Rı´a than over the adjacent continental shelf on the 20th of August, illustrating the effect of upwell-ing within the Rı´a. Durupwell-ing the two upwellupwell-ing relaxa-tion events (20th of June 1997 and the 9th of Sep-tember 1999) and some of the upwelling events (27th June 1998 and 16th of September 1999), pCO2 and
pCO2(16 jC) values are lower within the Rı´a of Vigo
than on the adjacent continental shelf. This is related to primary production as corroborated by the distribution %O2that shows in general higher values within the Rı´a
(Fig. 5D) and by the good correlation between pCO2
(16 jC) and %O2(Fig. 5F). It should also be noted that
for all transects, %O2values are almost always above
the saturation level, showing that during both active upwelling and upwelling relaxation events, primary production strongly affects surface parameters and induces the observed undersaturation of CO2 over
the continental shelf (Fig. 5F). The exception is the
transect of the 20th of June 1997 when %O2values
were very close to saturation (points in brackets in Fig. 5F). This can be explained by the fact that primary production was low during this strong upwelling relaxation event and that air – sea exchange tended to bring O2 close to saturation (the effect of air – sea
exchange on the pCO2values is weaker than on the
O2values because of the carbonate buffering capacity
of seawater).
We can conclude from both Sections 3.2.1 and 3.2.2 that during both downwelling conditions and upwelling conditions the undersaturation of CO2 in
the continental shelf waters adjacent to the Rı´as is related to primary production. During downwelling conditions, the strongly CO2undersaturated outwelled
water from the Rı´as affect the inner adjacent conti-nental shelf. However, the outwelling from the Rı´as has little effect on the outer continental shelf, except during extreme relaxation events. During upwelling conditions, oversaturation of CO2 is only observed
within the Rı´as and CO2undersaturation is observed
in the adjacent inner and outer continental shelf. Even under strong upwelling conditions, primary produc-tion maintains pCO2below the saturation level in the
RBA.
3.3. Effect of shelf topography on the surface dis-tribution of dissolved inorganic carbon
If the outwelling from the Rı´as only influences the distribution of pCO2 in the inner continental shelf
during upwelling relaxation events, then, another pro-cess seems also to contribute to the different pCO2and
temperature-averaged values systematically observed in the RBA and CFA. Apart from the presence of the Rı´as, one of the differences between the CFA and the RBA is the width of the continental shelf. In the CFA, the shelf width varies between 16 and 18 km while in the RBA, the shelf is always more than 30 km wide. The ratio between the surface area and the length of the shelf break is 21 (785 km2/37 km) and 37 (3365 km2/ 92 km) for the CFA and the RBA, respectively (see Fig. 1). The flow of upwelled water is limited by the length of the shelf break, so that the volume of water upwelled on to shelf related to the water volume over the shelf will be higher in the CFA than in the RBA. This will in turn affect the distribution of surface parameters.
We computed theoretically the evolution of surface water temperature and DIC, during the onset of an upwelling event using for initial conditions the values from a cruise carried out in January 1998 (see Borges and Frankignoulle, in press, for a general description of the hydrographic conditions), i.e. mixed layer depth = 40 m, pCO2= 335 Aatm, surface water temperature =
15.6 jC and DIC = 2.059 mmol kg 1. To keep the computations as simple as possible, we considered that the salinity and TAlk on the shelf and of upwelled water are the same and equal to 35.7 and 2.340 mmol kg 1, respectively. We considered that water was upwelled from 200 m (Huthnance et al., 2002) characterized by pCO2= 386 Aatm, temperature = 12.0 jC and DIC =
2.118 mmol kg 1(based on numerous CTD profiles at the shelf-break). The volume of upwelled water was computed using the length of shelf break shown in Fig. 1 and an upwelling index of 750 m3km 1s 1, which corresponds to the flow of upwelled water per kilo-meter of coastline. The variation of temperature and DIC were computed by iteration during 7 days (half of the typical period of an upwelling cycle) by consider-ing that a volume of surface shelf water is exported, equivalent to the volume of upwelled water that mixes with water on the shelf. The effect of air – sea exchange of CO2 on the DIC and pCO2 was also computed
iteratively using the Wanninkhof (1992) exchange co-efficient, a constant wind speed of 10 m s 1and an atmospheric pCO2value of 364 Aatm.
Fig. 6A shows that in 7 days, the decrease of surface water temperature related to upwelling is more pro-nounced in the CFA than in the RBA. The evolution of DIC was computed for two situations: in absence of primary production and by taking into account a net primary production rate of 750 mg C m 2day 1. Fig. 6B shows, as expected, surface DIC values increasing in relation to upwelling in both areas, but the increase in the CFA is more pronounced than in the RBA even when taking primary production into account. The evolution of pCO2 was computed from the one of
DIC, and in absence of primary production, pCO2
in-creases in both areas although more rapidly in the CFA. When taking into account primary production, pCO2
decreases in the RBA while it increases in the CFA. However, the decrease of pCO2in the RBA is
thermo-dynamically controlled by the decrease of temperature as shown by the increase of pCO2(16 jC) (Fig. 6D). It
should be noted that the increase of DIC and pCO2
values related to the input of atmospheric CO2from
air – sea exchange is very low at this time scale. Indeed, the final values of DIC and pCO2(from day 7) are on
average (for the four simulations) 0.8 Amol kg 1and 1.4 Aatm higher, respectively, than those computed from simulations that do not take air – sea exchange into account (not shown). As expected, the most marked difference between simulations with and with-out taking air – sea exchange into account is for the simulation of the RBA with primary production due to the stronger air – sea pCO2gradient but still remains
negligible (1.1 Amol kg 1and 1.8 Aatm for DIC and pCO2, respectively).
If one takes the DIC values from day 7 of the computation made in absence of primary production, and one calculates the primary production rate needed to maintain DIC unchanged (steady state), one obtains 1570 and 1110 mg C m 2day 1for the CFA and the RBA, respectively. This means that the lower DIC and pCO2 values in the RBA than in the CFA are not
necessarily related to a higher primary production rate at CFA than in the RBA. Indeed, the primary pro-duction rate is expected to be higher in the CFA than RBA since the input of nitrate should be higher also in relation to width of the continental shelf.
Finally, it should be noted that at the start of the next upwelling cycle, initial pCO2 and temperature
conditions will be different in the two hydrographic regions and, thus, the contrast will be emphasized.
The purpose of these simple computations is not to provide a realistic description of the evolution of pa-rameters during the onset of an upwelling event; how-ever, they illustrate that the observed differences be-tween the two hydrographic areas can, to some extent, be explained by the difference of the width of the continental shelf. For instance, these computations can explain the relatively lower temperature and higher DIC and pCO2observed values in the CFA than in the
RBA. Other processes probably also contribute to enhanced upwelling in the CFA. For instance, Haynes et al. (1993) point out the increase of wind stress at Cape Finisterre, due to orographic effects, to explain the distribution of upwelling filaments off the Iberian coast. Also, off capes, upwelling can occur with a wider range of wind directions than along a relatively linear coastline (Huthnance et al., 2002). Also, it should be noted that surface seawater temperatures lower in the CFA than in the RBA is a feature that can be noticed in
several published surface water temperature distribu-tions based on field data (see Fraga, 1981; Castro et al., 1994; Tenore et al., 1995) or based on the output from ‘‘realistic’’ physical models (see Stevens et al., 2000). 3.4. Synoptic surface distribution fields?
One of the questions that can be raised concerning the four summer cruises is whether the surface
distri-butions of parameters are synoptic or not. Borges and Frankignoulle (in press) show that temperature and pCO2can evolve rapidly within a few days in surface
waters off Cape Finisterre during active upwelling conditions. This is also observed in the present work from the transects within and around the Rı´a of Vigo (Fig. 5). It can then be argued that the differences in surface parameters in the RBA and the CFA could be related to the fact that, for example, the former was
Fig. 6. Theoretical evolution of temperature (jC), DIC (mmol kg 1), pCO
2(Aatm) and pCO2normalized to 16 jC (Aatm) in the Cape Finisterre
area (CFA) and the Rı´as Baixas area (RBA) with the onset of an upwelling event characterised by an upwelling index of 750 m3s 1km 1, in
sampled during upwelling relaxation conditions while the latter was sampled during an active upwelling event.
For instance, during the June 1998 cruise, sam-pling started in the RBA in front of the Rı´a of Vigo and finished 9 days later in the CFA. During this
Fig. 7. Distribution of pCO2(Aatm), temperature (jC), oxygen saturation level (%), salinity, fluorescence (Ag l 1) and chlorophyll a
con-centration (Ag l 1) versus latitude (jN), along three transects off the Portuguese coast. The horizontal line on the pCO2plot corresponds to
atmospheric equilibrium measured on the 16th of September 1999. In the TAlk versus salinity plot, the full squares correspond to the samples from the 26th of June 1998 and the open circles to samples from the 16th of September 1999, obtained at the same locations as the chlorophyll a samples. The solid line corresponds to the regression line: TAlk = 0.741 + 0.045S (r2= 0.937, p < 0.0001). The vertical dotted line corresponds to southernmost limit of the Rı´as Baixas area.
cruise, data were collected south of 42.1jN along the Portuguese coast on the day before the start of sampling in front of the Rı´a of Vigo (28th June 1998; Fig. 7). Temperature along the Portuguese coast is relatively constant around 13.5 jC, clearly showing the effect of upwelling (Fig. 7A). This is corroborated by the CO2 oversaturation (average pCO2 of 380
Aatm) and the %O2 undersaturation (Fig. 7D,E). In
the RBA (north of 42.1jN), temperature and %O2
rapidly increase by about 2.5 jC and 19%, respec-tively, while pCO2decreases by about 90 Aatm. These
abrupt variations can be attributed to the outwelling of water from the Rı´a of Vigo, as shown in Fig. 7B, by the slight decrease in salinity. However, this transect clearly shows that upwelling was occurring at the start
of the June 1998 cruise and that the differences observed between the CFA and the RBA (Table 1) were not due to a data integration problem (non-synoptic field).
Fig. 7 also shows two transects along the Portu-guese coast carried out during the second leg of the September 1999 cruise. Along the near-shore transect, there is a distinct signal in the salinity distribution that is related to the input of fresh water from the river Minho. Oversaturation of CO2and undersaturation of
O2are associated to this water mass as described for
other river plumes (e.g. Frankignoulle et al., 1998; Borges and Frankignoulle, 1999). The input of fresh water is more pronounced than during the June 1998 transect and located slightly south probably due to the
Fig. 8. Distribution of temperature (jC), pCO2(Aatm) and oxygen saturation level (%) versus latitude (jN) along two transects carried out off
the Galician coast on the 21st of August 1998. The horizontal dotted line corresponds to CO2atmospheric equilibrium. The vertical dotted line
corresponds to the boundary between the Rı´as Baixas area and the Cape Finisterre area. Dotted line in map corresponds to the shelf edge (200 m isobath).
deflection of the river plume by the residual current. The plot of TAlk versus salinity (Fig. 7C) shows that the river end member of the river Minho is charac-terised by low Total Alkalinity values. This plot also allows to check that the same river plume was sampled along the 1998 and 1999 transects and sug-gests that the river Lima located south of the transects was not influencing the area. However, south of 41.85jN, the salinity distribution shows that the influence of the river Minho is negligible and the strong oversaturation in CO2 is associated to cold
upwelled water. The signal of upwelling in temper-ature and pCO2is weaker in the RBA than along the
Portuguese coast. Along the second transect on the 16th of September 1999 carried out about 9 km from the coast, surface parameters are relatively constant and temperature is higher and pCO2lower than
near-shore. The distribution of chlorophyll a shows that the phytoplanktonic biomass is higher near-shore probably due to the input of nutrients by upwelling. This shows that along the Portuguese coast, active upwelling is confined to a relatively narrow near-shore tongue of water. It also shows that the second leg of the September 1999 cruise corresponded to a strong active upwelling event and that the lower pCO2 and higher temperatures in the RBA than in
the CFA (Table 1) are not related to a bias in data integration.
Fig. 8 shows two transects carried out on the 21st of August 1998 that also allow to discuss the differ-ence between the RBA and the CFA from the point of view of synopticity since both areas were sampled within a few hours. These transects were carried out during a strong upwelling event as shown by the low temperatures measured in the CFA (see also Table 1). Overall, in the RBA, the temperature and %O2 are
higher and pCO2lower than in the CFA (Fig. 8A –
C). The distribution of these parameters is very ir-regular in the RBA as upwelled water seems to out-crop to the surface more intensely at some locations than others. The transect carried out close to the shelf break in the RBA shows a more homogeneous distribution of parameters than near-shore, with over-all slightly warmer water with lower pCO2 values.
This transect also shows that the differences between the RBA and the CFA are observed even under strong upwelling conditions and are independent of data integration.
4. Conclusions
The analysis of surface water pCO2versus
temper-ature from two selected cruises carried out during upwelling conditions shows that the distribution of pCO2over the continental shelf waters off the Galician
coast is controlled by two processes that have opposite effects: the input from upwelling of deep cold water with a high CO2content and primary production. In
nitrate-depleted surface waters, the distribution of pCO2is mainly controlled by temperature change.
The continental shelf off the Galician coast can be divided from the point of view of dissolved inorganic carbon into two distinct hydrographic regions: the Rı´as Baixas area and the Cape Finisterre area. The (spa-tially) averaged pCO2values are systematically lower
and temperature values higher in the Rı´as Baixas area than in the Cape Finisterre area. The analysis of transects carried out along the Portuguese coast on two occasions and of a transect covering both hydro-graphic regions within a few hours indicate that this is not related to the integration of data obtained over a relatively large time span (typical cruise duration f 10 days).
The difference between the two hydrographic re-gions is mainly related to the combination of the outwelling from the Rı´as and the width of the con-tinental shelf. The effect of outwelling from the Rı´as was investigated from vertical profile data in front of the Rı´a of Vigo and six transects covering the Rı´a and the adjacent continental shelf. Outwelling of strongly CO2undersaturated water affects significantly during
upwelling relaxation events the adjacent inner conti-nental shelf but to a much lesser extent the outer con-tinental shelf. Furthermore, during active upwelling events, over the inner continental shelf, the outwelled water mixes with surrounding shelf water and with ENAW that upwells directly on the shelf.
In the Cape Finisterre area, the continental shelf is narrower than in the Rı´as Baixas area. Also, the ratio between the surface area and the length of the shelf break is lower in the Cape Finisterre area. This implies that the ratio between the volume of upwelled water to the volume of water on the shelf is higher in the Cape Finisterre area. Very simple simulations show that the lower temperature and higher pCO2 values in the
Cape Finisterre area can be explained to some extent by this topographic feature.
Acknowledgements
The authors would like to thank the officers and crew of the R.V. Belgica and the R.R.S. Charles Dar-win for the welcome on board, X.A. A´ lvarez-Salgado (IIM, Spain), L. Chou (ULB, Belgium) and M. Elskens (VUB, Belgium) for sharing data, MUMM (Belgium) and RVS (UK) for the thermosalinograph data, C. Daemers (ULg, Belgium) for oxygen analysis, R. Biondo and E. Libert (ULg, Belgium) for technical assistance, J. Loncar and A. Fairclough (BODC, UK) for data management and two anonymous reviewers for pertinent comments that greatly improved the quality of a previous version of the manuscript. This work was funded by the European Commission (OMEX II project, MAST programme, contract MAS3-CT97-0076). Alberto Vieira Borges received financial support from the Fonds pour la Formation a` la Recherche dans l’Industrie et l’Agriculture (Bel-gium) and the European Commission (EUROTROPH project, No. EVK3-CT-2000-00040). Michel Frank-ignoulle is a research associate at the Fonds National de la Recherche Scientifique (Belgium). This is Eloise contribution number 256/27.
References
Alongi, D.M. (Ed.), 1988. In: Coastal Ecosystem Processes. CRC Press, New York, 419 pp.
A´ lvarez-Salgado, X.A., Roso´n, G., Pe´rez, F.F., Pazos, Y., 1993. Hydrographic variability off the Rı´as Baixas (NW Spain) during the upwelling season. J. Geophys. Res. 98 (C8), 14445 – 14447. A´ lvarez-Salgado, X.A., Doval, M.D., Pe´rez, F.F., 1999. Dissolved organic matter in shelf waters off the Rı´a de Vigo (NW Iberian upwelling system). J. Mar. Syst. 18, 383 – 394.
A´ lvarez-Salgado, X.A., Doval, M.D., Borges, A.V., Joint, I., Frank-ignoulle, M., Woodward, E.M.S., Figueiras, F.G., 2002. Off-shelf fluxes of labile materials by an upwelling filament in the NW Iberian upwelling system. Prog. Oceanogr. 51 (2 – 4), 321 – 337. Arar, E.J., Collins, G.B., 1997. In vitro determination of chlorophyll a and pheophytin a in marine and freshwater phytoplankton by fluorescence. Methods for the Determination of Chemical Sub-stances in Marine and Estuarine Environmental Matrices, vol. 445. US Environmental Protection Agency, Cincinnati, pp. 1 – 22. Bakker, D.C.E., de Baar, H.J.W., de Jong, E., 1999. The dependence on temperature and salinity of dissolved inorganic carbon in the East Atlantic surface waters. Mar. Chem. 65, 263 – 280. Benson, B.B., Krause, D., 1984. The concentration and isotopic
fractionation of oxygen dissolved in freshwater and seawater in equilibrium with the atmosphere. Limnol. Oceanogr. 29, 620 – 632.
Borges, A.V., Frankignoulle, M., 1999. Daily and seasonal varia-tions of the partial pressure of CO2in surface seawater along the
Belgian and southern Dutch coastal areas. J. Mar. Syst. 19, 251 – 266.
Borges, A.V., Frankignoulle, M., 2002a. Distribution of surface carbon dioxide and air – sea exchange in the upwelling system off the Galician coast. Global Biogeochem. Cycles, in press. Borges, A.V., Frankignoulle, M., 2002b. Short-term variations of
the partial pressure of CO2 in surface waters of the Galician
upwelling system. Prog. Oceanogr. 51 (2 – 4), 208 – 302. Castro, C.G., Pe´rez, F.F., Alvarez-Salgado, X.A., Ro´son, G., Rı´os,
A.F., 1994. Hydrographic conditions associated with the relax-ation of an upwelling event off the Galician coast (NW Spain). J. Geophys. Res. 99 (C3), 5135 – 5147.
Copin-Monte´gut, C., 1988. A new formula for the effect of temper-ature on the partial pressure of carbon dioxide in seawater. Mar. Chem. 25, 29 – 37.
Copin-Monte´gut, C., Raimbault, P., 1994. The Peruvian upwelling near 15jS in August 1986: results of continuous measurements of physical and chemical properties between 0 and 200 m depth. Deep-Sea Res., Part I 41, 439 – 467.
Copin-Monte´gut, C., Avril, B., 1995. Continuous measurements in surface water of the Northeastern tropical Atlantic. Tellus 47B, 86 – 92.
Culkin, F., 1965. The major constituents of seawater. In: Riley, J.P., Skirrow, G. (Eds.), Chemical Oceanography, vol. 2. Academic Press, London, pp. 121 – 161.
Dickson, A.G., 1990. Thermodynamics of the dissociation of boric acid in synthetic sea water from 273.15 to 298.15 K. Deep-Sea Res. 37, 755 – 766.
Dickson, A.G., 1993. pH buffers for seawater media based on the total hydrogen ion concentration scale. Deep-Sea Res. 40, 107 – 118.
DOE, 1994. In: Dickson, A.G., Goyet, C. (Eds.), Handbook of Methods for the Analysis of the Various Parameters of the Car-bon Dioxide System in Sea Water. US Department of Energy, Oak Ridge, ORNL/CDIAC-74.
Doval, M.D., A´ lvarez-Salgado, X.A., Pe´rez, F.F., 1997. Dissolved organic matter in a temperate embayment affected by coastal upwelling. Mar. Ecol. Prog. Ser. 157, 21 – 37.
Fraga, F., 1981. Upwelling off the Galician coast, Nothwest Spain. In: Richards, F.A. (Ed.), Coastal Upwelling. Coastal and Estuar-ine Science, vol. 1. AGU, Washington, DC, pp. 176 – 182. Fraga, F., Mourin˜o, C., Manrı´quez, M., 1982. Las massas de agua en
la costa de Galicia: junio – octubre. Res. Exp. Cient. 10, 51 – 77. Frankignoulle, M., Borges, A.V., 2001. European continental shelf as a significant sink for atmospheric carbon dioxide. Global Biogeochem. Cycles 15 (3), 569 – 576.
Frankignoulle, M., Abril, G., Borges, A., Bourge, I., Canon, C., Delille, B., Libert, E., The´ate, J.-M., 1998. Carbon dioxide emission from European estuaries. Science 282, 434 – 436. Frankignoulle, M., Borges, A., Biondo, R., 2001. A new design of
equilibrator to monitor carbon dioxide in highly dynamic and turbid environments. Water Res. 35/5, 1344 – 1347.
Gattuso, J.-P., Frankignoulle, M., Wollast, R., 1998. Carbon and carbonate metabolism in coastal aquatic ecosystems. Annu. Rev. Ecol. Syst. 29, 405 – 433.
Goyet, C., Millero, F.J., O’Sullivan, D.W., Eischeid, G., McCue, S.J., Bellerby, R.G.J., 1998. Temporal variations of pCO2in
surface seawater of the Arabian Sea in 1995. Deep-Sea Res. 45, 609 – 623.
Haynes, R., Barton, E.D., Pilling, I., 1993. Development, persis-tence, and variability of upwelling filaments off the Atlantic coast of the Iberian Peninsula. J. Geophys. Res. 98 (C12), 22681 – 22692.
Huthnance, J.M., van Aken, H.M., White, M., Barton, E.D., Le Cann, B.L., Coelho, E.M., Fanjul, E.A., Miller, P., Vitorino, J., 2002. Ocean margin exchanges — water flux estimates. J. Mar. Syst. 32 (this issue).
Keeling, C.D., Whorf, T.P., 1999. Atmospheric CO2records from
sites in the SIO air sampling network. Trends: A Compendium of Data on Global Change. Carbon Dioxide Information Anal-ysis Center, Oak Ridge National Laboratory, US Department of Energy, Oak Ridge, TN.
Kelley, J.J., Hood, D.W., 1971. Carbon dioxide in the Pacific Ocean and Bearing Sea: upwelling and mixing. J. Geophys. Res. 76, 745 – 753.
Ko¨rtzinger, A., Duinker, J.C., Mintrop, L., 1997. Strong CO2
emis-sions from the Arabian Sea during South-West Monsoon. Geo-phys. Res. Lett. 24, 1763 – 1766.
Lefe`vre, N., Moore, G., Aiken, J., Watson, A., Cooper, D., Ling, R., 1998. Variability of pCO2in the tropical Atlantic in 1995. J.
Geophys. Res. 103 (C3), 5623 – 5634.
Liss, P.S., Merlivat, L., 1986. Air – sea exchanges rates: introduction and synthesis. In: Buat-Me´nard, P. (Ed.), The Role of Air – Sea Exchange in Geochemical Cycling. NATO ASI Series, Reidel, Utrecht, pp. 113 – 128.
Nogueira, E., Pe´rez, F.F., Rı´os, A.F., 1997. Modelling thermohaline properties in an estuarine upwelling ecosystem (Rı´a of Vigo: NW Spain) using Box – Jenkins transfer function models. Es-tuarine, Coastal Shelf Sci. 44, 685 – 702.
Nogueira, E., Pe´rez, F.F., Rı´os, A.F., 1998. Modelling nutrients and chlorophyll a time series in an estuarine upwelling ecosystem (Rı´a of Vigo: NW Spain) using the Box – Jenkins approach. Estuarine, Coastal Shelf Sci. 46, 267 – 286.
Pe´rez, F.F, Rı´os, A.F., Roso´n, G., 1999. Sea surface carbon dioxide off the Iberian Peninsula (North Eastern Atlantic Ocean). J. Mar. Syst. 19, 27 – 46.
Roy, R.N., Roy, L.N., Vogel, K.M., Porter-Moore, C., Pearson, T., Good, C.E., Millero, F.J., Cambell, D.J., 1993. Determination of the ionization constants of carbonic acid in seawater in salinities 5 to 45 and temperatures 0 to 45 jC. Mar. Chem. 44, 249 – 267. Sarmiento, J.L., Murnane, R., Le Que´re´, C., 1995. Air – sea CO2
transfer and the carbon budget of the North Atlantic. Philos. Trans. R. Soc. London, Ser. B 348, 211 – 219.
Simpson, J.J., 1984. On the exchange of oxygen and carbon dioxide between ocean and atmosphere in an eastern boundary current. In: Brutsaert, W., Jirka, G.H. (Eds.), Gas Transfer at Water Surfaces. Reidel, Dordrecht, pp. 505 – 514.
Simpson, J.J., Zirino, A., 1980. Biological control of pH in the Peruvian coastal upwelling area. Deep-Sea Res. 27, 234 – 248. Stevens, I., Hamann, M., Johnson, J.A., Fiu´za, A.F.G., 2000.
Com-parison between a fine resolution model and observations in the Iberian shelf-slope region. J. Mar. Syst. 26, 53 – 74.
Takahashi, T., Takahashi, T.T., Sutherland, S.C., 1995. An assess-ment of the role of the North Atlantic as a CO2sink. Philos.
Trans. R. Soc. London, Ser. B 348, 143 – 152.
Tans, P.P., Fung, I.Y., Takahashi, T., 1990. Observational constraints on the global atmospheric CO2 budget. Science 247, 1431 –
1438.
Tenore, K.R., Alonso-Noval, M., Alvarez-Ossorio, M., Atkinson, L.P., Cabanas, J.M., Cal, R.M., Campos, H.J., Castillejo, F., Chesney, E.J., Gonzalez, N., Hanson, R.B., McClain, C.R., Mir-anda, A., Roman, M.R., Sanchez, J., Santiago, G., Valdes, L., Varela, M., Yoder, J., 1995. Fisheries and oceanography off Ga-licia, NW Spain: mesoscale spatial and temporal changes in physical processes and resultant patterns of biological productiv-ity. J. Geophys. Res. 100 (C6), 10943 – 10966.
Thomas, H., Schneider, B., 1999. The seasonal cycle of carbon dioxide in Baltic Sea surface waters. J. Mar. Syst. 22, 53 – 67. Tilstone, G.H., Figueiras, F.G., Fermı´n, E.G., Arbones, D., 1999.
Significance of nanoplankton photosynthesis and primary pro-duction in a coastal upwelling system (Rı´a of Vigo, NW Spain). Mar. Ecol. Prog. Ser. 183, 13 – 27.
Torres, R., Turner, D.R., Silva, N., Rutllant, J., 1999. High short-term variability of CO2fluxes during an upwelling event off the
Chilean coast at 30jS. Deep-Sea Res., Part I 46, 1161 – 1179. Tsunogai, S., Watanabe, S., Sato, T., 1999. Is there a ‘‘continental
shelf pump’’ for the absorption of atmospheric CO2? Tellus
51B, 701 – 712.
van Green, A., Takesue, R.K., Goddard, J., Takahashi, T., Barth, J.A., Smith, R.L., 2000. Carbon and nutrient dynamics during coastal upwelling off Cape Blanco, Oregon. Deep-Sea Res., Part II 47, 975 – 1002.
Walsh, J.J. (Ed.), 1988. On the Nature of Continental Shelves. Aca-demic Press, New York, 520 pp.
Walsh, J.J., 1991. Importance of continental margins in the marine biogeochemical cycling of carbon and nitrogen. Nature 350, 53 – 55.
Wang, S.-L., Chen, C.-T.A., Hong, G.-H., Chung, C.-S., 2000. Car-bon dioxide and related parameters in the East China Sea. Cont. Shelf Res. 20, 525 – 544.
Wanninkhof, R., 1992. Relationship between wind speed and gas exchange over the ocean. J. Geophys. Res. 97 (C5), 7373 – 7382.
Weiss, R.F., 1974. Carbon dioxide in water and seawater: the sol-ubility of a non-ideal gas. Mar. Chem. 2, 203 – 215.
Wollast, R., 1998. Evaluation and comparison of the global carbon cycle in the coastal zone and in the open ocean. In: Brink, K.H., Robinson, A.R. (Eds.), The Sea, vol. 10. Wiley, New York, pp. 213 – 252.