HAL Id: hal-03138616
https://hal.inrae.fr/hal-03138616
Submitted on 7 Jun 2021HAL is a multi-disciplinary open access archive for the deposit and dissemination of sci-entific research documents, whether they are pub-lished or not. The documents may come from teaching and research institutions in France or abroad, or from public or private research centers.
L’archive ouverte pluridisciplinaire HAL, est destinée au dépôt et à la diffusion de documents scientifiques de niveau recherche, publiés ou non, émanant des établissements d’enseignement et de recherche français ou étrangers, des laboratoires publics ou privés.
Vegetation cover at the water surface best explains seed
retention in open channels
Gabrielle Rudi, Gilles Belaud, Sébastien Troiano, Jean-Stéphane Bailly,
Fabrice Vinatier
To cite this version:
Gabrielle Rudi, Gilles Belaud, Sébastien Troiano, Jean-Stéphane Bailly, Fabrice Vinatier. Vegetation cover at the water surface best explains seed retention in open channels. Ecohydrology, Wiley, 2021, 14 (2), pp.e2263. �10.1002/eco.2263�. �hal-03138616�
1 1
Title: Vegetation cover at the water surface best explains seed retention in open channels
2Short title: Vegetation cover at the water surface best explains seed retention
34 5
Authors : Gabrielle RUDIa*, Gilles BELAUDb, Sébastien TROIANOa, Jean-Stéphane BAILLYac,
6
Fabrice VINATIERa
7 8
a LISAH, Univ Montpellier, INRAE, Institut Agro, IRD, Montpellier, France 9
b G-Eau, Univ Montpellier, AgroParisTech, CIRAD, INRAE, Institut Agro, IRD, 10
Montpellier, France 11
c AgroParisTech, 75005, Paris, France 12
13 14
* Corresponding author – 2 place Pierre Viala, 34060 Montpellier, France 15 [email protected] 16 17 18 ABSTRACT 19 20
Hydrochorous dispersal through agricultural channels plays a role in structuring plant communities 21
across agricultural landscapes. To date, research on seed retention in vegetated areas has mainly 22
focused on vegetation types with simple architecture (often cylinders), which consequently do not 23
represent real vegetation features. Here, we test the hypothesis that vegetation cover estimated at the 24
water surface best explains floating seed retention in open channels. We therefore proposed an 25
experiment to measure seed retention in a controlled environment across a large range of hydraulic 26
conditions and vegetation architecture types. We used three types of artificial plants with 27
contrasting morphotypes, and real seeds of Rumex crispus. Vegetation metrics were calculated on 28
the basis of 3D plant models. We also tested the additivity of seed retention as a function of the 29
length of vegetated area crossed by the seeds. We developed a semi-empirical formula for 30
predicting seed retention. The main results of the experiment show that (i) the seed retention rate 31
reacts differently to changes in density according to species (ii) vegetation cover at the free water 32
surface, potentially in contact with seeds, is a generic predictor of floating seed retention whatever 33
the nature of the vegetated cover (iii) 95% of seed retention was reached for a large range of surface 34
vegetation ratios and length of vegetation cover. The proposed formula could be used by 35
2
stakeholders (farmers and ecologists) to estimate the amount of vegetation needed in a channel to 36
limit or enhance seed dispersal. 37
38
Keywords (max 8): Vegetated channel; Agricultural drainage networks; Propagule dispersal; 39
Vegetation porosity; Vegetation metrics; Hydrochory; Rumex crispus; 3D plant model 40
41
1. INTRODUCTION 42
43
Hydrochorous dispersal plays a major role in structuring vegetation communities (Gurnell et al., 44
2006; Nilsson et al., 1991, 2010; Ridley, 1930). In agricultural areas, some plant species are able to 45
travel hundreds of metres via semi-natural waterways, such as ditches or irrigation channels (Rudi 46
et al., 2018; Soomers et al., 2010; van Dijk et al., 2014). Plant dispersal can therefore be favoured 47
by a network-like organization of waterways, and propagules can readily travel through the 48
agricultural landscape, either causing economic losses for farmers when the propagules compete 49
with their crops (Petit et al., 2011), or contributing to the maintenance of community species 50
richness and increasing genetic diversity in populations (Nilsson et al., 2010). Plant richness in 51
agricultural channels provides numerous microhabitat types and contributes to the connection of 52
populations of mobile organisms, including amphibians, mammals and insects, which would 53
otherwise be isolated in intensively cropped areas (Dollinger et al., 2015). 54
55
The interplay between propagule features, hydrodynamic characteristics and waterway properties 56
drives propagule dispersal (Greet et al., 2011, 2012; Hyslop and Trowsdale, 2012). The propagules’ 57
features, especially those determining the duration of buoyancy (Boedeltje et al., 2003; Carthey et 58
al., 2016; Riis and Sand Jensen, 2006), are important factors for explaining the distance of 59
transportation by water in natural ecosystems. The ability to float is mostly linked with the features 60
of the propagules, such as density, size and shape. For floating propagules, the mean flow velocity 61
(Defina and Peruzzo, 2010) and turbulent diffusion (White and Nepf, 2003) as well as 62
hydrodynamic conditions at the water surface, can be related to the rates of deposition in the 63
channels (Merritt and Wohl, 2002). Other retention factors include the presence and abundance of 64
vegetation (Chambert and James, 2009; Cornacchia et al 2019, Defina and Peruzzo, 2010; Liu et al
65
2019; Peruzzo et al. 2012, 2016), and vegetation type (Jager et al., 2019), especially in narrow 66
agricultural waterways, such as channels and ditches (Rudi et al., 2018; Rudi et al., 2020; Soomers 67
et al., 2010). 68
3
At the local scale, Defina and Peruzzo (2010) describe two mechanisms for temporary trapping of
70
propagules in emergent vegetation: (i) wake trapping, in which the propagules are retained in the
71
recirculation zone behind a plant (White and Nepf, 2003), and (ii) inertial impaction, in which the
72
inertia of a propagule allows it to escape from the streamline and meet a stem (Palmer et al., 2004);
73
and two possible mechanisms of permanent trapping: (i) net trapping, in which a bunch of stems or
74
leaves forms a net-like structure, and (ii) the "Cheerios effect" (Vella and Mahadeven, 2005), which
75
is explained by the deformation of the water surface linked with surface tension. For permanent
76
propagule retention, note that the Cheerios effect is significant when the spacing between stems is
77
greater than the propagule size and in slow-flowing conditions (Chambert and James, 2009). Some
78
semi-empirical models have been developed to characterize propagule retention distances in
79
vegetated media relying on channel experiments (Defina and Peruzzo, 2010; Liu et al 2019;
80
Peruzzo et al., 2012, 2016). These models have been mainly developed for slow flowing water and
81
low to medium vegetation densities and focused mainly on the Cheerios effect. They described the
82
probability of interaction and capture of propagules in vegetation. As described by Defina and
83
Peruzzo (2012), the probability that a propagule reaches a specific distance depends on the
84
propagule mean path length before permanent capture, the probability of interaction, the probability
85
of permanent capture, and the mean centre-to-centre spacing between stems. In these experiments,
86
the vegetation has usually been represented with rigid arrays, except in Defina and Peruzzo (2010,
87
2012), who used flexible plastic plants. The vegetation metrics used in the developed models are the
88
mean centre-to-centre distance between stems, the mean spacing between adjacent cylinders (taking
89
into account the stem diameter), and the density of plants (Defina and Peruzzo, 2010, 2012; Liu et
90
al. 2019, Peruzzo et al. 2012, 2016).
91 92
However, in field conditions, complex vegetation patterns are frequently observed. Vegetation
93
exhibits a vertical variability, and consequently, the area of vegetation at the water surface that can
94
potentially interact with propagules varies with the fluctuations in the water level. There is currently
95
a lack of vegetation metrics and semi-empirical generic formulas able to predict the rates of
96
propagule retention in the large range of hydrodynamic conditions observed in the field. Some
97
attempts have been made to measure the percentage of plant cover at the water surface (Rudi et al.,
98
2018) or the plant cover "porosity" (Vinatier et al., 2018) for real plant covers to characterize
99
patterns of propagule deposition along agricultural channels. In these experiments, the tallest layers
100
of vegetation hid the vegetation at the water surface and made it difficult to reconstruct the patterns
101
of vegetation cover at the water surface. Moreover, as pointed out by Green (2005), the vertical
102
heterogeneity of the vegetation profile needs to be taken into account in studies focusing on
103
interactions between vegetation and fluxes of matter. Testing the importance of the specific
4
vegetation surface permeability to propagules against other traditional metrics describing the
105
vegetation cover seems necessary for a better comprehension of hydrochory.
106 107
The study was motivated by questions on the retention ability of terrestrial and semi-aquatic 108
vegetation growing in agricultural channels and ditches in Mediterranean areas. One of the 109
specificities of these patches is that they generally cover the total width of the channels, and form a 110
relatively homogeneous cover. As will be detailed below, the experimental set-up therefore reflects 111
the conditions commonly observed in these systems. 112
113
In this study, floating seed retention in vegetated channels is investigated, focusing on a large range 114
of plant densities for three different types of emergent vegetation with complex architectures, 115
representative of the types of vegetation that can be found in agricultural drainage or irrigation 116
channels with medium velocity flow conditions. We hypothesized that vegetation cover estimated 117
for the fine layer constituting the water flow surface is the best predictor of seed retention compared 118
to other vegetation metrics. The specific purpose of the study was (i) to investigate seed retention 119
rates in various artificial plant covers that closely reproduce the plant covers observed in the field, 120
(ii) to test the hypothesis of additivity of seed retention according to the length of the vegetated 121
area, and (iii) to establish a semi-empirical retention function based on two components depending 122
on plant metrics and hydrodynamic conditions to test the relevance of the vegetation cover at the 123
surface to explain seed retention. 124
125
2. MATERIALS AND METHODS 126
127
2.1. Experimental channel design 128
129
The experiments were conducted in controlled hydraulic conditions in an experimental cement 130
channel located at the Institut Agro – Montpellier SupAgro (Montpellier, France). The channel is 131
rectangular (9 m long and 0.66 m wide) (Figure 1). The slope is 0.0013 m/m. This channel was 132
chosen because its dimensions were consistent with those of the channels and ditches found in 133
southern France and with the morphologies of those channels, in which flows are generally 134
subcritical and turbulent. Commonly observed Froude and Reynolds numbers of these systems 135
could be reproduced in the channel. The water inflow was regulated thanks to a control structure 136
(constant level gate followed by baffle module weirs) ensuring a constant discharge (±5%). Then, a 137
flow tranquilizer followed by a 5-metre reach ensured the formation of a well-established flow 138
upstream of the channel. The downstream water level was controlled by a rectangular weir with a 139
5
sill of 10 cm. At the end of the channel, a net was placed to collect seeds. The water was then 140
filtered and recycled through the closed system. 141
142
Figure 1: Schematic representation of the experimental channel. 143
144 145
The selected steady-state flow rates varied from 10 L.s-1 to 40 L.s-1, determined with an accuracy of
146
+-5% (Vinatier et al., 2017). The range of variation in the discharges is based on the heights of the 147
plants, in such a way that plants are never submerged. 148
149
2.2 Plant material and its spatial arrangement 150
151
Three types of plastic plants of different architectures were chosen for the experiment: a Cyperaceae 152
(Isolepis sp.), a Cupressaceae (Thuja sp.) and a Buxaceae (Buxus sp.) 153
(https://www.artificielles.com) (Figure 2). We chose these types of plants because they represented 154
a diversity of architectural topologies characteristic of the plant diversity found in intermittent 155
agricultural channels. The Cyperaceae morphotype represented by Isolepis sp. (thin and elongated) 156
is similar to the grasses frequently encountered in channel banks, colonizing an intermediate 157
ecological niche between terrestrial and wetland environments. The Cupressaceae morphotype 158
(Thuja sp.) is characteristic of shrubby vegetation encountered in less well-managed channels. The 159
Buxaceae morphotype (Buxus sp.) is similar to that of some Asteraceae found in the bottoms of 160
channels, with a specific architecture consisting of a long stem surmounted by a vegetative spike. 161
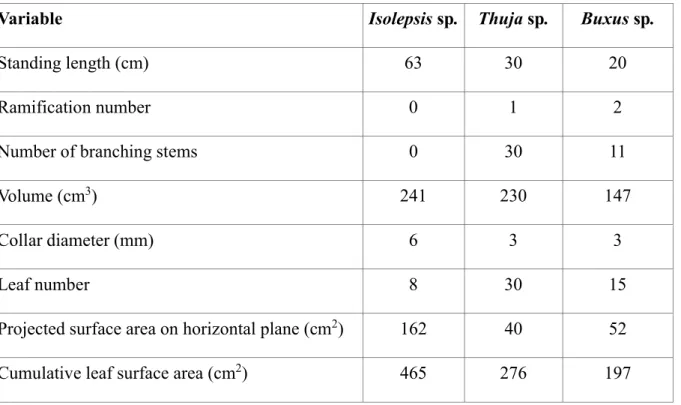
Table 1 presents the diversity of morphological characteristics of the studied artificial plants. 162
6
Figure 2: (a) 2D representations of the three plants (Isolepis sp., Thuja sp. and Buxus sp., from 164
left to right) used for the experiment and (b) the vertical profile of their surface area 165
according to a horizontal plane. 166
167
168 169 170
The plants were fixed on concrete panels (0.66*0.60 m) drilled with 144 holes, i.e., approximately 171
362 holes/m2, filled with screw anchors to fix the plants. Fourteen densities were established in a
172
staggered pattern, representing the variability in natural plant densities found in ditches (Rudi, pers. 173
com). A picture of the vegetated area with a medium density (36 plants per concrete panel) from 174
above the channel for two panels is presented inFigure 3. The arrangement of plants in the channel 175
for all the density configurations is provided in Appendix A. Note that for all the density 176
configurations, the vegetation filled the channel width and was homogeneously distributed in the 177 channel. 178 179 180 181 182 183
7
Figure 3: Picture of the vegetated area (Isolepis sp.) in the experimental channel (36 plants per 184
concrete panel on two panels). 185
186 187 188
2.3. Overview of the experiments 189
190
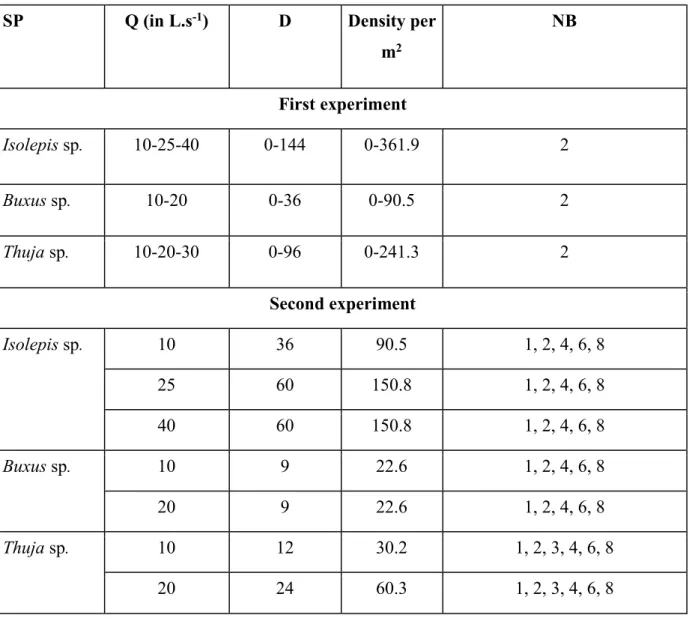
Two seed release experiments were conducted in the experimental channel. The first experiment 191
aimed to characterize the retention rate of seeds in patches of vegetation with constant lengths (over 192
the length of two concrete panels, i.e., 1.2 m, with different plant density configurations, see Table 193
2) to assess the interactive effects of density per panel (D), species (SP) and discharge (Q) on seed 194
retention. In the second experiment, the same plant density was planted on one to eight panels (i.e., 195
0.6 to 4.8 metres) to characterize the effect of the length of the patch (where NB is the number of 196
panels) on the seed retention and test the hypothesis of additivity of seed retention (Table 2). It is 197
important to note that for the second experiment, discharge and density were chosen to explore the 198
largest range of retention rates from one panel to 8 panels and differed for each species. A trial 199
without plants was conducted for each discharge tested in the experiment. Moreover, the results 200
from these two experiments were used to calibrate the developed model of seed retention based on 201
new vegetation metrics. 202
8 204
205 206
2.4 Seed release and counting 207
208
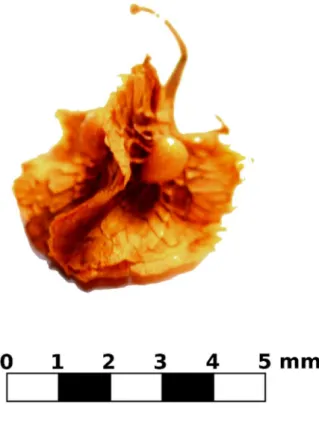
Seeds from curly dock (Rumex crispus) (Figure 4) were collected in Lattes (Hérault, France) in 209
October 2018. This weed was chosen because it is common in rural areas, and its seeds have the 210
potential to disperse via flow because they are contained in the calyx of the flower which has good 211
buoyancy (Uva et al., 1997). The buoyancy of the collected seeds was assessed by immerging 200 212
seeds in 10 pots of water (20 seeds per pot) for 5 days. This experiment showed that 100% of the 213
seeds were buoyant during the first 10 h of immersion (details of the experiment are provided in 214
Appendix B). This was consistent with the results of Cavers and Harper (1964) and Favre-Bac et al. 215
(2017), who classified R. crispus seeds as having long-term buoyancy compared to other species. 216
The weight of the seeds (5.35 mg (+/- 0.68 mg)) was estimated from the measurement of 10 lots of 217
10 seeds with a high-precision scale (Precisa XB 160M; precision: 0.001 g; accuracy: 0.01 g). The 218
seed diameter was measured as the average of 50 seeds (4.96 mm (+/- 0.76), including the calyx) 219
with a calliper. 220
221
Figure 4: Picture of a curly dock (Rumex crispus) seed 222
223
9 225
During the experiment, following the Eulerian framework described in Defina and Peruzzo (2010), 226
lots of 50 seeds were released at the head of the channel in the seed release area using a 60 cm-long 227
piece of metal. The lots were distributed homogeneously using this piece of metal, which covered 228
the width of the channel. For each release, we counted the seeds that travelled to the end of the 229
channel after a defined amount of time, depending on the length of the patch and the water 230
discharge. The retention rate of seeds was calculated according to the following formula: 231
232
𝑅 (𝑥) = Equation 1 233
234
where 𝑅 (𝑥) is the retention rate over a vegetated distance of x metres, 𝑁 is the number of 235
seeds in each release (50 for this experiment) and 𝑁 is the number of seeds reaching the tail end 236
of the experimental channel. Each release was repeated three times for one set of Q, SP and D. 237
238
Following Defina and Peruzzo (2010), we estimated that seeds were permanently trapped after a 239
period equal to one order of magnitude above the mean travel time of a seed for the whole test 240
section. For the first experiment (with two vegetated panels), this period was set at 2 min and 1 min 241
30 s for discharges equal to 10 L.s-1 and above 10 L.s-1, respectively, which is in accordance with 242
the period of 2 min set in Cornacchia et al. (2019), and with preliminary tests showing that there 243
was no seed release once these time limits were exceeded. For the second experiment, we adapted 244
the period to the number of vegetated panels, by multiplying the length of the period according to 245
the total number of vegetated panels, based on the periods chosen for two vegetated panels. For 246
each release, when the time elapsed, we collected all the seeds trapped in the patch of vegetation 247
before the next release. In total, 264 releases of 50 seeds were made in the first experiment and 111 248
in the second experiment, representing 18750 released seeds in total. 249
250
2.5. Characterization of the seed retention rates relative to the experimental variables 251
252
The effects of the experimental variables and their interactions on the Rr were analysed using a
253
binomial generalized linear model with logit link function (analysis of deviance with binomial 254
error). The experimental variables were Q, D, SP, and NB. The significance of each variable was 255
assessed via the change in deviance between the models with and without the variable. 256
Overdispersion was accounted for using quasi-binomial instead of binomial models. 257
10
For each combination of SP x Q for the first experiment (2 panels, corresponding to a distance of 259
1.20 metres), a sigmoid curve with the form 260
𝑅 (1.2) =
×( ) Equation 2 261
is fitted using the nonlinear least squares method to obtain D50 (the density needed to reach 50%
262
seed retention) and the slope of the linear relation between D and Rr.
263 264
2.6. Characterization of the vegetation metrics 265
266
Among the different metrics describing the influence of vegetation on ecohydrological processes 267
are the proportion of surface area containing vegetation (Green, 2005), the percentage of submerged 268
or emergent vegetation (Rudi et al., 2018), and the porosity of the vertical section of a channel 269
induced by vegetation (Vinatier et al., 2018); we reviewed all of these metrics to test the hypothesis 270
that vegetation at the water surface is the best predictor of seed retention. 271
272
Because of the complexity of the architecture of individual plants, there are no simple 273
measurements of the vegetation cover metrics, especially for the vegetation area in the thin slice 274
corresponding to the water surface that can potentially interact with the floating seeds. 275
Consequently, we constructed a three-dimensional model of each of the three artificial plants. This 276
was made possible because of the homogeneity of the artificial plants and their repetitive elements. 277
278
A 3D model of each plant was realized by first establishing a master of all plant attributes. Each leaf 279
of the artificial plant has been cut, numbered and scanned using a professional scanner (600 dpi 280
resolution). Leaf thickness, stem diameters and spacing between the different stem portions were 281
measured using a calliper. Orientations of leaves and stems were measured using a protractor. Then, 282
meshes of all plant attributes were assembled using CloudCompare software (Girardeau-Montaut 283
2014) to produce a continuous mesh for each plant. 284
285
After this step, different vegetation metrics were derived from the projection of the 3D plants on the 286
horizontal plane of the channel (Figure 5): 287
the projection of the whole plants on a horizontal plane, derived from the complete 3D 288
model (basis for calculation of Metrics 1), 289
the projected areas of the emergent and submerged vegetation (emergent and submerged 290
vegetation on Figure 5) on a horizontal plane, derived from the model cropped by a plane at 291
the level of the water surface (basis for calculation of Metrics 2 and 3), and 292
11
the area of the plant at the free surface of the water derived from the model sliced by two 293
planes at 1 mm above and below the water level (basis for calculation of Metrics 4) (surface 294
vegetation on Figure 5). 295
296
Figure 5: Illustration of the different types of vegetation metrics for a group representing the 297
plant arrangement for a given density. 298
299
300 301 302
The different areas were calculated from (i) the product of each individual projected area by plant 303
density for each experiment (“product” method) and (ii) a scene representing the 3D models 304
arranged according to the spatial patterns found for each density (“scene” method). By construction, 305
the overlapping surfaces of the high-density projections were summed in the “product” method and 306
were merged in the “scene” method. 307
308
Then, we calculated the ratio of occupation of each vegetated area by dividing the area occupied by 309
vegetation by the total planting area of the channel (on a horizontal plane) to obtain the four 310
vegetation metrics, called 𝑀𝑒𝑡𝑟𝑖𝑐𝑠 . 311 312 313 2.7. Characterization of hydrodynamics 314 315
The literature survey suggests that the hydrodynamic conditions at the water surface, and especially 316
the velocity at the water surface, largely influence the retention rates. More specifically, seeds are 317
transported with the current, and we expect their probability to pass the vegetation filter to increase 318
with turbulence. Therefore, we introduced the non-dimensional Reynolds number, ℜ, to 319
characterize the nature of the flow patterns: 320
12 321
ℜ = 𝑈 × 𝐻 𝑣⁄ Equation 3 322
323
where U corresponds to the average velocity over a section in m.s-1 (U=Q/(B*H)), H is the water
324
height in m (corresponding to the characteristic length), B the width of the experimental channel in 325
m, and ν is the kinematic viscosity in m2.s-1. Weakly turbulent flows (low Reynolds number) should
326
result in high retention rates (𝑅 →1) (in this case, surface tension will facilitate the capture by 327
vegetation stems), while highly turbulent flows (large ℜ) should result in low seed retention 328
(𝑅 →0). The range of the Reynolds numbers in our experiments was assessed between 15000 and 329
60000. 330
331
2.8. The additivity effect 332
333
Based on a constant probability of capture on each panel, we tested the additivity of our model 334
based on the following formula: 335
336
𝑅 (𝑥) = 1 − 1 − R (1.2) Equation 4 337
where 𝑥 is the vegetated distance travelled by the seeds (in metres), 𝑅 (1.2) is the mean 338
experimental retention value for two vegetated panels, and 𝑙 is the length of the two vegetated 339
panels, i.e., 1.2 metres. 340
341
2.9. The generic formula for seed retention 342
343
The relation linking 𝑅 to 𝑀𝑒𝑡𝑟𝑖𝑐𝑠 and ℜ could be approximated by an exponential model of the 344
form: 345
𝑅 (1.2) = 1 − 𝑒 ×ℜ× Equation 5 346
where a is a dimensionless parameter to estimate. The mathematical form respects the expected 347
trends between Rr and ℜ.
348 349
Combining Equation 4 and Equation 5, we obtained the generic formula for seed retention: 350 351 𝑅 (𝑥) = 1 − 𝑒 × ×ℜ× × Equation 6 352
13
Based on Equation 6, we tested what vegetation metrics best explained the seed retention rate (𝑅 ) 353
from the two experiments on the basis of the R2 and the RMSE between the estimated and observed
354 𝑅 (1.2). 355 356 2.10. Softwares 357 358
All the statistical analyses were performed using R software (R Core Team, 2017). The processing 359
of the 3D models was performed using dedicated R packages (Rvcg, Morpho and data.table). 360
361
3. RESULTS 362
363
3.1 Effect of density, discharge and type of species on seed capture 364
365
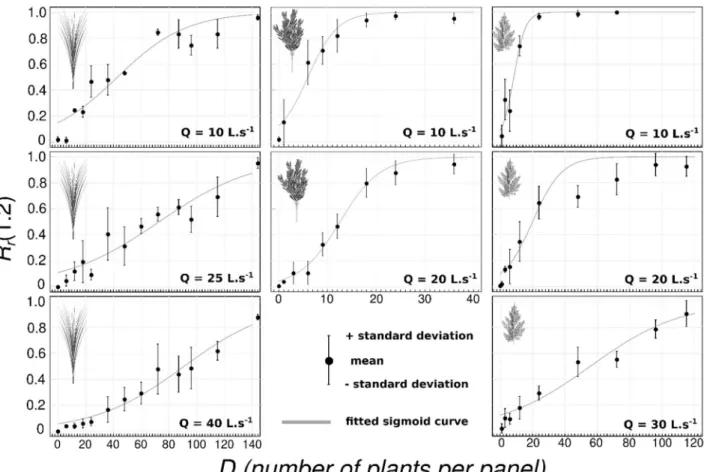
The results of the statistical analysis (Table 3) show that the discharge, density or type of species 366
significantly affects the rate of seed retention. The significant interaction between density and 367
species means that the seed capture rate react differently to changes in density according to species. 368
The results for the retention curves, as functions of plant density for each type of studied plant, are 369
presented in Figure 6. Fitted parameters are presented in Table 4. 370
371
Figure 6: Seed capture rates Rr as a function of plant density D (number of plants by panel)
372
for Isolepis sp. (first column), Buxus sp. (second column), and Thuja sp. (third column). The 373
solid line represents a sigmoid curve fitted using the nonlinear least squares method for each 374
combination of SP and Q. Fitted parameters are given in Table 4. 375
14 376
377 378
3.2. Additivity of the seed capture rate as a function of vegetation patch length 379
380
We first tested the significance of the influence of the number of vegetated panels on water height. 381
We found that in the conditions of the study, the number of panels had a non-significant influence 382
on water height (p-value = 0.123). This could be explained by the low density values tested for 383
additivity (therefore, the vegetation did not significantly affect the hydraulic resistance). 384
Consequently, we could neglect this effect in our experimental conditions. 385
386
The envelope of the additivity curve, extrapolated from the standard error of the 𝑅 (1.2), generally 387
encompasses the observed points for 1, 4, 6 and 8 panels (Figure 7). The global R2 of the proposed
388
model is 0.77 (+-0.16). 389
390 391
Figure 7: Comparison between the observed seed capture rates and predicted capture rates 392
based on the additivity formula for the three plants (Isolepis sp. (first column), Buxus sp. 393
(second column), and Thuja sp. (third column)). The mean and standard deviation (black points 394
and arrays) values were calculated on the 3 repetitions of seed release experiment. The grey point 395
15
and array is the mean and standard deviation for two vegetated panels, which served as a base for 396
the calculation of the envelope (light grey). 397
398
399 400 401
3.3. A generic formula for floating seed capture in differentiated plant covers 402
403
The calculated surface vegetation ratio was between approximately two-fold and ten-fold lower 404
than the whole, submerged and emergent vegetation ratios. The Pearson cross product correlation 405
test was significant between vegetation metrics (p < 0.001). However, the correlation is low 406
(0.2<cor<0.6) between surface vegetation and the other metrics, and higher (cor>0.6) when 407
comparing the metrics calculated by summing individual areas with the metrics calculated from a 408
scene (Figure 5). The metrics calculated from the “product” method exceeded the total area of the 409
channel, especially for the whole and emergent vegetation of Isolepis sp., due to the high degree of 410
overlap observed for this species. 411
412
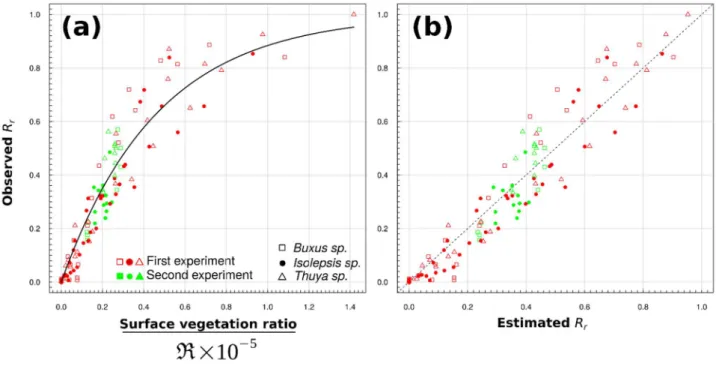
As shown in Table 5, the use of the surface vegetation ratio (Metrics 4) led to the best results 413
(R2=0.90 and RMSE=0.083 for the “scene” method, and R2=0.58 and RMSE=0.178 for the
414
“product” method), regardless of how it was calculated. Considering a scene representing real 415
16
spatial arrangements instead of the product of each individual plant area by density increased the 416
performance of the models. The metrics calculated for the total vegetation (Metrics 1) and the 417
emergent vegetation (Metrics 2) led to the worst results (R2<0.30 and RMSE>0.25).
418 419
Regarding the seed retention rate in the best model corresponding to the scene method and use of 420
“Surface vegetation ratio” metrics (Metrics 4) (R2=0.90 and RMSE=0.083), Figure 8 shows a
421
homogeneous dispersion of the whole dataset across the fitted model. The data from the second 422
experiment (additivity) were also included in the model, although they cover a lower range of 423
vegetation metrics and hydraulic conditions. In Table 6, we observed that every studied plant was 424
well fitted by the model. 425
426
Figure 8: (a) Seed capture rate (𝑅 ) as a function of the best combination of vegetation metrics 427
and ℜ. The solid line corresponds to the fit of the nonlinear model to the data. (b) Comparison 428
between the observed and estimated 𝑅 according to the model. The dashed line indicates a 429
perfect fit between the observation and estimation. 430 431 432 433 434 435 436 437 438
17
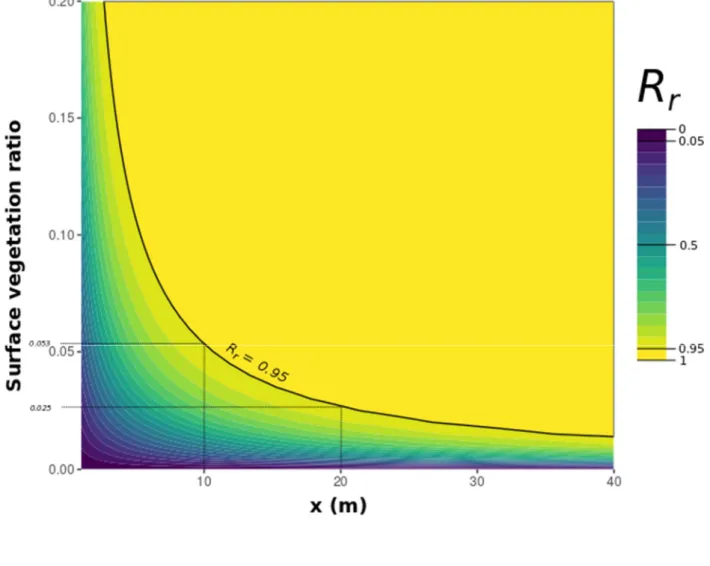
Figure 9 indicates that 95% seed retention was reached for a large range of surface vegetation ratios 439
and channel lengths (in hydrodynamic conditions allowing a Reynolds ℜ of 32000). Basically, with 440
an 𝑅 isoline equal to 0.95, channels of 10 metres and 20 metres retained 95% of the seeds if the 441
surface vegetation covered 5.3% and 2.5% of the water surface area, respectively. 442
443
Figure 9: Lattice plot based on the generic formula (Equation 6) and calibrated on the 444
experimental data for a surface vegetation ratio between 0 and 20% and a channel length 445
between 0 and 40 metres, with the ℜ value being fixed in the formula at 32 000 (which can 446
correspond, for example, to a water height of 15 cm and an average velocity of 0.21 m.s-1)
447 448 449 450 451 452 4. DISCUSSION 453 454
4.1. The area occupied by vegetation at the water surface is a relevant metric for seed 455
retention prediction in a vegetated cover 456
18 457
This experiment showed the relevance of using the area occupied by vegetation at the water surface 458
instead of the area calculated from the total, emergent or submerged vegetation as a predictor of the 459
seed capture rate in a vegetated channel. The use of the area occupied by vegetation at the water 460
surface is interesting when focusing on plant covers with varied morphologies, because this metric 461
is generic and works for the three types of vegetation covers tested. 462
463
In the experiment, the variations of discharge affected more the retention rates for Thuja sp. and 464
Buxus sp. than for Isolepis sp. This is due to the fact that discharge affects directly water height in 465
the channel, and the first two species display a greater variability of surface area according to water 466
height than Isolepis sp (see Figure 2b). 467
468
The additivity of the formula has been demonstrated on distances under 10 m with low vegetation 469
densities. Higher vegetation densities would exert a significant influence on hydraulic conditions, 470
especially height and velocity (Nepf, 2012), and the Reynolds number should be corrected as a 471
consequence. 472
473
Our results reinforce the idea that representing vegetation cover as a porous media is an efficient 474
approach for understanding water transport and particle transport in vegetated areas, as was 475
highlighted in recent works focused on interaction between water transport and vegetation (see 476
Rubol et al., 2018 and Vinatier et al., 2017 for example). However, in this experiment, the spatial 477
distribution of plants in the channel is relatively homogeneous. In configurations in which the 478
vegetation is heterogeneously distributed, preferential transfers are observed (Cornacchia et al., 479
2019; Erktan et al., 2013; Nepf et al., 2012). Indeed, the phenomena of flow divergence at the patch 480
scale explain these preferential transfers, which could be susceptible to modifications in the 481
relationship between the area occupied by vegetation and seed capture. 482
483
4.2. 3D representation of vegetation is an original and efficient method for characterizing 484
plant cover at the water surface 485
486
The 3D representation of vegetation is an efficient approach, especially in contexts of high plant 487
density or when plants are largely above the water level; in the latter case, techniques using 488
photographs to reconstruct the area covered by vegetation from above have poor accuracy (because 489
of the effect of sheltering), as revealed by our results. In situations in which we possess 3D models 490
for each type of plant encountered in agricultural channels, we could represent any vegetated cover 491
19
and calculate the area at the water surface. Moreover, in the future, 3D plant models could help to 492
calculate more evolved vegetation metrics commonly used in landscape ecology, such as core area 493
or patch cohesion formed by the vegetation at the water surface. 494
495
However, the use of 3D plant models has limits. First, the production of 3D models is time 496
consuming for real plants, and it would be even more time consuming if we wanted to create 497
models for plants at different phenological stages. Moreover, in this study, the hydrodynamic 498
conditions did not significantly modify the plant structure. However, plant reconfiguration has been 499
observed under some hydrodynamic conditions (Vogel, 1996), and the degree of bending is usually 500
a function of water velocity (Chapman et al., 2015; Luhar and Nepf, 2011) and height. The 3D 501
models that we developed would be improved by being able to bend under flow drag forces. The 502
integration of computational fluid dynamic tools, such as OpenFOAM (www.openfoam.com) or 503
Fluent (www.ansys.com), could allow the creation of this type of bowed plant model, but the 504
amplitude of reconfiguration, the flex points and the representation of the streamlining of leaves as 505
a function of water velocity still need to be characterized by further studies. 506
507
It will be necessary to test the effect of seed characteristics in the context of the main processes 508
controlling vegetation and seed interactions. It has been shown that seed traits such as weight, size, 509
density and shape influence interactions with vegetation when the Cheerios effect is the major 510
mechanism of seed retention (Chambert and James, 2009; Liu et al., 2019; Peruzzo et al., 2016), 511
i.e., when the water velocity is slow and the spacing between the stems of the vegetation is greater 512
than the particle diameter (Chambert and James, 2009; Liu et al., 2019; Peruzzo et al., 2016). In our 513
hydrodynamic conditions, with net trapping being the major mechanism of seed capture, it is 514
possible that seed features also influenced the rate of seed retention in our experiment. For example, 515
de Jager et al. (2019) showed that large seeds were less affected by net-trapping than smaller ones. 516
The number of seeds released in the channel should also be considered. In our experiments, we 517
observed that seeds sometimes formed clusters (due to the Cheerios effect) more susceptible to 518
being captured by vegetation, especially when vegetation presented indented patterns, as for Buxus 519
sp. and Thuja sp. 520
521
4.3. Implications for the agroecological management of agricultural channels 522
523
It has been shown that agricultural channels could be significant dispersal vectors for weeds 524
because they allow seeds to travel hundreds of metres in a few hours (Rudi et al., 2018; Soomers et 525
al., 2010). From a practical point of view, the developed formula provided an indication of the 526
20
surface vegetation cover needed for a given channel length to reach a specified objective of retained 527
seed rate. For portions of ditches of 10 metres, it would be necessary to have a surface vegetation 528
ratio of 5.3% to retain 95% of seeds (with a Reynolds of 32 000, see Figure 9). Considering that the 529
surface vegetation ratio is between twice and ten times lower than the total vegetation ratio (see 530
§3.3), vegetation coverage of 53% in the channel (5.3% * 10) should be sufficient to retain 95% of 531
the seeds transported by the channel. Previous studies of vegetation cover dynamics in agricultural 532
channels (Dollinger et al., 2017; Levavasseur et al., 2014) have revealed that management practices 533
were a lever to control vegetation cover in space and time, and we should then be able to control 534
hydrochorous seed dispersal through these management practices. 535
536
This work also confirms that water height variations, even moderate, play a role in the dispersal and 537
subsequent establishment of plants in agricultural waterways, as observed by Engström et al. (2009) 538
and Cornacchia et al. (2019) in other aquatic ecosystems. Consequently, in agricultural channels, 539
conserving a part of the vegetation that exceeds the maximal depth of the channel can guarantee 540
retention and limitation of dispersal. In this sense, tall plants (i.e., taller than 50 cm) can play a 541
preponderant role, because maximal depths in drainage channels and secondary/tertiary irrigation 542
channels are generally approximately 50 cm in the studied ecosystems. 543
544
The developed prediction formula for seed retention is rather easy to use and can serve to assess the 545
services of weed spreading limitation in agricultural landscapes or natural revegetation. Therefore, 546
it is well adapted to be integrated in studies assessing benches of ecosystem services provided by 547
vegetation of hydro-agricultural waterways such as ditches and channels (water transport regulation, 548
weed spreading limitation or enhancement, erosion limitation). Indeed, one of the drawbacks of 549
multifunctional studies is the need to choose between indicator-based approaches (such as biomass, 550
as a distant proxy for estimating the propagule retention capacity of vegetated channels), and 551
physical approaches (e.g., using advection-dispersion equations, which need parameterization and 552
substantial computing capacity and cannot be deployed when studying services on extended 553
networks of channels) (Rudi, 2019; Rudi et al., 2020). Therefore, the developed formula in this 554
research proposes a semi-empirical approach of medium complexity, process-based, to assess seed 555
retention in agricultural channels. 556
557
5. CONCLUSION 558
559
Seed dispersal by hydrochory through agricultural channels greatly influences weed spatio-temporal 560
distributions at the landscape scale. Natural vegetation growing in these channels plays a major role 561
21
in the retention rates of weed propagules, and these retention rates are greatly influenced by both 562
vegetation features and hydrodynamic conditions. This research focused on the characterization of 563
R. crispus seed capture rates in three different artificial vegetation covers (Isolepis sp., Thuja sp., 564
and Buxus sp.) in an experimental channel. We compared the relevance of different vegetation 565
metrics and showed that the cover of vegetation at the water surface, calculated from 3D plants, was 566
the best predictor of seed capture. We proposed a generic and semi-empirical formula to predict the 567
seed capture rate in vegetated channels as a function of vegetation cover at the water surface and 568
hydrodynamic conditions. This research supports the idea that the use of 3D plant models is an 569
efficient way to understand water-plant-particle interactions in open channels. Our results have 570
practical implications for the agroecological management of agricultural channels because they can 571
inform on the relevant maintenance practices to manage vegetation according to the intended 572
objectives of weed spreading limitation or natural revegetation through agricultural networks. 573
Indeed, the choice between different options for vegetation management involves different 574
vegetation dynamics along the year in terms of density or height of the cover (Dollinger et al., 2017; 575
Levavasseur et al., 2014). The proposed formula could be used as a basis for a wide variety of 576
vegetation covers and extended to other types of floating seeds. 577
ACKNOWLEDGEMENTS 578
579
The authors would like to thank Cédric Guillemin and Fabien Roudil for their help during the 580
channel experiment. We would also like to thank first-year students from l’Institut Agro 581
(Montpellier SupAgro) engineering program (years 2017-2018 and 2018-2019) for performing the 582
preliminary trials with us. This work (ID 1702-008) was publicly funded through ANR (the French 583
National Research Agency) under the “Investissements d’avenir” programme with the reference 584
ANR-10-LABX-001-01 Labex Agro and coordinated by Agropolis Fondation under the frame of I-585
SITE MUSE (ANR-16-IDEX-0006). Inputs from two anonymous reviewers greatly improved the 586
manuscript, and we are grateful for their recommendations. 587
588
CONFLICT OF INTEREST 589
590
No conflict of interest was declared. 591
592
DATA AVAILABILITY STATEMENT 593
22
The data that support the findings of the study will be available online (Rudi et al. 2020 - 595
https://doi.org/10.5281/zenodo.3947814) from the date of publication. 596 597 598 REFERENCES 599 600
Boedeltje, G., Bakker, J. P., & ter Heerdt, G. N. J. (2003). Potential role of propagule banks in the 601
development of aquatic vegetation in backwaters along navigation canals. Aquatic Botany, 77(1), 602
53–69. https://doi.org/10.1016/S0304-3770(03)00078-0
603 604
Carthey, A. J. R., Fryirs, K. A., Ralph, T. J., Bu, H., & Leishman, M. R. (2016). How seed traits 605
predict floating times : A biophysical process model for hydrochorous seed transport behaviour in 606
fluvial systems. Freshwater Biology, 61(1), 19–31. https://doi.org/10.1111/fwb.12672
607 608
Cavers, P. B., & Harper, J. L. (1964). Biological flora of British Isles. Rumex obtusifolius L. and R. 609
crispus L. Journal of Ecology, 52, 737-766. 610
611
Chambert, S., & James, C. S. (2009). Sorting of seeds by hydrochory. River Research and 612
Applications, 25(1), 48–61. https://doi.org/10.1002/rra.1093
613 614
Chapman, J. A., Wilson, B. N., & Gulliver, J. S. (2015). Drag force parameters of rigid and flexible 615
vegetal elements. Water Resources Research, 51(5), 3292–3302. 616
https://doi.org/10.1002/2014WR015436
617 618
Cornacchia, L., van der Wal, D., van de Koppel, J., Puijalon, S., Wharton, G., & Bouma, T. J. 619
(2019). Flow-divergence feedbacks control propagule retention by in-stream vegetation : The 620
importance of spatial patterns for facilitation. Aquatic Sciences, 81(1), 17. 621
https://doi.org/10.1007/s00027-018-0612-1
622 623
Defina, A., & Peruzzo, P. (2010). Floating particle trapping and diffusion in vegetated open channel 624
flow. Water Resources Research, 46(11), W11525. https://doi.org/10.1029/2010WR009353
625 626
Defina, A., & Peruzzo, P. (2012). Diffusion of floating particles in flow through emergent 627
vegetation : Further experimental investigation. Water Resources Research, 48(3). 628
https://doi.org/10.1029/2011WR011147 629
23 630
Dollinger, J., Dagès, C., Bailly, J.-S., Lagacherie, P., & Voltz, M. (2015). Managing ditches for 631
agroecological engineering of landscape. A review. Agronomy for Sustainable Development, 35(3), 632
999–1020. https://doi.org/10.1007/s13593-015-0301-6 633
634
Dollinger, J., Vinatier, F., Voltz, M., Dagès, C., and Bailly, J.-S. (2017). Impact of maintenance 635
operations on the seasonal evolution of ditch properties and functions. Agricultural Water 636
Management, 193, 191–204. 637
638
Engström, J., Nilsson, C., & Jansson, R. (2009). Effects of stream restoration on dispersal of plant 639
propagules. Journal of Applied Ecology, 46(2), 397-405. 640
641
Erktan, A., Cécillon, L., Roose, E., Frascaria-Lacoste, N., & Rey, F. (2013). Morphological 642
diversity of plant barriers does not increase sediment retention in eroded marly gullies under 643
ecological restoration. Plant and Soil, 370(1/2), 653-669. JSTOR. 644
645
Favre-Bac, L., Mony, C., Burel, F., Seimandi-Corda, G., & Ernoult, A. (2017). Connectivity drives 646
the functional diversity of plant dispersal traits in agricultural landscapes : The example of ditch 647
metacommunities. Landscape Ecology, 32(10), 2029–2040. https://doi.org/10.1007/s10980-017-648
0564-1 649
650
Girardeau-Montaut, D. (2014). CloudCompare: 3D point cloud and mesh processing software. 651
Available online: https://www.danielgm.net/cc/ (accessed on 1 October 2018). 652
653
Godin, C., & Caraglio, Y. (1998). A Multiscale Model of Plant Topological Structures. Journal of 654
Theoretical Biology, 191(1), 1‑46. https://doi.org/10.1006/jtbi.1997.0561 655
656
Green, J. C. (2005). Comparison of blockage factors in modelling the resistance of channels 657
containing submerged macrophytes. River Research and Applications, 21(6), 671–686. 658
https://doi.org/10.1002/rra.854
659 660
Greet, J., Cousens, R. D., & Webb, J. A. (2012). Flow regulation affects temporal patterns of 661
riverine plant seed dispersal : Potential implications for plant recruitment. Freshwater Biology, 662
57(12), 2568-2579. https://doi.org/10.1111/fwb.12028
663 664
24
Greet, J., Webb, J. A., & Downes, B. J. (2011). Flow variability maintains the structure and 665
composition of in-channel riparian vegetation. Freshwater Biology, 56(12), 2514-2528. 666
https://doi.org/10.1111/j.1365-2427.2011.02676.x
667 668
Gurnell, A. M., Boitsidis, A. J., Thompson, K., & Clifford, N. J. (2006). Seed bank, seed dispersal 669
and vegetation cover : Colonization along a newly-created river channel. Journal of Vegetation 670
Science, 17(5), 665-674. https://doi.org/10.1111/j.1654-1103.2006.tb02490.x
671 672
Hyslop, J., & Trowsdale, S. (2012). A review of hydrochory (seed dispersal by water) with 673
implications for riparian rehabilitation. Journal of Hydrology (New Zealand), 51(2), 137-152. 674
675
Jager, M. de, Kaphingst, B., Janse, E. L., Buisman, R., Rinzema, S. G. T., & Soons, M. B. (2019). 676
Seed size regulates plant dispersal distances in flowing water. Journal of Ecology, 107(1), 307‑317. 677
https://doi.org/10.1111/1365-2745.13054
678 679
Levavasseur, F., Biarnès, A., Bailly, J. S., & Lagacherie, P. (2014). Time-varying impacts of 680
different management regimes on vegetation cover in agricultural ditches. Agricultural Water 681
Management, 140, 14–19. https://doi.org/10.1016/j.agwat.2014.03.012
682 683
Liu, X., Zeng, Y., & Huai, W. (2019). Floating seed dispersal in open channel flow with emergent 684
vegetation. Ecohydrology, 12(1), e2038. https://doi.org/10.1002/eco.2038
685 686
Luhar, M., & Nepf, H. M. (2011). Flow-induced reconfiguration of buoyant and flexible aquatic 687
vegetation. Limnology and Oceanography, 56(6), 2003-2017. 688
https://doi.org/10.4319/lo.2011.56.6.2003
689 690
Merritt, D. M., & Wohl, E. E. (2002). Processes Governing Hydrochory along Rivers : Hydraulics, 691
Hydrology, and Dispersal Phenology. Ecological Applications, 12(4), 1071-1087. JSTOR. 692
https://doi.org/10.2307/3061037
693 694
Nepf, H. M. (2012). Hydrodynamics of vegetated channels. Journal of Hydraulic Research, 50(3), 695
262-279. https://doi.org/10.1080/00221686.2012.696559
696 697
25
Nilsson, C., Brown, R. L., Jansson, R., & Merritt, D. M. (2010). The role of hydrochory in 698
structuring riparian and wetland vegetation. Biological Reviews of the Cambridge Philosophical 699
Society, 85(4), 837-858. https://doi.org/10.1111/j.1469-185X.2010.00129.x
700 701
Nilsson, C., Gardfjell, M., & Grelsson, G. (1991). Importance of hydrochory in structuring plant 702
communities along rivers. Canadian Journal of Botany, 69(12), 2631–2633. 703
https://doi.org/10.1139/b91-328
704 705
Palmer, M. R., Nepf, H. M., Pettersson, T. J. R., & Ackerman, J. D. (2004). Observations of particle 706
capture on a cylindrical collector : Implications for particle accumulation and removal in aquatic 707
systems. Limnology and Oceanography, 49(1), 76-85. https://doi.org/10.4319/lo.2004.49.1.0076
708 709
Peruzzo, P., Defina, A., & Nepf, H. (2012). Capillary trapping of buoyant particles within regions of 710
emergent vegetation. Water Resources Research, 48(7). https://doi.org/10.1029/2012WR011944
711 712
Peruzzo, P., Pietro Viero, D., & Defina, A. (2016). A semi-empirical model to predict the probability 713
of capture of buoyant particles by a cylindrical collector through capillarity. Advances in Water 714
Resources, 97, 168-174. https://doi.org/10.1016/j.advwatres.2016.09.006
715 716
Petit, S., Boursault, A., Guilloux, M., Munier-Jolain, N., & Reboud, X. (2011). Weeds in 717
agricultural landscapes. A review. Agronomy for Sustainable Development, 31(2), 309–317. 718
https://doi.org/10.1051/agro/2010020
719 720
R Core Team (2017). R: A language and environment for statistical computing. R Foundation for 721
Statistical Computing, Vienna, Austria. URL: http://www.R-project.org. 722
723
Ridley, H. N. (1930). The Dispersal Of Plants Throughout The World (L. Reeve & Co, LTD.). 724
http://archive.org/details/TheDispersalOfPlantsThroughoutTheWorld 725
726
Riis, T., & Sand‐Jensen, K. (2006). Dispersal of plant fragments in small streams. Freshwater 727
Biology, 51(2), 274-286. https://doi.org/10.1111/j.1365-2427.2005.01496.x
728 729
Rubol, S., Ling, B., & Battiato, I. (2018). Universal scaling-law for flow resistance over canopies 730
with complex morphology. Scientific Reports, 8(1), 1-15.
https://doi.org/10.1038/s41598-018-731
22346-1
26 733
Rudi, G. (2019). Modélisation et analyse de services éco-hydrauliques des réseaux de canaux et 734
fossés des agrosystèmes méditerranéens [PhD Thesis]. Montpellier SupAgro, Montpellier, France. 735
736
Rudi, G., Bailly, J.-S., Belaud, G., Dages, C., Lagacherie, P., & Vinatier, F. (2020). 737
Multifunctionality of agricultural channel vegetation : A review based on community functional 738
parameters and properties to support ecosystem function modeling. Ecohydrology & Hydrobiology, 739
20(3), 397-412. https://doi.org/10.1016/j.ecohyd.2020.03.004 740
741
Rudi, G., Bailly, J.-S., Belaud, G., & Vinatier, F. (2018). Characterization of the long-distance 742
dispersal of Johnsongrass (Sorghum halepense) in a vegetated irrigation channel. River Research 743
and Applications, 34(9), 1219-1228. https://doi.org/10.1002/rra.3356 744
745
Rudi, G., Belaud, G., Troiano, S., Bailly, J. S., & Vinatier, F. (2020). Experimental dataset on seed 746
retention rates in a vegetated cover [Data set]. Zenodo. http://doi.org/10.5281/zenodo.3947814 747
748
Soomers, H., Winkel, D. N., Du, Y., & Wassen, M. J. (2010). The dispersal and deposition of 749
hydrochorous plant seeds in drainage ditches. Freshwater Biology, 55(10), 2032-2046. 750
https://doi.org/10.1111/j.1365-2427.2010.02460.x
751 752
Uva, R. H., Neal, J. C., & Ditomaso, J. M. (1997). Weeds of the Northeast. Ithaca, NY: Cornell 753
University Press. 754
755
Van Dijk, W. F. A., Van Ruijven, J., Berendse, F., & De Snoo, G. R. (2014). The effectiveness of 756
ditch banks as dispersal corridor for plants in agricultural landscapes depends on species’ dispersal 757
traits. Biological Conservation, 171, 91–98. https://doi.org/10.1016/j.biocon.2014.01.006
758 759
Vella, D., & Mahadevan, L. (2005). The « Cheerios effect ». American Journal of Physics, 73(9), 760
817–825. https://doi.org/10.1119/1.1898523
761 762
Vinatier, F., Bailly, J.-S., & Belaud, G. (2017). From 3D grassy vegetation point cloud to hydraulic 763
resistance : Application to close-range estimation of Manning coefficients for intermittent open 764
channels. Ecohydrology, 10(8), e1885. https://doi.org/10.1002/eco.1885
765 766
27
Vinatier, F., Dollinger, J., Rudi, G., Feurer, D., Belaud, G., & Bailly, J.-S. (2018). The Use of 767
Photogrammetry to Construct Time Series of Vegetation Permeability to Water and Seed Transport 768
in Agricultural Waterways. Remote Sensing, 10(12), 2050. https://doi.org/10.3390/rs10122050
769 770
Vogel, S. (1996). Life in Moving Fluids : The physical biology of flow (Princeton University Press). 771
https://press.princeton.edu/books/paperback/9780691026169/life-in-moving-fluids 772
773
White, B. L., & Nepf, H. M. (2003). Scalar transport in random cylinder arrays at moderate 774
Reynolds number. Journal of Fluid Mechanics, 487, 43-79. 775
https://doi.org/10.1017/S0022112003004579
776 777 778
28 TABLES
779 780
Table 1: Characteristics of the studied artificial plants. The ramification number was based on 781
the methodology detailed in Godin and Caraglio (1998). 782
783
Variable Isolepsis sp. Thuja sp. Buxus sp.
Standing length (cm) 63 30 20
Ramification number 0 1 2
Number of branching stems 0 30 11
Volume (cm3) 241 230 147
Collar diameter (mm) 6 3 3
Leaf number 8 30 15
Projected surface area on horizontal plane (cm2) 162 40 52
29
Table 2: Summary of the experimental design. SP represents the species, Q the discharge, D the 784
density of plants by panels of 0.66*0.6 m and NB is the number of concrete panels filled with 785
vegetation. 786
787
SP Q (in L.s-1) D Density per
m2 NB First experiment Isolepis sp. 10-25-40 0-144 0-361.9 2 Buxus sp. 10-20 0-36 0-90.5 2 Thuja sp. 10-20-30 0-96 0-241.3 2 Second experiment Isolepis sp. 10 36 90.5 1, 2, 4, 6, 8 25 60 150.8 1, 2, 4, 6, 8 40 60 150.8 1, 2, 4, 6, 8 Buxus sp. 10 9 22.6 1, 2, 4, 6, 8 20 9 22.6 1, 2, 4, 6, 8 Thuja sp. 10 12 30.2 1, 2, 3, 4, 6, 8 20 24 60.3 1, 2, 3, 4, 6, 8 788
30
Table 3: Effect of discharge (Q), density (D), species (SP), and interactions between density 789
(D) and species (SP) on the rates of seed capture in a generalized linear model (glm) with a 790
binomial error distribution. Density and discharge were used as the continuous variables, and 791
species was used as the categorical variable. The P value indicates the significance of the model. 792 793 d.f. Deviance (Chi2 -value) Residual d.f. Residual deviance P value Q 1 654.4 253 7047.3 < 0.001 D 1 3708.3 252 3339.0 < 0.001 SP 2 718.16 250 2620.8 < 0.001 D x SP 2 440.5 248 2180.3 < 0.001
31
Table 4: Parameters fitted to the sigmoid curves from Equation 2. Q is the discharge, D50 the
794
density needed to reach 50% seed retention, and Slope the slope of the linear relation between the 795
density (D) and the seed retention rate (Rr).
796 797
Studied plant Q (in L.s-1) D50 Slope R2
Isolepis sp. 10 43*** 0.04*** 0.86 25 73*** 0.03*** 0.82 40 91*** 0.03*** 0.88 Buxus sp. 10 6*** 0.33*** 0.90 20 12*** 0.24*** 0.95 Thuja sp. 10 8*** 0.28*** 0.92 20 20*** 0.11*** 0.85 30 55*** 0.04*** 0.91
Significance codes of each parameter of the sigmoid curve fitted using non-least squares: 798
‘***’ 0.001 ‘**’ 0.01 ‘*’ 0.05 ‘.’ 0.1 ‘ ’ 1 799
32
Table 5: Presentation of the results of the fitted generic formula across various 𝑀𝑒𝑡𝑟𝑖𝑐𝑠 801 and ℜ values. 802 803 𝑀𝑒𝑡𝑟𝑖𝑐𝑠 ℜ × 10 R2 RMSE a
Scene representing real plant arrangements (“scene” method)
Total vegetation ratio (Metrics 1) 0.24 0.255 3.678 Emergent vegetation ratio (Metrics 2) 0.18 0.279 3.669 Submerged vegetation ratio (Metrics 3) 0.77 0.126 0.961 Surface vegetation ratio (Metrics 4) 0.90 0.083 0.464 Product of the projected area of individual plants by plant densities (“product” method) Total vegetation ratio (Metrics 1) 0.12 0.321 11.55 Emergent vegetation ratio (Metrics 2) 0.08 0.339 14.95 Submerged vegetation ratio (Metrics 3) 0.49 0.205 1.448 Surface vegetation ratio (Metrics 4) 0.58 0.178 0.654
33
Table 6: Estimation of the R2 and RMSE of the best fitted generic formula for the three
804 studied plants. 805 806 SP Whole dataset R2 RMSE Buxus sp. 0.83 0.26 Isolepis sp. 0.90 0.22 Thuja sp. 0.91 0.21 807