Biochemical Pharmacology xxx (xxxx) xxx
Available online 15 March 2021
0006-2952/© 2021 Elsevier Inc. All rights reserved.
Time course of cortical response complexity during extended wakefulness
and its differential association with vigilance in young and
older individuals
Giulia Gaggioni
a,b,c,*, Elizabeth Shumbayawonda
c, Umberto Montanaro
d, Julien Q.M. Ly
a,b,e,
Christophe Phillips
a,f, Gilles Vandewalle
a,b,*,1, Daniel Ab´asolo
c,1aGIGA-Institute, Cyclotron Research Centre/In Vivo Imaging, University of Li`ege, 4000 Li`ege, Belgium bWalloon Excellence in Life sciences and Biotechnology (WELBIO), Belgium
cCentre for Biomedical Engineering, Dept. Of Mechanical Engineering Sciences, University of Surrey, Guildford, UK dCentre for Automotive Engineering, Dept. of Mechanical Engineering Sciences, University of Surrey, Guildford, UK eDepartment of Neurology, CHU Li`ege, 4000 Li`ege, Belgium
fGIGA- Institute, In silico Medicine, University of Li`ege, 4000 Li`ege, Belgium 1Joint last authors
A R T I C L E I N F O Keywords: Sleep Circadian Ageing Vigilance Lempel-Ziv complexity TMS-EEG A B S T R A C T
Characterization of the complexity of electroencephalogram (EEG) responses has provided important insights in cognitive function as well as in the brain bases of consciousness and vigilance. Whether brain response complexity changes during prolonged wakefulness and sleep deprivation –when vigilance level considerably varies– is not fully elucidated yet. In the present study, we repeatedly assessed EEG responses to transcranial magnetic stimulation (TMS) over 34 h of sleep deprivation under constant routine conditions in healthy younger (N = 13; 5 women; 18–30 y) and older (N = 12; 6 women; 50–70 y) individuals, while they were performing a vigilance task. Response complexity was computed both at the global (all scalp sensors) and local (sensors surrounding TMS hotspot) levels using the Lempel-Ziv algorithm. Response complexity was significantly higher in the older compared to the young volunteers over the entire protocol. Global complexity response significantly changed with time spent awake, with an increasing trend from the beginning to the middle of the biological night, followed by a decreasing trend from the middle of the biological night to the following afternoon. An unexpected different link between vigilance performance and brain response complexity was detected across age groups: higher response complexity was associated with lower performance in the older group, particularly in the morning sessions. These findings show that cortical activity complexity changes with vigilance variation, as experienced during sleep deprivation and circadian misalignment, in two age groups, with no evident time course difference across age-groups. Aside from classical linear EEG analyses, computation of Lempel-Ziv complexity provides additional insights on the neurophysiology of the processes associated with vigilance and their modifications throughout ageing.
1. Introduction
In our 24/7 society, how the brain deals with sleep loss and circadian misalignment, and how performance is affected by it, is a timely research focus. Sleep homeostasis and the circadian timing system have been established as essential to these matters. Sleep homeostasis pro-gressively builds-up sleep need during prolonged wakefulness. During the biological day, under well-rested circumstances, the circadian signal
opposes this progressive build-up, so that performance and behaviour remain relatively stable over ~ 16 h of wakefulness [1,2]. The circadian signal then stops opposing sleep need and promotes sleep during the biological night, so that sleep can be initiated and maintained throughout the night-time window. However, if wakefulness is extended into the biological night, cognition and vigilance are jeopardized, particularly at the end of the night [3]. If wakefulness is further pro-longed, the circadian signal will re-oppose sleep need, thus triggering a * Corresponding authors at: GIGA-Institute, Cyclotron Research Centre/In Vivo Imaging, Bˆatiment B30, All´ee du VI Août, 8, 4000 Liege, Belgium.
E-mail addresses: [email protected] (G. Gaggioni), [email protected] (G. Vandewalle). Contents lists available at ScienceDirect
Biochemical Pharmacology
journal homepage: www.elsevier.com/locate/biochempharmhttps://doi.org/10.1016/j.bcp.2021.114518
partial restoration of vigilance and performance during the next bio-logical day, even if sleep did not take place [3].
These changes are reflected in variations in the oscillations compo-sition of the electroencephalogram (EEG). The EEG remains relatively stable towards higher frequencies during the day. Habitual night time sleep is characterized by an initial high power in lower frequencies that progressively decreases overnight, reflecting sleep need dissipation. If one remains awake at night, the EEG shows a sharp increase in lower frequency prevalence, followed by a partial decrease the following day, reflecting the dual impact of sleep homeostasis and the circadian system [4]. These dynamic changes in EEG oscillation composition have been related to molecular, cellular and system level changes [5]. These in-sights have, however, mostly been gained through linear analyses of the EEG (e.g. Fourier transformation).
In the last decades, non-linear mathematical approaches have been applied to infer the temporal structure of brain activity [6]. The Lempel- Ziv complexity (LZC) algorithm is one of these approaches [7], with the remarkable advantage of its simplicity (it does not require any inputs selection), its robustness to noise, its computational efficiency, and the fact that it can be calculated even for short data segments (milliseconds range) [8]. LZC is a complexity measure related to the number of distinct substrings in the time series and to their recurrence rate along a given sequence. LZC reflects the underlying activeness and information pro-cessing capacity of the underlying neurons [9] and is, therefore, brain state-dependent. LZC has been proven to successfully differentiate be-tween different consciousness and vigilance states (alert wakefulness, light and deep slow wave sleep, rapid eye movement (REM) sleep, dis-orders of consciousness, anaesthesia) [10–12]. Furthermore, LZC-based measures have been shown to be high during normal wakefulness and REM sleep and low during non-REM (NREM) sleep, with a progressive decrease from light to deeper sleep stages [10]. This progressive increase in the regularity of the signal depends at least in part on changes in the balance between high- and low-frequency EEG powers, ranging from hyper desynchronized high frequency activity during well-rested wakefulness to hypersynchronous low frequency EEG signal during deep sleep [11]. Two animal studies investigated whether cortical complexity changes during partial sleep deprivation in rats [13,14] and found no significant change in complexity. Likewise, an exploration in healthy young humans showed no significant changes in complexity over 28 h of sleep deprivation, when measured at the cortical surface level, following EEG source reconstruction [15]. Nevertheless, whether LZC EEG complexity changes during prolonged wakefulness remains to be established in humans. In addition, whether these changes remain stable in ageing –when sleep homeostasis and the circadian system un-dergo profound modifications [16–19]– remains to be investigated. Furthermore, it is also not known whether these changes in complexity may be related to vigilant attention, which consistently shows impair-ments during extended wakefulness [20].
To answer these questions, we computed LZC complexity of EEG brain responses to transcranial magnetic stimulation (TMS), recorded in 9 TMS-EEG sessions acquired over 34 h of prolonged wakefulness, under strictly controlled constant routine conditions [21], in heathy younger and older adults of both sexes. This protocol allows to detect the com-bined influence of sleep homeostasis and the circadian system on TMS- induced cortical response, which mimics normal brain stimulus pro-cessing [22]. Concomitantly to TMS-EEG recordings, participants per-formed a vigilant attention task, allowing for correlations with simultaneous LZC complexity that was computed both globally (over the entire scalp) and locally (around the TMS hotspot). We hypothesised that cortical response complexity would reflect the dual impact of sleep homeostasis and the circadian system on brain function. In particular, because of the increasing intrusion of slow EEG oscillations during the biological night, we expected lower complexity value at night, around the nadir of vigilance performance. Since the dynamics of sleep ho-meostasis and circadian signal strength were reported to decrease with age, we anticipated a shallower fluctuation in older vs. younger
individuals. Furthermore, given that EEG brain activity during both sleep and wakefulness undergoes a relative shift towards more high- frequency and oscillation power in ageing [23], we further anticipated that cortical response complexity would be higher in the older group over the entire protocol. Finally, we expected significant associations between LZC complexity and vigilance performance, particularly during the biological night.
2. Material and methods
Except for Lempel-Ziv complexity analyses, all procedures are as in [24].
2.1. Participants
The study was approved by the Ethics Committee of the Faculty of Medicine, University of Li`ege. Participants gave their written informed consent and received a financial compensation. Twenty-six healthy participants were enrolled, 13 older adults (62.6 y ± 3.8; 7 women) and 13 young (22.8 y ± 2.9; 5 women). Exclusion criteria included: Body Mass Index (BMI) < 18 and >28; recent psychiatric history, severe Table 1
Sample characteristics (mean ± SD).
Age group Younger
(18–30 y) Older (50–70 y) P value N 13 12 – Women 5 6 0.96 Age (yr.) 22.8 ± 2.9 62.3 ± 3.7 – Right handed 10 11 0.32 BMI (kg/m2) 22.3 ± 3 24.8 ± 2.3 0.03 Anxiety level 2.6 ± 3.9 3 ± 3.8 0.8 Mood 2.8 ± 2.7 3.2 ± 2.8 0.77 Caffeine (cups/day) 1.1 ± 1.9 2.2 ± 1.3 0.12 Alcohol (doses/week) 2.7 ± 3.2 4.7 ± 5 0.23 Chronotype 56 ± 6.1 59.6 ± 7.2 0.58 Clock time of dim light melatonin
onset (hh:min) 21:34 ± 01:11 21:43 ±00:38 0.71 Clock time of dim light melatonin
offset (hh:min) 08:21 ± 01:01 07:55 ±01:05 0.31 Subjective sleep quality 3.2 ± 1 5.3 ± 2.8 0.03 Subjective daytime sleepiness 3.6 ± 2.8 4.8 ± 4.3 0.41 Sleep duration for 7 preceding days
(min, actigraphy) 511 ± 30 490 ± 32 0.18 Sleep time for 7 preceding days (hh:
min, actigraphy) 23:28 ± 00:43 23:35 ±00:28 Wake time for 7 preceding days (hh:
min, actigraphy) 08:04 ± 00:53 07:48 ±00:44 In-lab baseline total time in bed (min,
EEG) 509 ± 19 502 ± 18 0.21
In-lab baseline sleep duration (min,
EEG) 456 ± 45 405 ± 67 0.01
In-lab baseline sleep efficiency (%,
EEG) 90 ± 9 81 ± 13 0.01
Baseline sleep time (hh:min) 23:20 ± 00:48 23:21 ± 00:30 Baseline wake time (hh:min) 07:48 ± 00:52 07:37 ±
00:33 Distance from coil (scalp) and cortical
hotspot (mm) * 17.9 ± 2.2 17.5 ± 2.2 0.87
Intensity of TMS pulses (%) 54.2 ± 4.5 55.2 ± 5.2 0.66 Estimated electric field of TMS pulses
(V/m)* 108.5 ± 16 116.2 ± 16.6 0.91
N.B.: Sample of in-lab baseline sleep EEG: Nyoung =10 (due to artefacted signal); Nolder =12.
Anxiety was measured by the 21 item Beck Anxiety Inventory (BAI ≤ 14) [25]; mood by the 21 items Beck Depression Inventory II (BDI-II ≤ 14) [26]; sleep quality by the Pittsburgh Sleep Quality Index Questionnaire (PSQI ≤ 7) [27]; daytime sleepiness by the Epworth Sleepiness Scale (ESS ≤ 11) [28]; chronotype by the Horne-¨Ostberg Questionnaire (<42: evening types; 42–58: intermediate types; > 58: morning types) [30].
trauma, sleep disorders; addiction; chronic medication affecting the nervous system; smokers, excessive alcohol (>14 doses/week) or caffeine (>3 cups/day) consumption; night shift workers during the last year; transmeridian travel during the last two months; anxiety or depression; poor sleep quality; excessive self-reported daytime sleepi-ness; and early signs of dementia (in older participants). Anxiety was measured by the 21 item Beck Anxiety Inventory (BAI ≤ 14) [25]; mood by the 21 items Beck Depression Inventory II (BDI-II ≤ 14) [26]; sleep quality by the Pittsburgh Sleep Quality Index Questionnaire (PSQI ≤ 7) [27]; daytime sleepiness by the Epworth Sleepiness Scale (ESS ≤ 11) [28]; and early signs of dementia using Mattis scale [29]. Chronotype was also assessed using the Horne-¨Ostberg Questionnaire [30]. As in [24], one older participant was discarded from all analyses because his performance was 3 interquartile ranges above or below the 25th and 75th percentile of the older participant sample. The final sample included therefore 13 young and 12 older participants (Table 1). 2.2. Experimental protocol
Participants completed a preparatory TMS-EEG session to determine
optimal TMS parameters for artefact-free recordings at least one week before the experiment. Participants also completed a screening night of sleep to exclude major sleep disorders (periodic leg movement with perceived leg impatience and/or apnoea-hypopnea index > 15/h). During the 7 days preceding the study, they kept a regular sleep-wake schedule (±15 min; verified using wrist actigraphy –actiwatch, Cam-bridge Neurotechnology, UK– and sleep diaries). Schedule and duration were based on at least 10 days of unconstrained actimetry recordings. Participants were requested to abstain from all caffeine and alcohol- containing beverages for 3 days preceding the study.
Participants were first maintained in dim light for 5.5 h (<5 lx) and trained to the cognitive test batteries, prior to sleeping at their habitual bedtime, for their habitual duration (in complete darkness). Following awakening , the experiment consisted in a 34 h constant routine sleep deprivation protocol (i.e. light < 5 lx, temperature ~19 ◦C, regular isocaloric liquid meals and water, semi-recumbent position, no time-of- day information, sound proofed rooms) [21]. The TMS-compatible electrode cap was placed upon awaking and after a brief showering. TMS-evoked EEG potentials (TEPs) were recorded 9 times (at 1000, 1600, 2000, 2200, 0100, 0500, 0700, 1000, and 1600 h, for a subject Fig. 1. Experimental protocol and cortical response complexity computation. A. Overview of the protocol. After a baseline night of sleep, 12 older and 13 young healthy participants underwent 34 h of sustained wakefulness under constant routine conditions. Cortical response complexity was assessed 9 times using TMS-EEG over ~ 1.5 circadian cycle. During TMS-EEG sessions, a visuomotor compensatory tracking task (CTT) was administered. Saliva samples were collected hourly for melatonin, allowing a posteriori data realignment and interpolation based on individual endogenous circadian timing (inferred based on dim light melatonin onset – DLMO, hereafter 0◦). Time is expressed in circadian phase (degrees - ◦; 15◦=1 h), and equivalent elapsed time awake (h). Representative clock time is for a participant with a 2300–0700 sleep-wake schedule. * Data were not extrapolated > 15◦from the last recording: resampling at 300◦could not be carried out in most participants, and was done at 270◦instead. B. Computation of cortical response complexity (8–300 ms post TMS). For each EEG channels of the butterfly response evoked by TMS, the coarse-graining approach first converts the original averaged signal into 0–1 sequence (s(i)), through comparison of the amplitude values (x(i)) with a given threshold (Td). The median value of the amplitude values is chosen as Td over the 292 ms post-TMS interval. Then, the Lempel- Ziv algorithm counts the number of different patterns in the sequence. The final complexity measure is normalised in order to make the complexity measure in-dependent from the length of the sequence.
sleeping from 2300 to 0700 h) (Fig. 1A).
2.3. TMS-evoked EEG response acquisitions and pre-processing
As in [31,32], the left or right superior frontal gyrus was set as stimulation target for right or left-handed, respectively. Stimulation target was located on individual structural MRI by means of a neuro-navigation system (Navigated Brain Stimulation; Nexstim). This device allows for reproducible evoked EEG responses and precise target loca-tion (FDA approval for presurgery). The neuronavigaloca-tion system ensured that hotspot location remained constant across sessions within an individual (±2 mm). TMS pulses were generated by a Focal Bipulse 8- coil (mean/outer winding diameter ca. 50/70 mm, Nexstim, Helsinki, Finland). The intensity of TMS pulses (I, %), the estimated induced electric field (EF, V/m), and the distance between the coil and the cortical hotspot (Dist, mm) did not diverge between the two age groups (Table 1). Each TMS-EEG session included 250–300 trials. Interstimulus intervals were randomly jittered between 1900 and 2200 ms. TMS re-sponses were recorded with a 60-channel TMS-compatible EEG ampli-fier (Eximia; Nexstim), equipped with a proprietary sample-and-hold circuit that provides TMS artefact free data from 5 ms post-TMS [33]. Electrooculogram (EOG) signals were recorded with two additional bi-polar electrodes. Participants wore the EEG cap during the entire pro-tocol, and electrodes impedance was set below 5 kΩ prior to each
recording session. The signal was band-pass-filtered between 0.1 and 500 Hz and sampled at 1450 Hz. Each TMS-EEG session ended with a neuronavigated digitization of the location of each electrode. Auditory EEG potentials (AEP) evoked by TMS and bone conductance were minimized by diffusing a continuous loud white masking noise through earplugs, and applying a thin foam layer between the EEG cap and the TMS coil. Each session was followed by a sham session consisting in 30- to-40 TMS pulses delivered parallel to the scalp while white noise was diffused at the same level. Absence of AEP was checked online on Cz between 0 and 500 ms post-TMS (all sessions were AEP-free). Data of sham sessions were not considered any further.
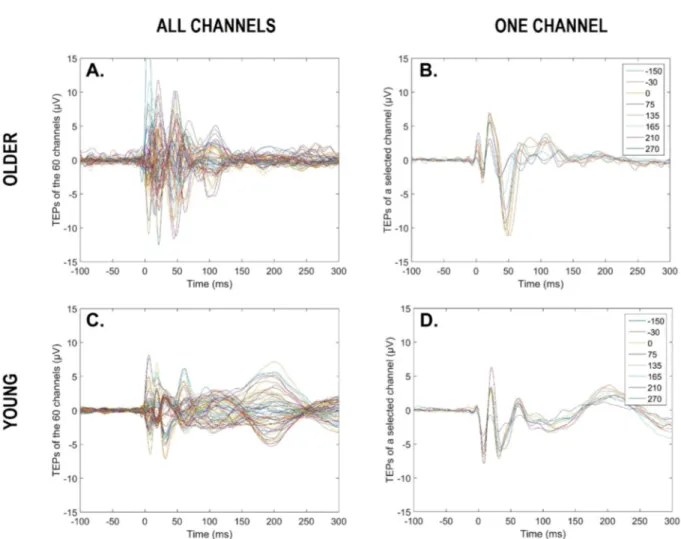
EEG data were pre-processed using SPM12 (Statistical Parametric Mapping 12, http://www.fil.ion.ucl.ac.uk/spm/) implemented in Mat-lab 2015 (The Mathworks Inc, Natick, MA). Processing included the following: visual rejection of artefacts (7.2%, SD = 7.9%) and bad channels (2.8%, SD = 2.7%), re-referencing to average of good channels, low-pass filtering at 80 Hz, resampling from 1450 to 1000 Hz, high-pass filtering at 1 Hz, epoching between –100 and 300 ms around TMS pulses (at 0 ms), baseline correction (-100 to − 1 ms pre-TMS), and robust averaging [34]. For each subject and each TMS-EEG session, we there-fore obtained an average response for each good channel, between − 100 pre-TMS and 300 ms post-TMS (Fig. 2 for a representative older and younger participant).
Fig. 2. TMS evoked responses for a representative older and young participant. Butterfly plots of average TMS evoked responses over the scalp (60 channels) for a given circadian phase (i.e., 270◦) (A, C). Butterfly plots of average TMS evoked responses for a given electrode (older: CP5; young: FC3), across the 9 circadian phases (B, D). Time window from − 100 to 300 ms, with 0 ms representing TMS stimulation.
2.4. Compensatory tracking task (CTT)
This visuomotor task probes vigilance (i.e. the ability to sustain attention over prolonged periods of time) and was performed during the TMS-EEG recordings (as in [31,32]). It consists in keeping a constantly randomly moving cursor on a target located in the centre of a computer screen, using a trackball device. The task was chosen because it only requires continuous smooth and limited movement of a single finger and allows for continuous vigilance monitoring during TMS-EEG recordings. Performance was computed as the average distance (in pixels) between the cursor and the target during TMS-EEG recordings, following removal of lapses. If signs of drowsiness were detected while performing the task during TMS-EEG sessions, the experimenter briefly touched the partic-ipant. Transitory lapses of vigilance resulted in temporary increases of the target-cursor distance, and could be automatically detected offline. A lapse was identified when the cursor was located outside a central 200 by 200 pixel box surrounding the target for > 500 ms from the last trackball movement. The lapse period ranged from the last trackball movement until the lapse detection. TMS evoked responses occurring during and < 1 s from a lapse period were discarded and excluded from the robust averaging (3.4%, SD = 6.5%; see 2.3.).
2.5. Lempel-Ziv complexity
Cortical response complexity at the sensors level (global and local) was inferred by applying the non-linear LZC algorithm [7]. LZC is a scalar metric that approximates the amount of non-redundant infor-mation contained in a substring of a time series (in this case an EEG signal) by estimating the minimal size of the “vocabulary” necessary to describe the string [9]. The coarse-graining approach converts first the original signal into a binary 0–1 sequence by comparing the amplitude values with a threshold. Then, the binary sequence is scanned from left to right and the complexity counter [c(n)] is increased by one-unit every time a new subsequence of consecutive characters is encountered (Fig. 1B). To obtain a complexity measure that is independent of the sequence length, normalization is applied, resulting in a scalar metric [C (n)] ranging between 0 and 1 [35]: the lower limit shows a stationary signal with no varying dynamics, while the upper limit shows a very complex signal with multiple complex dynamics [36].
For each channel, the median of the averaged evoked response was calculated for a time window between 8 and 300 ms, in order to avoid potential remaining artefacts [33], and used as the threshold, because of its robustness to outliers. The LZC algorithm was applied on the same time window (8–300 ms post stimulus; 1 sample every ms), while par-ticipants were performing a vigilance task. Thus, the temporal complexity inferred from the TEPs over the 60 EEG channels is a mixture of the magnetically evoked responses with visuomotor CTT components. Global response complexity was computed by averaging the response complexity value over all good channels in a given session. Thus, global response complexity is dependent on the cortical activation triggered by TMS and the global brain state (state-dependency). Local response complexity was computed by considering only the electrodes within a 35 mm-radius sphere around the TMS hotspot (i.e. location of maximal generated electric field), as provided by the TMS-EEG system [37,38]. The angular distance between the centre and the sensors was calculated by applying the sphereFit Matlab function (https://www.mathworks.co m/matlabcentral/fileexchange/34129-sphere-fit-least-squared), which calculates the centre and radius of the data in a least squared sense. Thus, local response complexity is substantially more dependent on the direct cortical activation evoked by TMS rather than the global brain state.
2.6. Hourly salivary melatonin samples
Hourly salivary melatonin samples were first placed at 4 ◦C, prior centrifugation and congelation at − 20 ◦C within 12 hrs. They were
measured by radioimmunoassay (Stockgrand Ltd, Guildford, UK), as previously described [39]. Most samples were analysed in duplicate. The limit of detection of the assay for melatonin was 0.8 ± 0.2 pg/ml using 500 µL volumes, while it was 0.37 ± 0.05 nmol/L using 500 µL volumes [40]. Estimation of individuals’ dim light melatonin onset (DLMO = phase 0◦) was determined based on raw values. The first 4 samples were disregarded and maximum secretion level was set as the median of the 3 highest concentrations. Baseline level was set to be the median of the values collected from “wake-up time + 5 h” to “wake-up time + 10 h”. DLMO was computed as the time at which melatonin level reached 20% of the baseline to maximum level (linear interpolation). No group dif-ferences of the DLMO onset/offset (hh:min) were reported (Table 1). 2.7. Statistical analyses
The circadian phase of all data points was estimated relative to in-dividual DLMO (i.e. phase 0◦, 15◦ = 1 h), which is a gold standard marker of endogenous circadian phase, signalling the beginning of the biological night [41]. All data points were resampled following linear interpolation at the theoretical phases of the TMS-EEG sessions in the protocol (Fig. 1A): − 150◦, − 60◦, 0◦, 30◦, 75◦, 135◦, 165◦, 210◦ and 270◦. Data were not extrapolated beyond 15◦ (i.e. 1 h), such that resampling at 300◦ could not be carried out for the majority of the participants and was advanced at 270◦instead. Data points situated 3 interquartile ranges above or below the 25th and 75th percentile were defined as extreme outliers and removed.
Statistical analyses were performed with SAS version 9.3 (SAS Institute, Cary, NC, USA). T-test on independent samples compared group characteristics (Chi squared for proportion comparisons). Wil-coxon rank-sum test compared melatonin values (non-normal distribu-tion). Generalized linear mixed models (PROC GLIMMIX) were applied to compute all statistics following determination of the dependent var-iable distribution (using Allfitdist Matlab function, https://www.mathw orks.com/help/stats/fitdist.html). Subject (intercept) effect was included as random factor. Circadian phase was included as the repeated measure together with an autoregressive estimation of autocorrelation of order 1 [AR(1)], and the covariance structure specified both subject and group effect. In all GLMMs, degrees of freedom were estimated using Kenward-Roger’s correction (reported between brackets for each test). If an interaction term was significant, simple effects were assed using post- hoc contrasts (difference of least square means) adjusted for multiple testing with Tukey’s procedure. Betas (i.e. regression coefficient) were derived by applying the ESTIMATE statement; they were not corrected for multiple comparisons. Upper and lower confidence limits were derived by applying the CL statement. Regressions were used for visual display only, and not as a substitute of the full GLMM statistics.
When analysing the time course of a given variable (i.e. response complexity and CTT performance), GLMM model included circadian phase, age group and their interaction. When seeking for associations between response complexity and CTT performance, GLMM model included response complexity, circadian phase, age group and all dou-ble/triple interactions. T-tests were performed on beta coefficients to analyse group differences in the link between cortical response complexity and CTT performance. Semi-partial R2 (Rsp2) was reported for each significant effect of interest as described in [42].
3. Results
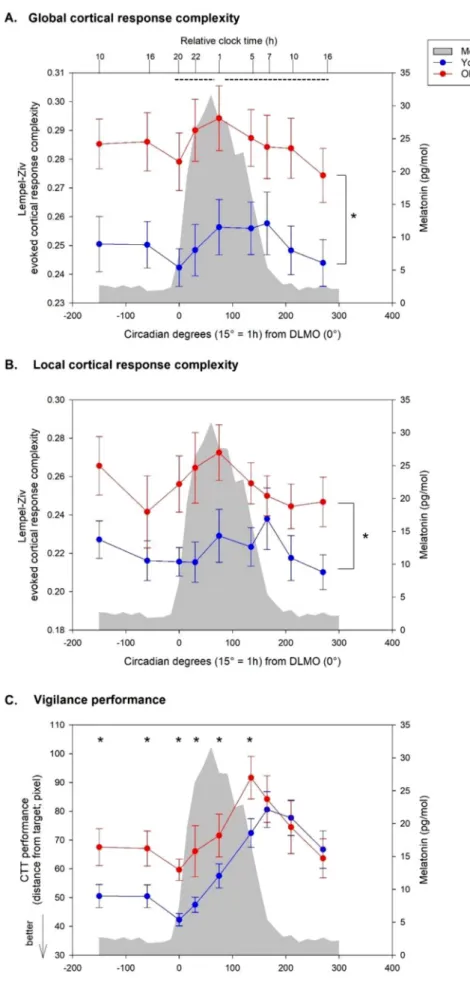
As a first step, we focussed on global TMS-response complexity (i.e. over all scalp sensors) for which a GLMM revealed a significant main effect of circadian phase (F(8,145) = 2.27, P = 0.026). Post hoc analyses indicated that this effect was driven by an increase of global response complexity (statistical trend) from the beginning to the middle of the biological night (i.e. 5 hrs after DLMO) (0◦-75◦| β = -0.052 | SE = 0.017 | lower-CL = -0.104 | upper-CL = 0.001 | P = 0.055), as well as a decrease of global complexity response (statistical trend) from the
Fig. 3. Dynamics of global (A) and local (B) cortical response complexity and of vigilance (C) during 34 h of prolonged wakefulness in young and older adults (mean ± SE). Time course of all measures is expressed relative to individual melatonin onset (DLMO = phase 0◦; 15◦=1 h). Average mela-tonin profile is displayed in grey. Dotted lines denote a statistical trend for difference between circadian phases. * significant group differences (overall (A-B) and at each circadian phase (C)).
middle of the biological night to the following afternoon of the second circadian day (75◦-270◦| β = 0.058 | SE = 0.019 | lower-CL = -0.001 | upper-CL = 0.117 | P = 0.056). A simple age-group effect was also detected (F(1,23.12) = 8.23, P = 0.009): during a wake extension of 34 hrs, older participant displayed an overall higher value of global cortical complexity response than young (young-old | β = -0.130 | SE = 0.045 | lower-CL = -0.224 | upper-CL = -0.036 | P = 0.009) (Fig. 3A). No sig-nificant circadian phase × age-group interaction was found (F(8,145) = 0.42, P = 0.91).
As a second step, we focussed on local TMS-response complexity, i.e. only considering channel within a 35-mm radius sphere surrounding the TMS hotspot, as it is less concerned with global brain state (cf. 2.5.). GLMM with local LZC value as dependent variable yielded a tendency for a main effect of circadian phase (F(8,134.9) = 1.83, P = 0.076), and a significant main effect of age-group (F(1,23.07) = 5.74, P = 0.025). As for global response complexity, older people had a higher value than young participants (young-old | β = -0.035 | SE = 0.014 | lower-CL = -0.064 | upper-CL = -0.005 | P = 0.025) (Fig. 3B). Again, no significant circadian phase × age-group interaction was found (F(8,134.9) = 0.78, P = 0.62). Since we previously reported change in the dynamics of cortical excitability with time awake in ageing, we also recomputed the analyses including individual TEP amplitude as covariate. This had no impact on the statistical output of our analyses and amplitude was not significantly related to complexity in any of the statistical models (data not shown).
We then considered performance to the CTT, which probes vigilant attention. GLMM with CTT performance as dependent variable yielded a main effect of circadian phase (F(8, 131.9) = 9.64, P < 0.0001), with worse performance at the end of the biological night as compared to the first and second circadian day (-150◦to 0◦, 210◦, 270◦<135◦, 165◦, P < 0.05; to facilitate reading, estimates and confidence limits were omitted) as well as a trend for a simple effect of age group (F(1, 23.92) = 3.74, P =0.065), with young performing generally better than older participant over the entire the protocol (young-old | β = -0.159 | SE = 0.082 | lower- CL = -0.328 | upper-CL = 0.011 | P = 0.065). A statistical tendency for circadian phase × age-group interaction was found (F(8,131.9) = 1.99,
P = 0.052). Group differences were detected at all circadian phases except the last three assessments (young < older; − 150◦ to 135◦, P < 0.05; 165◦to 270◦, P > 0.05), suggesting a different response to sleep loss: smaller differences in performance between age groups were found towards the end of the protocol (Fig. 3C).
We finally tested whether global and local LZC measures were associated with CTT performance. At the global cortical level, a GLMM with CTT performance as dependent variable yielded a significant global complexity × age-group × circadian phase triple interaction (F(8, 143.6) = 2.19, P = 0.031), a significant global complexity × age-group interaction (F(1, 127.5) = 5.36, P = 0.022) as well as age-group × circadian phase interaction (F(8, 141.1) = 2.41, P = 0.018), and a simple effect of age-group (F(1, 126.3) = 3.99, P = 0.048) (Table 2). Age groups showed different association between LZC and CTT values irrespective of circadian phase (young-old | β = -3.735 | SE = 1.613 | lower-CL = -6.927 | upper-CL = -0.544 | P = 0.022), with higher global complexity response significantly associated with worse CTT performance in the older group (old | β = 2.547 | SE = 1.095 | lower-CL = 0.373 | upper-CL =4.722 | P = 0.022) (Fig. 4A). At the local level, GLMM yielded a significant local complexity × age-group interaction (F(1, 172.8) = 4.12, P = 0.044) (Table 2), with a different relationship between local complexity response and CTT in the two age groups (young-old | β = -2.173 | SE = 1.071 | lower-CL = -4.286 | upper-CL = -0.060 | P = 0.044) (Fig. 4B). When considering each circadian phase separately, significant different associations between global response complexity and CTT performance were found between the two age groups in the morning of the first and second circadian day (i.e. 24 h apart) (-150◦, young-old | β =-6.848 | SE = 3.144 | lower-CL = -13.062 | upper-CL = -0.634 | P = 0.031) and (210◦, young-old | β = -8.209 | SE = 2.865 | lower-CL = -13.867 | upper-CL = -2.551 | P = 0.005), again with higher global complexity response associated with worse CTT performance in the older group (-150◦, old | β = 4.897 | SE = 2.528 | lower-CL = -0.143 | upper-CL = 9.937 | P = 0.057) (Fig. 4C) and (210◦, old | β = 5.969 | SE =1.922 | lower-CL = 2.148 | upper-CL = 9.789 | P = 0.003) (Fig. 4D). 4. Discussion
We investigated the time course of global and local cortical response complexity with time spent awake and according to the internal circa-dian clock, in young and older participants. We further tested for cor-relations between response complexity and performance to a vigilant attention task. Despite the fact that TMS stimulation parameters remained constant over the 9 sessions, we found that whole-scalp TMS- induced response complexity significantly changed during a strictly controlled 34 h sleep deprivation protocol. Results indicate that these variations in complexity are driven by an increase during the first part of the biological night followed by a progressive decline the following biological day. We observed a similar pattern when considering local response complexity - around the TMS hotspot – but overall changes represent a statistical trend only, with no clear difference between in-dividual circadian phases. As hypothesised, we found that both global and local response complexity are higher in older individuals compared with younger ones. Contrary to our hypothesis, however, there were no statistical indications that response complexity time course over the protocol are different between age groups. Finally, we found that global and local response complexity variations across the protocol are asso-ciated with vigilance performance variations, but the relationship is different between younger and older individuals, the latter having higher response complexity associated with poorer vigilant attention performance, particularly in the morning hours while well-rested and following total sleep deprivation.
Given that the experiment was conducted under constant routine conditions, the changes in global response complexity are very likely to be driven, at least to a large extent, by the dual influence of sleep ho-meostasis and circadian rhythmicity on brain function [43]. The decrease in global response complexity from the second part of the Table 2
Association between global and local cortical response complexity and vigilance performance. Factors including cortical response complexity are in italics. Sta-tistically significant results are in bold.
GLOBAL cortical response complexity CTT performance (dependent variable)
Cortical response complexity F(1,127.5) = .71 P = 0.40
Circadian period F(8,141.1) = 1.66 P = 0.11
Age group F(1,126.3) ¼ 3.99 P ¼ . 0.048 Rsp2
¼0.03
Cortical response complexity × age group F(1, 127.5) ¼ 5.36 P ¼ 0.02 Rsp2 ¼
0.04
Cortical response complexity × circadian period F(8, 143.6) = 1.14 P = 0.34
Age group × circadian period F(8, 141.1) ¼ 2.41 P ¼ 0.018 Rsp2
¼0.12
Cortical response complexity × age group ×
circadian period F(8, 143.6) ¼ 2.19 P ¼ 0.031 Rsp
2
¼0.11
LOCAL cortical response complexity CTT performance (dependent variable)
Cortical complexity response F(1, 172.8) = .02 P = 0.902
Circadian period F(8, 137.4) = .66 P = 0.727
Age group F(1, 152.4) = 1.84 P = 0.178 Cortical complexity response x age group F(1, 172.8) ¼ 4.12 P ¼ 0.044 Rsp2
¼0.02
Cortical complexity response x circadian period F(8,139) = .39 P = 0.924
Age group x circadian period F(8, 137.4) = 0.73 P = 0.662 Cortical complexity response x age group x
circadian period F(8,139) = .49 P = 0.860
GLMMs including CTT as dependent variable and left column variables as pre-dictors. Degrees of freedom are indicated between brackets and were estimated using Kenward-Roger’s correction. Rsp2: Semi partial R2, reported for significant effects.
biological night to the following biological day may plausibly be the consequence of an increase in slow EEG oscillations as sleep deprivation progresses [44], which would render the signal more regular and less complex. In contrast, we had not anticipated the increase in response complexity in the first part of the biological night. It is conceivable that the initial intrusion of low-frequency EEG activity (i.e. slow waves, theta
waves) during the first part of the biological night generates a dishar-mony between the different frequencies bands composing the EEG, resulting in a more diverse oscillation repertoire and higher response complexity [45]. Circadian phase 0◦represents individual DLMO that corresponds to the end of the so-called “wake-maintenance zone” [46], i. e. when the circadian signal maximally promotes wakefulness to counter Fig. 4. Associations between cortical response complexity and performance to the vigilance task. A: associations between global response complexity and CTT performance (higher values mean worse performance) in young and older individuals, inde-pendently of the circadian phase. B: associations be-tween local response complexity and CTT performance in young and older individuals, inde-pendently of the circadian phase. C: associations be-tween global response complexity and CTT performance in young and older individuals at circa-dian phase − 150. D: associations between global response complexity and CTT performance in young and older individuals at circadian phase 210. Re-gressions were used for visual display only and not as a substitute of the full GLMM statistics presented in Table 2.
linear increasing sleep homeostasis. The release of the circadian wake- promoting signal could also contribute to a more mixed EEG oscilla-tion composioscilla-tion, increasing signal complexity in the first part of the night.
Interestingly, LZC values were reported to become progressively more variable in the course of a partial sleep deprivation in rats [13]. This was proposed as reflecting a progressive increase in state insta-bility, so that LZC would constitute a metric sensitive to prior sleep-wake history that would be relatively independent from the absolute levels of slow wave activity [13,47]. Studies have indeed suggested that LZC captures the change of patterns within a time series, which does not merely correspond to changes in the spectral content of the EEG, providing additional information that cannot be captured with con-ventional linear analysis methods [6]. Thus, the dynamics of global LZC may be directly related to increased EEG state instability during sleep deprivation, rather than just the slow oscillation composition of the EEG. The fact that LZC measures should be interpreted as a harmonic vari-ability metric was also previously stated [36]: from this perspective one could potentially consider sleep deprivation as a physiological state in which slower waves intruded wakefulness, and consciousness and vig-ilance are altered [48].
Different non-linear measures exist that can be used to assess brain response complexity, based for instance on entropy and/or correlation dimension [49]. The concept of neural complexity was elaborated by combining both time and spatial component of the signal to reflect the interplay between functional segregation and integration within neural systems [50]. However, the advantage of the LZC method is its simplicity (it does not require any inputs selection), its robustness to noise, its computational efficiency, and the fact that it can be calculated even for short data segments (milliseconds range) [8]. Previous studies further showed that the binary (i.e. 0–1) conversion of the signal is appropriate to estimate the LZC in biomedical signals [36].
Local cortical excitability, as indexed by the slope/amplitude of the early (0–30 ms) TEP around the TMS hotspot, changes with time spent awake [31] and circadian cycle [32] in younger individuals, while variations are not as pronounced in older ones [24]. Here, we find variation in global LZC values with no indication of age-group difference in the dynamics. These findings suggest that cortical excitability and LZC measures may depend on different mechanisms. Local LZC values, considered only around the TMS hotspot, appear to follow a similar and yet seemingly attenuated variation profile compared to global LZC. Regarding the difference between local and global response complexity, single-pulse TMS over the frontal cortex induces a long range (0–300 ms) response in the (fast) beta range in the vicinity of the stimulation site [51], which could be interpreted as a transient synchronization of spontaneous activity within the beta band [52]. One could postulate that this reset is constant whatever the time-awake and circadian phase, so that local TMS response complexity considered over the 300 ms post TMS could undergo less variation over the protocol relative to global LZC, which depends more on overall brain state. Local LZC could therefore be inherently less sensitive than global LZC to prolonged wakefulness and/or constitute an intermediate between local excit-ability and global LZC. It is likely that impaired inhibition [53], synaptic plasticity, and neuronal bistability [44] shape cortical excitability differently of local as well as global LZC. We are, however, in no position to determine the respective weight of these aspects on the different cortical TMS-derived metrics. Furthermore, we stress that, although global LZC significantly varies over the protocol, post-hoc comparisons only yielded statistical trends between circadian phases. Variations of global LZC at specific circadian phases need, therefore, to be interpreted with caution, as well as the overall trend suggesting local LZC variation, and replication of the results over larger samples is needed.
Complexity response, both at the global and local level, was signif-icantly higher in older than young participants during the entire 34 h sleep deprivation protocol. A curvilinear relationship between age and complexity has been reported, with complexity maxima reached by the
sixth decade of life [45,54,55], with older participants of our sample were 62 years on average. In addition, older individuals have a higher EEG frequency content and lower slow-waves activity (SWA) during sleep [23]. The age group difference we detected is, therefore, expected and in line with the literature.
Concomitant with TMS acquisitions, participants performed a vigi-lant attention task, encompassing the ability of maintaining an alert state and orienting attention to stimuli [56]. Interestingly, decreased alertness (defined by the attenuation of alpha activity) was associated with higher EEG complexity (estimation based on the correlation dimension method) [57]. Here, the performance to the CTT task was worse in the older compared to the younger participants –except for the second day after sleep deprivation– possibly reflecting impaired alert-ness and attention network. Thus, we asked if there was a correlation between the decrement in vigilant attention performance towards the protocol and the cortical response complexity. We find that the associ-ation changes over the lifespan: a higher level of cortical complexity response was associated with worse vigilance performance in the older group, and especially in the morning, with the correlation estimate being stronger in the morning after sleep deprivation.
In conclusion, our study provides novel insights in the brain response complexity dynamics during prolonged wakefulness and sleep depriva-tion in two age groups, and their associadepriva-tion with vigilance. Despite an overall higher level of response complexity in older compared to young adults, the variations of response complexity were not significantly different between age groups. We found a tendency for an increase in complexity during the first part of the biological night as well as a tendency for a decrease the following biological day, possibly support-ing the view that sees LZC as a valid indicator of the harmonic variability within the cortical system. Moreover, different relationships between response complexity and vigilance performance were found in the two age groups, which warrants further investigation. Understanding the principal forces that regulate the dynamics of cortical neurophysiology in two age groups is of uppermost importance for our ageing society, in which sleep deprivation and circadian misalignment are commonplace. Authors contribution
G.G., G.V. designed the experiment, acquired and analysed the data, wrote the paper. D.A. provided expertise for non-linear analysis, ana-lysed the data, wrote the paper. J.Q.M.L. designed the experiment and acquired the data. E.S. provided expertise for non-linear analysis and feedback for data interpretation. U.M., C.P. provided expertise for data analysis. All authors edited the manuscript.
Declaration of Competing Interest
The authors declare that they have no known competing financial interests or personal relationships that could have appeared to influence the work reported in this paper.
Acknowledgements
We thank Christina Schmidt, Sarah L. Chellappa, Derk-Jan Dijk, Vincenzo Muto, Mathieu Jaspar, Christelle Meyer, Tillo Delfosse, Amaury Vanvinckenroye, Romain Dumont, Jonathan Devillers, Justinas Narbutas, Eric Lambot for their precious help in the different steps of the project. The study was funded by Wallonia Brussels International (WBI), Fonds L´eon Fredericq (FLF), Swiss National Science Foundation (SNSF), Fonds National de la Recherche Scientifique (FRS-FNRS, FRSM 3.4516.11, Belgium), Actions de Recherche Concert´ees (ARC 09/14-03) of the F´ed´eration Wallonie-Bruxelles, University of Li`ege (ULi`ege), Fondation Simone et Pierre Clerdent, AXA Foundation, Fondation M´edicale Reine Elisabeth (FMRE, Belgium), European Regional Devel-opment Fund (ERDF; Radiomed project), Walloon excellence in life sciences and biotechnology (WELBIO-CR-2010-06E, Belgium), and
FNRS-Belgium. References
[1] A.A. Borb´ely, A two process model of sleep regulation, Hum. Neurobiol. 1 (1982) 195–204 (accessed February 24, 2018), http://www.ncbi.nlm.nih.gov/pubme d/7185792.
[2] A.A. Borb´ely, S. Daan, A. Wirz-Justice, T. Deboer, The two-process model of sleep regulation: a reappraisal, J. Sleep Res. 25 (2) (2016) 131–143, https://doi.org/ 10.1111/jsr.12371.
[3] J.C. Lo, J.A. Groeger, N. Santhi, E.L. Arbon, A.S. Lazar, S. Hasan, M. von Schantz, S. N. Archer, D.-J. Dijk, S. Yamazaki, Effects of partial and acute total sleep deprivation on performance across cognitive domains individuals and circadian phase, PLoS One. 7 (9) (2012) e45987, https://doi.org/10.1371/journal. pone.0045987.
[4] C. Cajochen, J.K. Wyatt, C.A. Czeisler, D.J. Dijk, Separation of circadian and wake duration-dependent modulation of EEG activation during wakefulness, Neuroscience 114 (2002) 1047–1060 (accessed March 23, 2017), http://www.ncb i.nlm.nih.gov/pubmed/12379258.
[5] I. Navarro-Lobato, L. Genzel, The up and down of sleep: from molecules to electrophysiology, Neurobiol. Learn. Mem. 160 (2019) 3–10, https://doi.org/ 10.1016/j.nlm.2018.03.013.
[6] C.J. Stam, Nonlinear dynamical analysis of EEG and MEG: Review of an emerging field, Clin. Neurophysiol. 116 (10) (2005) 2266–2301, https://doi.org/10.1016/j. clinph.2005.06.011.
[7] A. Lempel, J. Ziv, On the complexity of finite sequences, IEEE Trans. Inf. Theory. 22 (1) (1976) 75–81, https://doi.org/10.1109/TIT.1976.1055501.
[8] X.S. Zhang, Y.S. Zhu, N.V. Thakor, Z.Z. Wang, Detecting ventricular tachycardia and fibrillation by complexity measure, IEEE Trans. Biomed. Eng. 46 (1999) 548–555, https://doi.org/10.1109/10.759055.
[9] L. Hu, Z. Zhang, EEG signal processing and feature extraction, Springer Nature (2019, 2019.), https://doi.org/10.1007/978-981-13-9113-2.
[10] A.G. Casali, O. Gosseries, M. Rosanova, M. Boly, S. Sarasso, K.R. Casali, S. Casarotto, M.-A. Bruno, S. Laureys, G. Tononi, M. Massimini, A theoretically based index of consciousness independent of sensory processing and behavior, Sci. Transl. Med. 5 (198) (2013) 198ra105, https://doi.org/10.1126/
scitranslmed.3006294.
[11] P.D. Tosun, D.-J. Dijk, R. Winsky-Sommerer, D. Abasolo, effects of ageing and sex on complexity in the human sleep EEG: a comparison of three symbolic dynamic analysis methods, Complexity. 2019 (2019) 1–12, https://doi.org/10.1155/2019/ 9254309.
[12] D.M. Mateos, R. Guevara Erra, R. Wennberg, J.L., Perez Velazquez, Measures of entropy and complexity in altered states of consciousness, Cogn. Neurodyn. 12 (2018) 73–84, https://doi.org/10.1007/s11571-017-9459-8.
[13] Daniel Ab´asolo, Samantha Simons, Rita Morgado da Silva, Giulio Tononi, Vladyslav V. Vyazovskiy, Lempel-Ziv complexity of cortical activity during sleep and waking in rats, J. Neurophysiol. 113 (7) (2015) 2742–2752, https://doi.org/ 10.1152/jn.00575.2014.
[14] P.D. Tosun, D. Ab´asolo, G. Stenson, R. Winsky-Sommerer, Characterisation of the effects of sleep deprivation on the electroencephalogram using Permutation Lempel-Ziv complexity, a non-linear analysis tool, Entropy. 19 (2017) 673, https:// doi.org/10.3390/e19120673.
[15] Giulia Gaggioni, Julien Q.M. Ly, Sarah L. Chellappa, Doroth´ee Coppieters ‘t Wallant, Mario Rosanova, Simone Sarasso, Andr´e Luxen, Eric Salmon, Benita Middleton, Marcello Massimini, Christina Schmidt, Adenauer Casali, Christophe Phillips, Gilles Vandewalle, Human fronto-parietal response scattering subserves vigilance at night, Neuroimage. 175 (2018) 354–364, https://doi.org/ 10.1016/j.neuroimage.2018.03.055.
[16] H.P. Landolt, J.V. R´etey, M. Adam, Reduced neurobehavioral impairment from sleep deprivation in older adults: contribution of adenosinergic mechanisms, Front. Neurol. APR (2012) 1–11, https://doi.org/10.3389/fneur.2012.00062. [17] Mirjam Münch, Vera Knoblauch, Katharina Blatter, Carmen Schr¨oder,
Corina Schnitzler, Kurt Kr¨auchi, Anna Wirz-Justice, Christian Cajochen, Age- related attenuation of the evening circadian arousal signal in humans, Neurobiol. Aging. 26 (9) (2005) 1307–1319, https://doi.org/10.1016/j.
neurobiolaging.2005.03.004.
[18] Derk-Jan Dijk, Jeanne F Duffy, Circadian regulation of human sleep and age- related changes in its timing, consolidation and EEG characteristics, Ann. Med. 31 (2) (1999) 130–140, https://doi.org/10.3109/07853899908998789.
[19] C. Schmidt, P. Peigneux, C. Cajochen, Age-related changes in sleep and circadian rhythms: Impact on cognitive performance and underlying neuroanatomical networks, Front. Neurol. JUL (2012) 1–11, https://doi.org/10.3389/ fneur.2012.00118.
[20] J. Lim, D.F. Dinges, Sleep Deprivation and Vigilant Attention, Ann. N. Y. Acad. Sci. 1129 (2008) 305–322, https://doi.org/10.1196/annals.1417.002.
[21] Jeanne F. Duffy, Derk-Jan Dijk, Getting through to circadian oscillators: why use constant routines? J Biol Rhythm. 17 (1) (2002) 4–13.
[22] M.J. Burke, P.J. Fried, A. Pascual-Leone, Transcranial magnetic stimulation: Neurophysiological and clinical applications, in: Handb. Clin. Neurol., Elsevier B. V., 2019: pp. 73–92. https://doi.org/10.1016/B978-0-12-804281-6.00005-7. [23] J. Carrier, S. Land, D.J. Buysse, D.J. Kupfer, T.H. Monk, The effects of age and
gender on sleep EEG power spectral density in the middle years of life (ages 20–60 years old), Psychophysiology. 38 (2001) 232–242 (accessed July 8, 2018), http ://www.ncbi.nlm.nih.gov/pubmed/11347869.
[24] Giulia Gaggioni, Julien Q.M. Ly, Vincenzo Muto, Sarah L. Chellappa, Mathieu Jaspar, Christelle Meyer, Tillo Delfosse, Amaury Vanvinckenroye, Romain Dumont, Doroth´ee Coppieters ’t Wallant, Christian Berthomier, Justinas Narbutas, Maxime Van Egroo, And´e Luxen, Eric Salmon,
Fabienne Collette, Christophe Phillips, Christina Schmidt, Gilles Vandewalle, Age- related decrease in cortical excitability circadian variations during sleep loss and its links with cognition, Neurobiol. Aging. 78 (2019) 52–63, https://doi.org/ 10.1016/j.neurobiolaging.2019.02.004.
[25] A.T. Beck, G. Brown, N. Epstein, R.A. Steer, An inventory for measuring clinical anxiety: psychometric properties, J. Consult. Clin. Psychol. 56 (1988) 893–897,
https://doi.org/10.1037/0022-006X.56.6.893.
[26] Robert A. Steer, Roberta Ball, William F. Ranieri, Aaron T. Beck, Further evidence for the construct validity of the Beck depression Inventory-II with psychiatric outpatients, Psychol Rep. 80 (2) (1997) 443–446.
[27] D.J. Buysse, C.F. Reynolds 3rd, T.H. Monk, S.R. Berman, D.J. Kupfer, The Pittsburgh Sleep Quality Index: a new instrument for psychiatric practice and research, Psychiatry Res. 28 (1989) 193–213.
[28] M.W. Johns, A new method for measuring daytime sleepiness: the Epworth sleepiness scale, Sleep. 14 (1991) 540–545.
[29] Mattis S, Mattis S. Dementia Rating Scale professional manual, Psychol. Assess. Resour. (1998). https://www.mendeley.com/research-papers/dementia-rating- scale-professional-manual-4/?utm_source=desktop&utm_medium=1.18&utm_ campaign=open_catalog&userDocumentId=%7B5749d0f1-f538-4512-b890- 61f8e3e4c787%7D (accessed July 9, 2018).
[30] J.A. Horne, O. ¨Ostberg, A self-assessment questionnaire to determine morningness- eveningness in human circadian rhythms, Int. J. Chronobiol. 4 (1976) 97–110 (accessed November 13, 2017), http://www.ncbi.nlm.nih.gov/pubmed/1027738. [31] R. Huber, H. Maki, M. Rosanova, S. Casarotto, P. Canali, A.G. Casali, G. Tononi,
M. Massimini, Human cortical excitability increases with time awake, Cereb Cortex. 23 (2013) 332–338, https://doi.org/10.1093/cercor/bhs014. [32] J.Q.M. Ly, G. Gaggioni, S.L. Chellappa, S. Papachilleos, A. Brzozowski, C. Borsu,
M. Rosanova, S. Sarasso, B. Middleton, A. Luxen, S.N. Archer, C. Phillips, D.J. Dijk, P. Maquet, M. Massimini, G. Vandewalle, Circadian regulation of human cortical excitability, Nat. Commun. 7 (2016) 11828, https://doi.org/10.1038/ ncomms11828.
[33] J. Virtanen, J. Ruohonen, R. N¨a¨at¨anen, R.J. Ilmoniemi, Instrumentation for the measurement of electric brain responses to transcranial magnetic stimulation, Med Biol Eng Comput. 37 (3) (1999) 322–326.
[34] Zbigniew Leonowicz, Juha Karvanen, Sergei L. Shishkin, Trimmed estimators for robust averaging of event-related potentials, J. Neurosci. Methods. 142 (1) (2005) 17–26, https://doi.org/10.1016/j.jneumeth.2004.07.008.
[35] X.S. Zhang, R.J. Roy, E.W. Jensen, EEG complexity as a measure of depth of anesthesia for patients, IEEE Trans. Biomed. Eng. 48 (2001) 1424–1433, https:// doi.org/10.1109/10.966601.
[36] M. Aboy, R. Hornero, D. Abasolo, D. Alvarez, Interpretation of the Lempel-Ziv complexity measure in the context of biomedical signal analysis, IEEE Trans. Biomed. Eng. 53 (11) (2006) 2282–2288, https://doi.org/10.1109/ TBME.2006.883696.
[37] Anthony T. Barker, An introduction to the basic principles of magnetic nerve stimulation, J. Clin. Neurophysiol. 8 (1) (1991) 26–37, https://doi.org/10.1097/ 00004691-199101000-00005.
[38] Axel Thielscher, Thomas Kammer, Linking physics with physiology in TMS: a sphere field model to determine the cortical stimulation site in TMS, Neuroimage. 17 (3) (2002) 1117–1130, https://doi.org/10.1006/nimg.2002.1282.
[39] J English, B A Middleton, J Arendt, A Wirz-Justice, Rapid direct measurement of melatonin in saliva using an iodinated tracer and solid phase second antibody, Ann. Clin. Biochem. 30 (4) (1993) 415–416.
[40] G.F. Read, Diana R. Fahmy, R.F. Walker, Determination of cortisol in human plasma by radioimmunoassay. Use of the 125I-labelled radioligand, Ann. Clin. Biochem. 14 (1-6) (1977) 343–349.
[41] Paul Pevet, Etienne Challet, Melatonin: Both master clock output and internal time- giver in the circadian clocks network, J. Physiol. 105 (4-6) (2011) 170–182,
https://doi.org/10.1016/j.jphysparis.2011.07.001.
[42] Byron C. Jaeger, Lloyd J. Edwards, Kalyan Das, Pranab K. Sen, An R 2 statistic for fixed effects in the generalized linear mixed model, J. Appl. Stat. 44 (6) (2017) 1086–1105, https://doi.org/10.1080/02664763.2016.1193725.
[43] DJ Dijk, CA Czeisler, Contribution of the circadian pacemaker and the sleep homeostat to sleep propensity, sleep structure, electroencephalographic slow waves, and sleep spindle activity in humans, J. Neurosci. 15 (5) (1995) 3526–3538,
https://doi.org/10.1523/JNEUROSCI.15-05-03526.1995.
[44] Vladyslav V. Vyazovskiy, Umberto Olcese, Erin C. Hanlon, Yuval Nir,
Chiara Cirelli, Giulio Tononi, Local sleep in awake rats, Nature. 472 (7344) (2011) 443–447, https://doi.org/10.1038/nature10009.
[45] E.N. Bruce, M.C. Bruce, S. Vennelaganti, Sample entropy tracks changes in electroencephalogram power spectrum with sleep state and aging, J. Clin. Neurophysiol. 26 (2009) 257–266, https://doi.org/10.1097/
WNP.0b013e3181b2f1e3.
[46] Derk-Jan Dijk, Charles A. Czeisler, Paradoxical timing of the circadian rhythm of sleep propensity serves to consolidate sleep and wakefulness in humans, Neurosci. Lett. 166 (1) (1994) 63–68, https://doi.org/10.1016/0304-3940(94)90841-9. [47] P. Achermann, R. Hartmann, A. Gunzinger, W. Guggenbüh, A.A. Borb´ely,
Correlation Dimension of the Human Sleep Electroencephalogram: Cyclic Changes in the Course of the Night, Eur. J. Neurosci. 6 (1994) 497–500, https://doi.org/ 10.1111/j.1460-9568.1994.tb00292.x.
[48] Anton M.L. Coenen, Neuronal phenomena associated with vigilance and consciousness: from cellular mechanisms to electroencephalographic patterns, Conscious. Cogn. 7 (1) (1998) 42–53, https://doi.org/10.1006/ccog.1997.0324. [49] Karl J. Friston, G. Tononi, O. Sporns, G.M. Edelman, Characterising the complexity
of neuronal interactions, Hum. Brain Mapp. 3 (4) (1995) 302–314, https://doi.org/ 10.1002/hbm.v3:410.1002/hbm.460030405.
[50] G. Tononi, O. Sporns, GM. Edelman, A measure for brain complexity: Relating functional segregation and integration in the nervous system, Proc. Natl. Acad. Sci. U. S. A. 91 (11) (1994) 5033–5037, https://doi.org/10.1073/pnas.91.11.5033. [51] M. Rosanova, A. Casali, V. Bellina, F. Resta, M. Mariotti, M. Massimini, Natural
frequencies of human corticothalamic circuits, J. Neurosci. 29 (24) (2009) 7679–7685, https://doi.org/10.1523/JNEUROSCI.0445-09.2009.
[52] T. Paus, P.K. Sipila, A.P. Strafella, Synchronization of neuronal activity in the human primary motor cortex by transcranial magnetic stimulation: an EEG study, J. Neurophysiol. 86 (4) (2001) 1983–1990, https://doi.org/10.1152/
jn.2001.86.4.1983.
[53] S.L. Chellappa, G. Gaggioni, J.Q.M. Ly, S. Papachilleos, C. Borsu, A. Brzozowski, M. Rosanova, S. Sarasso, A. Luxen, B. Middleton, S.N. Archer, D.J. Dijk,
M. Massimini, P. Maquet, C. Phillips, R.J. Moran, G. Vandewalle, Circadian dynamics in measures of cortical excitation and inhibition balance, Sci. Rep. 6 (2016) 33661, https://doi.org/10.1038/srep33661.
[54] Alberto Fern´andez, Pilar Zuluaga, Daniel Ab´asolo, Carlos G´omez, Anahi Serra, María Andreina M´endez, Roberto Hornero, Brain oscillatory complexity across the life span, Clin. Neurophysiol. 123 (11) (2012) 2154–2162, https://doi.org/ 10.1016/j.clinph.2012.04.025.
[55] Filippo Zappasodi, Laura Marzetti, Elzbieta Olejarczyk, Franca Tecchio, Vittorio Pizzella, Francisco J. Esteban, Age-related changes in
electroencephalographic signal complexity, PLoS One. 10 (11) (2015) e0141995,
https://doi.org/10.1371/journal.pone.0141995.
[56] Nicola L. Barclay, Andriy Myachykov, Sustained wakefulness and visual attention: moderation by chronotype, Exp. Brain Res. 235 (1) (2017) 57–68, https://doi.org/ 10.1007/s00221-016-4772-8.
[57] M. Matousek, J. Wackermann, M. Palus, A. Berankova, V. Albrecht, I. Dvorak, Global dimensional complexity of the eeg in healthy volunteers,