Contents lists available atScienceDirect
Preventive Medicine Reports
journal homepage:www.elsevier.com/locate/pmedrDietary patterns among French-speaking men residing in Montreal, Canada
Karine Trudeau
a,b, Marie-Claude Rousseau
a,b,c, Ilona Csizmadi
d, Marie-Élise Parent
a,b,c,⁎aEpidemiology and Biostatistics Unit, INRS-Institut Armand-Frappier, Institut National de la Recherche Scientifique, University of Quebec, 531 Boul. des Prairies, Laval, QC
H7V 1B7, Canada
bSchool of Public Health, Department of Social and Preventive Medicine, University of Montreal, 7101 avenue du Parc, Montreal, QC H3N 1X9, Canada cUniversity of Montreal Hospital Research Centre, 900 Saint-Denis, Tour Viger, Pavillon R, Montreal, QC H2X 0A9, Canada
dDepartment of Surgery, Cedars-Sinai Medical Center, 8700 Beverly Blvd, Los Angeles, CA 90048, USA
A R T I C L E I N F O Keywords: Dietary patterns French-speaking Men Healthy pattern
Modified Western – Salty pattern Modified Western – Sweet pattern
A B S T R A C T
The purpose of this study was to describe dietary patterns among 1636 French-speaking men residing in Montreal, Canada and to assess sociodemographic and lifestyle characteristics of men adhering to the dietary patterns identified. Participants were population controls from the Prostate Cancer and Environment Study, a case-control study conducted between 2006 and 2011 in Montreal. Information on diet was collected using a food frequency questionnaire, and principal component analysis, a data-driven method and a posteriori method, was used to identify dietary patterns. Three dietary patterns were identified; Healthy, Modified Western – Salty and Modified Western - Sweet patterns accounted for 7.0%, 5.4%, and 3.2% of the variance, respectively. The Healthy pattern was characterized by consumption of fruits, vegetables, vegetable soup, chicken,fish and sea-food, cheese, rice, yogurt, and wine. The Modified Western – Salty pattern included high loadings for beef, pork, chicken, hot-dogs or sausages, cold cuts, bacon, barbecue cooking, meat slightly blackened, potatoes, pasta with tomato sauce, pizza, pastries, dark carbonated soft drinks, ice cream, and white bread. The third pattern, labelled as Modified Western - Sweet, had high loadings of cookies, muffins, cakes, pastries, pies, ice cream, fruits and vegetables. In multivariate analyses, the Healthy pattern was positively associated with higher income and education, moderate recreational physical activity and less heavy smoking, and inversely associated with French ancestry. The Modified Western – Salty pattern was positively associated with French, other European, and Latino ancestries, and with married and common-law relationships. Finally, the Modified Western – Sweet pattern was more common among men of French ancestry and users of vitamin/mineral supplements. The Healthy pattern has been frequently observed in other Western populations, but the other two are described for thefirst time in a study population of men.
1. Introduction
Knowledge of food consumption practices at the population level is essential for drawing comparisons across populations and for mon-itoring changes over time in a population. It is also necessary to en-hance the understanding of the relation between dietary habits and chronic disease risk, which can inform public health recommendations. In industrialized countries, national nutritional surveys are often im-plemented to achieve the aforementioned population health objectives. In Canada, only two major national nutritional surveys have been conducted: the Nutrition Canada Survey in 1971–1972 (National Health and Welfare, 1977) and the Canadian Community Health
Survey, Nutrition Focus in 2004 (Health Canada, 2006). In addition, a few regional provinces-wide surveys, such as the Quebec Nutrition Survey conducted in 1990, have also been carried out, dating back >
25 years (Santé Québec, 1995).
Settled by the French in the 17th century, the province of Quebec harbors a distinctive North American population. Montreal, its most populated agglomeration, is the fourth largest French-speaking city in the world after Paris, Kinshasa and Abidjan. This population shares a number of unique cultural traditions, customs, and lifestyle habits such as Quebec's traditional cuisine (Charbonneau et al., 2000). This high-energy cuisine includes considerable amounts of meat and potatoes (Benoit, 1991). Moreover, as they descend from a limited number of
https://doi.org/10.1016/j.pmedr.2018.12.017
Received 19 December 2017; Received in revised form 8 November 2018; Accepted 28 December 2018
Abbreviations: PCA, principal component analysis; FFQ, food frequency questionnaire; MSA, measure of sampling adequacy; BMI, body mass index
⁎Corresponding author at: Epidemiology and Biostatistics Unit, INRS-Institut Armand-Frappier, University of Quebec, 531 Boul. des Prairies, Laval, Quebec H7V
1B7, Canada.
E-mail addresses:karine.trudeau@iaf.inrs.ca(K. Trudeau),marie-claude.rousseau@iaf.inrs.ca(M.-C. Rousseau),icsizmad@ucalgary.ca(I. Csizmadi), marie-elise.parent@iaf.inrs.ca(M.-É. Parent).
Available online 29 December 2018
2211-3355/ © 2019 The Authors. Published by Elsevier Inc. This is an open access article under the CC BY-NC-ND license (http://creativecommons.org/licenses/BY-NC-ND/4.0/).
founders, its constituents present a relatively homogeneous genetic background (Bherer et al., 2011;Roy-Gagnon et al., 2011). Because of these characteristics, French-speaking Montrealers represent an inter-esting population to study the role of diet in disease development. Furthermore, in the province of Quebec, men report poorer lifestyle habits than women, particularly in terms of alcohol consumption, ci-garette use and diet (Tremblay, 2013), making these an important target for primary prevention.
In recent years, there has been a growing interest in the analysis of dietary patterns in relation to disease development (Hodge and Bassett, 2016). A dietary pattern is defined as a set of foods and nutrients that represents the complex nature of dietary intakes in a population of interest. Foods and nutrients are often correlated with each other and can interact in ways that make it difficult to determine their individual health effects. As a result, interest has developed in the study of dietary patterns as a means of mitigating the challenges in the study of diet and health (Jacobs Jr. et al., 2009). The overall impact of dietary patterns may also be more substantial and feasible to detect than single foods and nutrients in isolation. Importantly, dietary patterns may be more amenable to health promotion and chronic disease prevention since they are more closely aligned with overall dietary habits that may be more easily translated into public health recommendations (Hu, 2002; Newby and Tucker, 2004).
Although there are a few studies on dietary patterns in general adults in Quebec (Beaudry et al., 1998; Gougeon et al., 2015; Alles et al., 2016), none focused on men alone. Thus, we elected to use principal component analysis (PCA), an a posteriori or data-driven method (Gu and Scarmeas, 2011;Alles et al., 2012). A Healthy pattern emerged as the most common dietary pattern in studies published be-tween 1981 and 2017 of Caucasian men from all over the world (Hu et al., 2000;van Dam et al., 2002;Perrin et al., 2005;Wu et al., 2006; McNaughton et al., 2007;Varraso et al., 2007;Campbell et al., 2008; Lau et al., 2008;Chan et al., 2013;Bai et al., 2015;Arabshahi et al., 2016;Ax et al., 2016). Also, distinctive dietary patterns could poten-tially be identified because this population's cuisine draws elements from both French and American influences. Given their common an-cestry and greater homogeneity in genetic background, Canadians of French descent are of particular interest for health research (Zhou et al., 2016;Carbonneau et al., 2018;Paquette et al., 2018). Better knowledge of dietary patterns can inform future health studies in this population, as diet often needs to be considered as a main factor or as a covariate as part of analyses.
The objectives of this study were: 1) to identify dietary patterns among French-speaking adult men from Montreal, Canada and; 2) to assess the sociodemographic and lifestyle characteristics of men ad-hering to the dietary patterns identified.
2. Methods 2.1. Study population
This analysis is set among controls within PROtEuS (Prostate Cancer & Environment Study), a population-based case-control study which aims at identifying risk factors for prostate cancer. The design of this study, conducted in Montreal, was described previously (Blanc-Lapierre et al., 2015). Briefly, incident cases of prostate cancer were ascertained in 2005–2009 across the seven largest French-language hospitals in Montreal. Concurrently, a population control series was constituted by randomly sampling French speaking men residing in Montreal from the provincial permanent electoral list, and frequency-matching them to prostate cancer cases by age ( ± 5 years). Eligible controls had no his-tory of prostate cancer. In all, 1919 cases and 1991 controls aged 39–75 years were recruited; participation rates were 79% for cases and 56% for controls. Reasons for non-participation were refusal (86%), unable to trace (11%), death with no proxy respondent available (1%), language barrier (1%) and too sick to participate (1%) among controls.
The present analysis was restricted to the 1636 controls (82% of participating controls) that chose to have their interviews conducted in French.
2.2. Data collection
Between 2006 and 2011, face-to-face interviews were conducted to collect information on sociodemographic, lifestyle and environmental factors. Dietary information was obtained by means of a 63-item food frequency questionnaire (FFQ). The FFQ was based on a validated in-strument developed by the Canadian Cancer Registries Epidemiology Research Group, with minor modifications to reflect the specificity of the study population (Pan et al., 2004). Subjects were asked about their consumption of food at home, at work and restaurants, two years prior to the interview. Food intake was recorded in terms of the frequency of use per day, week or month of commonly used portions. Given seasonal variations in consumption, participants were asked how many months per year they ate various fruits. Complementary questions on the con-sumption of fat from meat, skin of poultry and cooking methods were also included. Data on lifelong use of coffee, black tea, green tea, beer, wine and spirits were collected and the consumption level two years before the interview was used for analysis. The study was approved by the ethics boards of all participating institutions (Supplementary ma-terial Table 1) and subjects provided written informed consent.
2.3. Statistical analysis
Our main analysis was conducted on the entire sample of French-speaking controls. In order to identify dietary patterns, PCA was per-formed on the correlation matrix of the weekly intake of the 72 fol-lowing variables: the 63 items from the FFQ, coffee, black tea, green tea, beer, wine and spirits consumption, and the three complementary questions. Dietary variables were log transformed because of skewed distributions. Bartlett's test of sphericity and the Kaiser-Meyer-Olkin measure of sampling adequacy (MSA) were used to verify the appro-priateness of the PCA. The correlation matrix determinant was used to confirm the absence of an identity or singular matrix (Norman and Streiner, 2008). The principal axis method was used to extract the components, followed by a varimax (orthogonal) rotation. To ensure that the components were independent, an oblique rotation was per-formed. A component was retained when it met the following criteria: eigenvalue > 2.0, identification of a breaking point in the scree plot and factor interpretability (Norman and Streiner, 2008).
Variables were considered to load on a component if they had an absolute factor loading ≥0.2 (Norman and Streiner, 2008). Dietary patterns were labelled according to the variables loaded on a retained component. As an additional assessment of the robustness of the dietary patterns identified, we re-ran the analysis by randomly placing subjects into one of two equal sized groups, or split-samples, and a sensitivity analysis was performed on French-speaking men who were explicitly of French descent. The factor score for each dietary pattern was computed by determining the optimal regression weights, multiplying subjects' answers to the questionnaire items by these weights and summing the products. Then, each dietary pattern was categorized into quartiles based on the distribution of factor scores. Differences in socio-demographic and lifestyle characteristics between subjects adhering to the different quartiles of each dietary pattern were detected by ANOVA and the chi-square test. Associations between sociodemographic and lifestyle characteristics and dietary patterns were also examined with multivariate linear regression models. All analyses were performed using SAS (version 9.4; SAS Institute, Cary, NC.).
3. Results
3.1. Study population
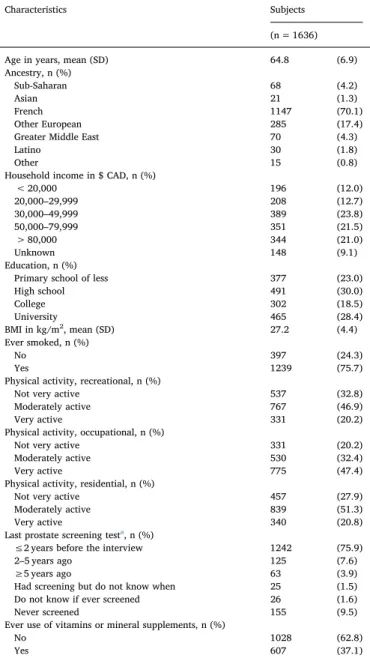
Table 1 presents selected sociodemographic and lifestyle char-acteristics of the 1636 French-speaking male participants. Their mean age was 65 years, and most were Canadians of French descent (70%), of other European ancestry (17%) or of African descent (4%). For 23% of subjects, the educational level attained was primary school or less. About 25% of men had a yearly family income below $CAD30,000. On average, men were overweight at the time of dietary assessment with a mean body mass index (BMI) of 27.2 kg/m2 (World Health
Organization, 2000), 76% had ever smoked, 47% reported their occu-pational physical activity level as very active, and 37% of men had used vitamin or mineral supplements. We compared study participants and non-participants using four ecological variables derived from census tract data for 2006. The percentages of subjects living in areas with a greater proportion of recent immigrants were 5% and 6%, for
participants and non-participants, respectively. Corresponding values were 7% and 7% for higher unemployment rate, 19% and 20% of adults without a high school diploma, and 22% and 25% in the lowest quintile of household income, suggesting a slight trend towards higher socio-economic status among participants, a feature commonly encountered. 3.2. Dietary patterns
The correlation matrix was neither a singular nor an identity matrix, according to its determinant and to Bartlett's test of sphericity (Norman and Streiner, 2008). The global MSA was 0.83 which is meritorious according to Kaiser and Rice (Kaiser and Rice, 1974). Four variables (margarine on potatoes, vegetables or bread; butter on potatoes, ve-getables or bread; skin on poultry; and spirits) had a MSA < 0.5 and were not retained for subsequent analysis. After an orthogonal rotation, a three components solution emerged; results are shown inTable 2. The eigenvalues were 5.94, 4.70 and 2.55 and the variance explained by these three components was 15.6%. The three retained components were identified as distinct dietary patterns, labelled respectively as Healthy, Modified Western – Salty, and Modified Western – Sweet. The Healthy pattern was characterized by high consumption of fruits, ve-getables, chicken, turkey or other poultry, veal, lamb,fish and seafood, cheese, yogurt or wine, and no consumption of white bread, donuts, cakes, pastries or pies. The Modified Western – Salty pattern included high loadings for beef, pork, chicken, hot-dogs or sausages, cold cuts, bacon, breakfast sausages, barbecue cooking, meat slightly blackened, fried or pan fried potato, not-fried potato, pasta with tomato sauce, pizza, donuts, cakes, pastries, pies, dark carbonated soft drinks, ice cream, white bread, and no consumption of brown bread. The final pattern was labelled Modified Western – Sweet, based on its high loadings of cookies, muffins, donuts, cakes, pastries, pies, oatmeal or cream of wheat, breakfast cereals, ice cream, fruits and vegetables.
Sociodemographic and lifestyle characteristics of study subjects differed according to the degree to which they aligned with the three dietary patterns identified, as shown inTable 3. When compared to men whose factor scores placed them in the lowest quartile, those in the highest quartile of the Healthy pattern were more likely to have com-pleted college or university, to have a family income higher than $CAD50,000, to ever have had a prostate cancer screening test, to be of African or European (other than French) ancestry, and from the Greater Middle East. Men in the highest quartile of the Modified Western – Salty pattern were more likely to be younger, to be of French descent, to have a family income higher than $CAD50,000, to have a higher BMI and to have ever smoked, compared to men in the lowest quartile. Finally, men in the highest quartile of the Modified Western – Sweet pattern were more likely to be of French descent and to have completed high school, as compared to men in the lowest quartile.
Associations between sociodemographic, lifestyle characteristics and dietary patterns were also examined with multivariate linear re-gression models, as shown inTable 4. Among all factors considered, only a few were associated with the dietary pattern scores, upon mutual adjustments. French ancestry and heavy cigarette smoking showed an inverse association with the Healthy pattern, whereas higher family income and education level, as well as being moderately active re-creationally were positively associated with this pattern. Age was in-versely associated with the Modified Western – Salty pattern score, whereas French, other European and Latino ancestries, heavy cigarette smoking, married and common law relationships were positively as-sociated. Finally, French ancestry and ever use of vitamin or supple-ments were positively associated with the Modified Western – Sweet pattern score, whereas heavy cigarette smoking was negatively asso-ciated with it. No association was found with any of the patterns for BMI, and health-related behaviors such as occupational and residential physical activity, or prostate cancer screening.
In analyses of French-speaking men who were explicitly of French descent, results were consistent with those from the main analyses (data Table 1
Selected sociodemographic and lifestyle characteristics of French-speaking male subjects, Montreal, Canada, 2006–2011.
Characteristics Subjects (n = 1636) Age in years, mean (SD) 64.8 (6.9) Ancestry, n (%)
Sub-Saharan 68 (4.2)
Asian 21 (1.3)
French 1147 (70.1)
Other European 285 (17.4) Greater Middle East 70 (4.3)
Latino 30 (1.8)
Other 15 (0.8)
Household income in $ CAD, n (%)
< 20,000 196 (12.0) 20,000–29,999 208 (12.7) 30,000–49,999 389 (23.8) 50,000–79,999 351 (21.5) > 80,000 344 (21.0) Unknown 148 (9.1) Education, n (%)
Primary school of less 377 (23.0)
High school 491 (30.0) College 302 (18.5) University 465 (28.4) BMI in kg/m2, mean (SD) 27.2 (4.4) Ever smoked, n (%) No 397 (24.3) Yes 1239 (75.7)
Physical activity, recreational, n (%)
Not very active 537 (32.8) Moderately active 767 (46.9)
Very active 331 (20.2)
Physical activity, occupational, n (%)
Not very active 331 (20.2) Moderately active 530 (32.4)
Very active 775 (47.4)
Physical activity, residential, n (%)
Not very active 457 (27.9) Moderately active 839 (51.3)
Very active 340 (20.8)
Last prostate screening testa, n (%)
≤2 years before the interview 1242 (75.9) 2–5 years ago 125 (7.6)
≥5 years ago 63 (3.9)
Had screening but do not know when 25 (1.5) Do not know if ever screened 26 (1.6) Never screened 155 (9.5) Ever use of vitamins or mineral supplements, n (%)
No 1028 (62.8)
Yes 607 (37.1)
Table 2
Weekly intake of 68 food and beverage items and rotated factor loadings for itemsa.
Food and beverage items Servings per week (SD) Rotated factor loadings Pattern 1
Healthy
Pattern 2
Modified Western – Salty
Pattern 3
Modified Western – Sweet
Banana 2.7 (2.73) 0.16 −0.19 0.32b
Apple, pear 2.8 (3.40) 0.32 −0.14 0.14
Orange, grapefruit, tangerine, clementine 2.3 (2.94) 0.35 −0.12 0.08
Peach, nectarine 0.6 (1.34) 0.33 −0.08 −0.06
Canned fruit, fruit sauce, fruit salad 0.7 (1.60) −0.02 0.06 0.30
Apricot 0.2 (0.88) 0.34 −0.07 −0.07
Cantaloupe 0.5 (0.90) 0.45 −0.03 0.02
Watermelon, honeydew melon 0.4 (0.66) 0.41 −0.03 −0.03 Strawberry, raspberry, blueberry 1.1 (1.50) 0.32 −0.05 0.23
Other fresh fruit 1.6 (1.89) 0.47 −0.05 0.22
Potato, fried or pan fried 0.8 (1.00) −0.08 0.52 −0.04
Potato, not fried 2.6 (2.30) −0.12 0.30 0.42
Sweet potato 0.2 (0.61) 0.07 −0.02 0.16
Baked bean, other legume or lentil 0.9 (1.16) 0.33 −0.06 0.09
Broccoli 1.3 (1.36) 0.44 −0.07 0.31
Carrot 2.1 (1.89) 0.29 0.03 0.49
Spinach 0.5 (0.76) 0.46 −0.09 0.04
Coleslaw, cabbage, cauliflower, Brussel sprout 0.9 (1.10) 0.35 0.05 0.18
Dark lettuce 2.4 (2.26) 0.62 0.08 0.05
Tomato 3.0 (2.36) 0.52 0.18 0.05
Sweet red pepper 0.9 (1.35) 0.47 0.06 0.04
Other vegetable 2.8 (2.16) 0.39 0.11 0.13
Tomato soup or cream of tomato 0.4 (0.70) 0.04 0.23 0.28
Vegetable soup 1.3 (1.51) 0.22 0.10 0.40
Tofu, soybean 0.2 (0.62) 0.16 −0.17 0.17
Ketchup, salsa 0.8 (1.32) −0.08 0.36 0.24
Salad dressing, mayonnaise (excl. low fat) 2.3 (2.31) 0.45 0.26 0.09
Beef 1.9 (1.42) −0.09 0.50 0.13
Pork 1.1 (0.90) 0.03 0.32 0.13
Chicken, turkey or other poultry 1.9 (1.07) 0.21 0.15 0.13
Veal, lamb 0.4 (0.60) 0.38 0.04 −0.16
Liver 0.2 (0.30) 0.14 0.12 0.07
Hot-dog or sausage 0.4 (0.60) −0.05 0.44 −0.03
BBQ 1.1 (1.41) 0.21 0.35 −0.12
Cold cuts 1.3 (1.66) −0.01 0.40 0.04
Bacon, breakfast sausage 0.5 (0.94) −0.10 0.51 0.05
Fish, seafood 1.3 (1.00) 0.41 −0.13 0.08
Egg, omelet or quiche 1.8 (1.74) 0 0.30 0.14
Cheese 3.9 (2.79) 0.26 0.26 0.11
Pasta with tomato sauce 1.1 (0.93) 0.13 0.30 −0.07 Pasta with cheese without tomato sauce 0.2 (0.43) −0.03 0.14 −0.01
Pizza 0.4 (0.57) 0.03 0.25 −0.07
Cookie, muffin 2.5 (3.40) −0.15 0.11 0.34
White bread 6.0 (8.55) −0.25 0.30 −0.15
Brown bread 5.7 (7.09) 0.11 −0.27 0.28
Rice 1.6 (1.74) 0.20 −0.13 0.04
Donut, cake, pastry and pie 1.5 (2.37) −0.21 0.26 0.33 Oatmeal or cream of wheat 0.5 (1.30) 0.06 −0.14 0.30
Breakfast cereal 2.0 (2.52) 0.09 −0.19 0.40
Real fruit juice 3.8 (4.23) 0.03 0.02 0.19
Tomato or vegetable juice 1.2 (1.90) 0.03 0.22 0.25 Glass of milk or milk in cereal 4.7 (5.95) 0.03 −0.10 0.42 Cream or milk in coffee or tea 12.0 (14.14) −0.11 0.31 0 Dark carbonated soft drink 2.6 (6.93) −0.17 0.37 0.06 Other carbonated soft drink 0.9 (2.65) −0.07 0.09 0.01
Fried food 0.3 (0.57) 0.04 0.20 0
Nut or peanut butter 2.8 (2.87) 0.15 −0.04 0.33
Chips, corn chips, popcorn, tortilla 0.9 (1.61) −0.02 0.38 0.08
Chocolate 0.8 (1.75) 0.04 0.18 0.17
Yogurt 2.4 (3.00) 0.20 −0.17 0.31
Ice cream 0.8 (1.42) −0.01 0.23 0.27
Fat of beef or pork 1.6 (34.92) −0.04 −0.08 0
Meat slightly blackened 1.0 (1.82) 0.12 0.47 −0.05
Coffee 15.3 (14.91) −0.05 0.28 −0.05
Black tea 2.6 (7.01) 0 0.05 0.12
Green tea 1.3 (4.16) 0.15 −0.09 0.14
Beer 3.8 (9.82) −0.08 0.18 −0.09
Wine 4.3 (7.02) 0.32 0.02 −0.29
Proportion of variance explained (%) 7.0 5.4 3.2
Cumulative variance explained (%) 7.0 12.4 15.6
b Variables were considered to load on a component if they had an absolute factor loading≥0.2.
Table 3
Selected sociodemographic and lifestyle characteristics of 1636 French-speaking male subjects by quartile of dietary pattern scores, Montreal, Canada 2006–2011a.
Characteristics Pattern 1 Healthy
Pattern 2
Modified Western - Salty
Pattern 3
Modified Western - Sweet
Q1 Q2 Q3 Q4 Q1 Q2 Q3 Q4 Q1 Q2 Q3 Q4 Age in years, mean (SD) p = 0.10b p < 0.001b p < 0.007b
65 (7) 65 (7) 64 (7) 65 (7) 66 (7) 65 (7) 65 (7) 63 (7) 64 (7) 65 (7) 64 (7) 66 (7) Ancestry, % p < 0.001c p < 0.001c p < 0.001c Sub-Saharan 3 4 4 6 12 3 2 0 7 5 3 2 Asian 1 1 2 1 4 1 1 0 2 2 1 0 French 80 75 68 58 54 70 75 82 47 70 80 84 Other European 13 13 18 25 17 18 19 16 32 15 13 10
Greater Middle East 2 4 4 7 9 6 2 1 9 5 2 2
Latino 1 2 3 2 3 2 2 1 2 2 2 1
Other 1 1 1 1 1 1 1 1 2 1 1 1
Annual household income in $ CAD, % p < 0.001c p < 0.001c p = 0.16c
< 20,000 22 12 9 5 20 13 9 5 13 12 9 14 20,000–29,999 15 15 10 11 15 15 11 10 14 13 12 13 30,000–49,999 27 27 24 18 25 24 25 21 21 25 25 25 50,000–79,999 16 22 23 25 17 19 24 25 19 21 23 23 > 80,000 11 15 25 33 12 18 23 32 22 23 23 16 Other 8 11 9 8 11 11 8 7 11 7 8 10 Education, % p < 0.001c p = 0.28c p = 0.09c
Primary school or less 35 27 18 13 23 25 25 20 24 20 24 25
High school 38 32 31 20 27 28 31 34 27 29 29 35 College 14 18 19 24 20 18 16 21 16 22 18 18 University 13 24 33 44 30 30 28 26 32 30 29 23 BMI in kg/m2, mean (SD) p = 0.05c p < 0.001c p = 0.34c Underweight < 18.5 3 1 2 1 4 1 1 1 2 2 1 2 Normal weight [18.5–24.9] 32 26 29 31 37 29 26 25 30 31 26 30 Pre-obesity [25.0–29.9] 41 50 49 47 43 50 50 45 45 44 54 45 Obesity class 1 [30.0–34.9] 18 18 14 18 12 14 19 23 19 19 14 16 Obesity class 2 [35.0–39.9] 5 5 5 2 3 4 4 5 3 4 4 5 Obesity class 3 > 40 2 1 1 2 1 2 1 2 1 1 1 2
Number of cigarettes in pack-years p < 0.001c p < 0.001c p = 0.11c
Tertile 1 [1–3.9] 23 33 33 43 44 34 26 28 30 30 34 38 Tertile 2 [3.9–31.5] 25 29 41 36 31 33 37 30 33 33 35 30 Tertile 3 > 31.5 51 38 26 21 24 34 36 42 37 36 31 32 Physical activity, recreational, % p < 0.001c p = 0.03c p = 0.28c
Not very active 50 37 25 19 38 36 28 29 36 33 29 33 Moderately active 35 44 53 56 45 44 50 49 46 48 49 44
Very active 15 20 22 25 17 20 23 23 18 18 22 23
Physical activity, occupational, % p = 0.05c p = 0.75c p = 0.31c
Not very active 15 19 22 24 18 22 19 22 17 22 22 21 Moderately active 33 32 32 33 34 32 32 32 30 32 34 33
Very active 51 50 46 43 48 46 49 46 52 46 44 47
Physical activity, residential, % p < 0.001c p < 0.006c p = 0.24c
Not very active 42 29 22 19 33 33 24 23 30 30 28 24 Moderately active 42 52 56 56 46 46 57 57 51 52 50 52
Very active 16 19 23 25 21 22 20 21 19 18 23 24
Timing of last prostate screening testd, % p < 0.0003c p = 0.19c p = 0.57c
< 2 years ago 69 75 79 82 76 79 74 75 72 78 75 78
2–5 years ago 8 9 8 6 6 9 8 7 9 5 8 9
≥5 years ago 4 4 3 5 4 4 4 4 5 4 4 3
Had screening but do not know when 3 2 1 1 1 2 2 2 2 2 2 1 Do not know if ever screened 2 2 2 1 3 1 1 2 2 1 2 2
Never screened 14 10 8 6 11 6 11 11 12 10 10 7
Number of screening tests in previous 5 yearse, % p < 0.001c p = 0.32c p = 0.49c
0 20 15 13 12 16 11 15 17 17 15 16 12
1–4 29 32 32 29 29 30 30 33 30 30 30 33
≥5 37 42 48 52 45 49 49 41 42 46 46 45
Unknown 15 11 8 7 10 10 10 10 11 9 9 11
Ever use of vitamins or mineral supplements, % p = 0.07c p = 0.47c p < 0.001c
No 67 66 60 58 61 61 63 66 73 64 58 57
Yes 33 34 40 42 39 39 37 34 27 36 42 44
a Numbers within table may not sum to 100% due to missing data and participants who did not know. b p-Value resulting from ANOVA comparing means across the four quartiles.
c p-Value resulting from chi-square test comparing proportions across the four quartiles. dScreening test by prostate-specific antigen (PSA) and/or digital rectal exam (DRE). e Screening test by PSA.
Table 4
Associationsabetween sociodemographic and lifestyle characteristics and dietary pattern scores (n = 1636).
Pattern 1 Healthy
Pattern 2
Modified Western - Salty
Pattern 3
Modified Western - Sweet
β 95% CI β 95% CI β 95% CI
Age 0.005 [−0.01; 0.02] −0.02 [−0.04; −0.01]b 0.003 [−0.01; 0.02]
Ancestry
Sub-Saharan Reference Reference Reference
Asian −0.25 [−1.11; 0.60] 0.20 [−0.67; 1.08] −0.55 [−1.48; 0.38] French −0.50 [−0.95; −0.06] 1.31 [0.85; 1.76] 0.66 [0.17; 1.14] Other European −0.07 [−0.55; 0.41] 1.17 [0.68; 1.66] −0.02 [−0.54; 0.50] Greater Middle East 0.09 [−0.50; 0.67] 0.59 [−0.01; 1.19] −0.20 [−0.84; 0.44] Latino 0.06 [−0.68; 0.80] 0.90 [0.14; 1.66] 0.03 [−0.78; 0.83] Other −0.44 [−1.42; 0.54] 0.98 [−0.02; 1.98] −0.12 [−1.19; 0.94] Annual household income in $ CAD
< 20,000 Reference Reference Reference
20,000–29,999 0.29 [−0.06; 0.64] 0.007 [−0.35; 0.36] −0.007 [−0.39; 0.37] 30,000–49,999 0.24 [−0.08; 0.56] 0.02 [−0.30; 0.35] −0.02 [−0.37; 0.33] 50,000–79,999 0.47 [0.13; 0.81] 0.20 [−0.15; 0.54] −0.08 [−0.45; 0.29] > 80,000 0.54 [0.16; 0.91] 0.31 [−0.07; 0.69] −0.24 [−0.65; 0.17] Other 0.30 [−0.09; 0.69] −0.11 [−0.51; 0.29] −0.09 [−0.52; 0.34] Education
Primary school or less Reference Reference Reference
High school 0.07 [−0.17; 0.31] −0.11 [−0.23; 0.26] 0.02 [−0.25; 0.28] College 0.36 [0.08; 0.65] −0.19 [−0.48; 0.11] −0.14 [−0.45; 0.17] University 0.46 [0.17; 0.74] −0.17 [−0.46; 0.12] −0.21 [−0.52; 0.10] Marital status
Single Reference Reference Reference
Married 0.27 [−0.07; 0.61] 0.57 [0.22; 0.92] 0.08 [−0.29; 0.45] Common law 0.15 [−0.25; 0.55] 0.45 [0.04; 0.85] −0.04 [−0.48; 0.39] Separated 0.07 [−0.54; 0.67] 0.22 [−0.39; 0.84] −0.03 [−0.69; 0.62] Divorced −0.09 [−0.50; 0.32] 0.27 [−0.15; 0.68] −0.05 [−0.49; 0.40] Widower 0.002 [−0.51; 0.52] 0.12 [−0.41; 0.65] 0.14 [−0.43; 0.70] Member of religious order 0.62 [−0.70; 1.94] 0.27 [−1.08; 1.62] 0.20 [−1.24; 1.63] BMI in kg/m2
Underweight < 18.5 Reference Reference Reference
Normal weight [18.5–24.9] 0.22 [−0.54; 0.97] 0.03 [−0.74; 0.81] −0.06 [−0.89; 0.76] Pre-obesity [25.0–29.9] 0.20 [−0.56; 0.96] 0.12 [−0.65; 0.89] −0.07 [−0.89; 0.75] Obesity class 1 [30.0–34.9] 0.23 [−0.54; 1.01] 0.35 [−0.44; 1.14] −0.09 [−0.93; 0.75] Obesity class 2 [35.0–39.9] 0.18 [−0.67; 1.04] 0.31 [−0.56; 1.18] 0.09 [−0.84; 1.02] Obesity class 3 > 40 0.22 [−0.88; 1.31] 0.22 [−0.90; 1.34] 0.30 [−0.90; 1.49] Number of cigarettes in pack-years
Tertile 1 [1–3.9] Reference Reference Reference
Tertile 2 [3.9–31.5] 0.007 [−0.20; 0.22] 0.14 [−0.07; 0.36] −0.12 [−0.35; 0.11] Tertile 3 > 31.5 −0.26 [−0.48; −0.04] 0.28 [0.06; 0.50] −0.25 [−0.49; −0.02] Physical activity
Recreational
Not very active Reference Reference Reference
Moderately active 0.27 [0.06; 0.49] 0.06 [−0.15; 0.28] 0.02 [−0.21; 0.25] Very active 0.22 [−0.05; 0.49] 0.02 [−0.25; 0.30] 0.08 [−0.22; 0.37] Occupational
Not very active Reference Reference Reference
Moderately active −0.06 [−0.31; 0.19] −0.04 [−0.30; 0.21] −0.07 [−0.34; 0.20] Very active 0.001 [−0.25; 0.25] −0.02 [−0.28; 0.23] −0.26 [−0.53; 0.02] Residential
Not very active Reference Reference Reference
Moderately active 0.19 [−0.03; 0.40] 0.16 [−0.06; 0.39] 0.05 [−0.18; 0.29] Very active 0.19 [−0.09; 0.47] 0.05 [−0.24; 0.33] 0.16 [−0.14; 0.46] Timing of last prostate cancer screening testsc
< 2 years ago Reference Reference Reference
2–5 years ago −0.10 [−0.43; 0.24] 0.08 [−0.26; 0.42] −0.006 [−0.37; 0.36] ≥5 years ago 0.14 [−0.38; 0.65] −0.22 [−0.74; 0.30] −0.09 [−0.65; 0.47] Had screening but do not know when −0.09 [−0.83; 0.64] 0.14 [−0.61; 0.90] −0.09 [−0.89; 0.72] Do not know if ever screened 0.31 [−0.44; 1.06] −0.18 [−0.95; 0.58] 0.01 [−0.80; 0.83] Never screened −0.26 [−0.78; 0.25] −0.05 [−0.58; 0.47] −0.08 [−0.64; 0.48] Number of screening tests in previous 5 yearsd
0 Reference Reference Reference
1–4 0.01 [−0.44; 0.46] −0.10 [−0.56; 0.36] 0.10 [−0.39; 0.59] ≥5 0.05 [−0.41; 0.50] −0.12 [−0.58; 0.35] −0.04 [−0.54; 0.45] Unknown −0.29 [−0.78; 0.20] 0.003 [−0.50; 0.51] 0.009 [−0.53; 0.54] Ever use of vitamins or mineral supplements
No Reference Reference Reference
Yes 0.08 [−0.10; 0.26] −0.08 [−0.27; 0.09] 0.23 [0.04; 0.42] Unknown −1.56 [−5.02; 1.90] 0.18 [−3.34; 3.71] 0.06 [−3.70; 3.81]
a Associations were estimated with multivariate linear models adjusted for all sociodemographic and lifestyle characteristics variables altogether in a same model.
not shown). 4. Discussion
We aimed to identify dietary patterns in a distinctive North American population strongly influenced by a French heritage. To our knowledge, this is thefirst report of dietary patterns restricted to men only in Montreal, QC. Three dietary patterns were identified using PCA. The highest percentage of variance was explained by the Healthy pat-tern (7.0%), followed by the Modified Western – Salty pattern (5.4%) and the Modified Western – Sweet food pattern (3.2%).
In univariate analyses based on scores' quartiles, several associa-tions emerged between sociodemographic and lifestyle characteristics, and the three dietary patterns. However, many of these disappeared in multivariate linear models. The Healthy pattern was associated with higher income and education, moderate recreational physical activity and less heavy smoking, reflecting that a higher socioeconomic status results in healthier dietary and lifestyle choices. The Modified Western – Salty pattern was associated with French, other European, and Latino ancestry, and with married and common-law relationships, who ap-parently resorted more often to eating highly processed foods and ra-pidly-prepared meals. Also, age was inversely associated with this food pattern, in accordance with previous observations that younger men in Quebec report a lower food quality (Tremblay, 2013). Finally, the Modified Western – Sweet pattern was more common among men of French ancestry and users of vitamin/mineral supplements. Men eating this unique dietary pattern had a preference for both nutritious (fruits and vegetables) and less nutritious (cookies, muffins, donuts, cakes, pastries, pies, and ice cream) sweet foods. After multivariate adjust-ments, no association was observed between BMI, timing and frequency of prostate cancer screening, and any of the dietary patterns. Men ad-hering to a healthier dietary pattern could have been expected to have been screened more frequently and recently. Our findings probably reflect the fact that there is universal access to healthcare in Quebec, and screening was often part of yearly exams at the time of study, ir-respective of subjects' characteristics.
4.1. Previous studies
Even though several studies on dietary patterns have been published since thefirst report bySchwerin et al. (1981)none of them addressed data-driven dietary patterns of men only in the province of Quebec. Supplementary material Table 2 presents the 22 studies on dietary patterns of Caucasian men published since 1981. It shows that two dietary patterns were identified in 9 of the 22 studies, with the two most often identified patterns being the Healthy and the Western pat-terns (Hu et al., 2000;van Dam et al., 2002;Perrin et al., 2005;Wu et al., 2006;McNaughton et al., 2007;Varraso et al., 2007;Campbell et al., 2008; Lau et al., 2008; Chan et al., 2013; Bai et al., 2015; Arabshahi et al., 2016;Ax et al., 2016). Five of 22 studies identified three dietary patterns (Tseng et al., 2004; Ambrosini et al., 2008; Charreire et al., 2011;Ruusunen et al., 2014;Shin et al., 2015). In all 22 studies, a Healthy pattern or a Prudent pattern or a dietary pattern rich in fruit and vegetables was identified, a pattern rich in meat was identified six times, and the Modified Western – Sweet pattern was never reported. Most Healthy or Prudent patterns included the fol-lowing foods: fruits, vegetables, andfish. As it is the first time that a Healthy, Modified Western – Salty and Modified Western – Sweet pat-terns are identified together among Caucasian men, these findings are novel. The proportion of variance explained in our study (15.6%) is comparable to that observed in the aforementioned studies, which ranged from 10.80 to 32.84%. It is noteworthy than even in studies of
French or Canadians, the number and name of dietary patterns were different. Indeed, in studies from France,Perrin et al. (2005)identified 2 dietary patterns: Western and Prudent (total variance explained: 26.7%) andCharreire et al. (2011)identified the patterns Alcohol & meat, Healthy food and Convenience food (total variance explained: 17.6%). Among studies of Canadians, one (Walker et al., 2005) found 4 dietary patterns: Healthy living, Traditional Western, Processed, Bev-erages (total variance explained: 10.5%), whileCampbell et al. (2008) found 2 dietary patterns: Prudent and Western (total variance ex-plained: 8.0%). Prudent and Western dietary patterns were the most common regardless of the country (Hu et al., 2000; van Dam et al., 2002; Perrin et al., 2005; Wu et al., 2006; Varraso et al., 2007; Campbell et al., 2008;Chan et al., 2013;Bai et al., 2015). In summary, the results obtained in our study are unique, with Healthy, Modified Western – Salty and Modified Western - Sweet patterns identified, possibly resulting from the mixture between French cuisine and Wes-tern influences.
A study published byAlles et al. (2016)looked at the dietary pat-terns of men and women in France and in Quebec. The dietary patpat-terns of Quebecers were derived from the Quebec Longitudinal Study on Nutrition and Successful Aging (NuAge), including 763 men and 833 women aged 67–84 years at baseline in 2003–2005. Participants were selected from a random sample of the Quebec Medicare database using stratified sampling by age and sex. Three dietary patterns were ob-tained by factor analysis (men and women combined): Healthy, Wes-tern and Traditional patWes-terns. These three patWes-terns explained 53.5% of the total variance, which is much higher than in our study. Similarly to us, they identified three dietary patterns and both studies observed a healthy pattern. The NuAge study focused on older men and women (mean age = 74 years), whereas ours focused on men only (mean age = 65 years). The presence of a Western pattern and of a Traditional pattern in NuAge could be explained by the older age of participants, who could have been adhering more closely to older customs. It is in-teresting to note that in both the NuAge study and ours, a higher educational level was associated with the Healthy pattern, reflecting higher intakes of fruits and vegetables, white meat andfish. Moreover, smoking was associated with the Western pattern in NuAge and with the Modified Western – Salty pattern in our study, highlighting the link between less healthy lifestyle choices and a diet of lower nutritional quality.
4.2. Methodological considerations
Our study harbors several important strengths. This is the largest nested cross-sectional study to date to identify dietary patterns among Caucasian men. Indeed, other cross-sectional analyses nested within case-control studies included between 447 controls and 1475 controls (Randall et al., 1990;Ambrosini et al., 2008;Campbell et al., 2008; Chan et al., 2013), in comparison with 1636 men in our study. Although the participation rate was relatively good (56%), self-selection of study subjects might have compromised to some extent the generalization of findings to the base population e.g. French-speaking Montreal residents. Nevertheless, comparisons of participants and non-participants in our study based on census-derived variables indicated minimal differences between the two groups, alleviating concerns for selection bias. By comparison,Xu (2016)reported a median participation rate of 63% among population controls in 100 studies published in 1991–2000 and 53% in 46 studies published in 2001–2010. The median participation rate was 67% in 216 studies among North American population con-trols and 66% in 156 studies with in-person data collection such as ours. Another strength of the study is the use of PCA to derive dietary patterns. Since dietary profiles of men in Montreal have never been
b Value in bold are statistically significant.
c Screening test by prostate-specific antigen (PSA) and/or digital rectal exam (DRE). dScreening test by PSA only.
reported, an a posteriori method or data-driven was the most appro-priate approach to identify potentially new patterns. Moreover, as the number of study participants was very high, it was possible to perform PCA with a large number of components, namely 72 variables. Even if a large number of variables are used, the PCA alleviates collinearity is-sues between variables (Norman and Streiner, 2008). PCA enables the use of continuous variables, as derived from the FFQ, which reduces misclassification.
While potentially limiting the generalizability offindings to other populations, this approach enabled us to uncover patterns not pre-viously described (Modified Western – Salty and Modified Western – Sweet), and will provide a useful basis when studying the role of diet in this population.
Dietary patterns were derived from a validated FFQ (Pan et al., 2004) with complementary questions focusing on the consumption of fat from meat, skin of poultry, blackened and barbecued meats, con-sumption of coffee, green tea, black tea, beer, wine, and spirits. This comprehensive dietary evaluation contributed to an explained variance of 15.6%, which compares well to that of other studies. While the food frequency questionnaire necessarily entailed some degree of mis-classification, it is a superior method to food records to assess usual food habits (Willet, 1998). Finally, it is likely that some recall errors occurred given that the focus was 2 years before the interview.
In conclusion, our study of French-speaking men in Montreal identified three distinct dietary patterns, labelled as Healthy, Modified Western – Salty, and Modified Western – Sweet. While the former is commonly encountered in Western populations, the two others, high-lighting a preference for salty foods or sweet foods, are novel. These dietary patterns have never been observed together in a study popu-lation. The next step will be to evaluate how these relate to prostate cancer risk in our study population, providing potential leads for pre-vention.
Funding
This work was supported financially through grants from the Canadian Cancer Society (13149,19500,19864,19865,705562), the Cancer Research Society, the Fonds de la recherche du Québec—Santé (FRQS), the FRQS-RRSE, the Ministère du Développement économique, de l'Innovation et de l'Exportation du Québec, and the Canadian Institutes of Health Research (CCP-155423). Marie-Claude Rousseau held a New Investigator Award from the Canadian Institutes of Health Research. Marie-Elise Parent and Marie-Claude Rousseau held career awards from the FRQS. Karine Trudeau holds a doctoral training award from the FRQS.
Acknowledgments
The authors would like to acknowledge the entirefieldwork team at INRS-Institut Armand-Frappier who were involved in the data collec-tion of PROtEuS.
Contributions
KT conducted the analysis, interpreted the results and prepared the manuscript. MEP designed and conducted the PROtEuS study. MEP, MCR and IC contributed to the interpretation of data and to the writing of the manuscript. All authors have read and approved thefinal version of the manuscript.
Competing interests None to declare.
Appendix A. Supplementary data
Supplementary data to this article can be found online athttps:// doi.org/10.1016/j.pmedr.2018.12.017.
References
Alles, B., Samieri, C., Feart, C., Jutand, M.A., Laurin, D., Barberger-Gateau, P., 2012. Dietary patterns: a novel approach to examine the link between nutrition and cog-nitive function in older individuals. Nutr. Res. Rev. 25 (2), 207–222.https://doi.org/ 10.1017/s0954422412000133.
Alles, B., Samieri, C., Lorrain, S., et al., 2016. Nutrient patterns and their food sources in older persons from France and Quebec: dietary and lifestyle characteristics. Nutrients 8 (4), 225.https://doi.org/10.3390/nu8040225.
Ambrosini, G.L., Fritschi, L., de Klerk, N.H., Mackerras, D., Leavy, J., 2008. Dietary patterns identified using factor analysis and prostate cancer risk: a case control study in Western Australia. Ann. Epidemiol. 18 (5), 364–370.https://doi.org/10.1016/j. annepidem.2007.11.010.
Arabshahi, S., Ibiebele, T.I., Hughes, M.C., Lahmann, P.H., Williams, G.M., van der Pols, J.C., 2016. Dietary patterns and weight change: 15-year longitudinal study in Australian adults. Eur. J. Nutr. 56 (4), 1455–1465. https://doi.org/10.1007/s00394-016-1191-3.
Ax, E., Warensjo Lemming, E., Becker, W., et al., 2016. Dietary patterns in Swedish adults; results from a national dietary survey. Br. J. Nutr. 115 (1), 95–104.https://doi.org/ 10.1017/s0007114515004110.
Bai, P.Y., Wittert, G.A., Taylor, A.W., Martin, S.A., Milne, R.W., Shi, Z., 2015. The asso-ciation of socio-demographic status, lifestyle factors and dietary patterns with total urinary phthalates in Australian men. PLoS One 10 (4), e0122140.https://doi.org/ 10.1371/journal.pone.0122140.
Beaudry, M., Galibois, I., Chaumette, P., 1998. Dietary patterns of adults in Quebec and their nutritional adequacy. Can. J. Public Health 89 (5), 347–351.https://doi.org/10. 1007/s12603-014-0562-9.
Benoit, J., 1991. L'encyclopédie de la cuisine de Jehane Benoit. Distribution de livres Mirabel (753 p).
Bherer, C., Labuda, D., Roy-Gagnon, M.H., Houde, L., Tremblay, M., Vézina, H., 2011. Admixed ancestry and stratification of Quebec regional populations. Am. J. Phys. Anthropol. 144 (3), 432–441.https://doi.org/10.1002/ajpa.21424.
Blanc-Lapierre, A., Spence, A., Karakiewicz, P.I., Aprikian, A., Saad, F., Parent, M.E., 2015. Metabolic syndrome and prostate cancer risk in a population-based case-con-trol study in Montreal, Canada. BMC Public Health 15 (1), 913.https://doi.org/10. 1186/s12889-015-2260-x.
Campbell, P.T., Sloan, M., Kreiger, N., 2008. Dietary patterns and risk of incident gastric adenocarcinoma. Am. J. Epidemiol. 167 (3), 295–304.https://doi.org/10.1093/aje/ kwm294.
Carbonneau, E., Bradette-Laplante, M., Lamarche, B., et al., 2018. Social support for healthy eating: development and validation of a questionnaire for the French-Canadian population. Public Health Nutr. 21 (13), 2360–2366.https://doi.org/10. 1017/s1368980018001209.
Chan, J.M., Gong, Z., Holly, E.A., Bracci, P.M., 2013. Dietary patterns and risk of pan-creatic cancer in a large population-based case-control study in the San Francisco Bay Area. Nutr. Cancer 65 (1), 157–164.https://doi.org/10.1080/01635581.2012. 725502.
Charbonneau, H., Desjardins, B., Légaré, J., Denis, H., 2000. A Population History of North America. Cambridge University Press, New York (736 p).
Charreire, H., Kesse-Guyot, E., Bertrais, S., et al., 2011. Associations between dietary patterns, physical activity (leisure-time and occupational) and television viewing in middle-aged French adults. Br. J. Nutr. 105 (6), 902–910.https://doi.org/10.1017/ s000711451000440x.
Gougeon, L., Payette, H., Morais, J., Gaudreau, P., Shatenstein, B., Gray-Donald, K., 2015. Dietary patterns and incidence of depression in a cohort of community-dwelling older Canadians. J. Nutr. Health Aging 19 (4), 431–436. https://doi.org/10.1007/s12603-014-0562-9.
Gu, Y., Scarmeas, N., 2011. Dietary patterns in Alzheimer's disease and cognitive aging. Curr. Alzheimer Res. 8 (5), 510–519.https://doi.org/10.1017/S0954422412000133. Health Canada, 2006. Canadian community health survey, cycle 2.2, nutrition (2004). A
guide to accessing and interpreting the data.http://hc-sc.gc.ca/fn-an/surveill/ nutrition/commun/cchs_guide_escc-eng.php, Accessed date: 20 December 2016. Hodge, A., Bassett, J., 2016. What can we learn from dietary pattern analysis? Public
Health Nutr. 19 (2), 191–194.https://doi.org/10.1017/s1368980015003730.
Hu, F.B., 2002. Dietary pattern analysis: a new direction in nutritional epidemiology. Curr. Opin. Lipidol. 13 (1), 3–9.
Hu, F.B., Rimm, E.B., Stampfer, M.J., Ascherio, A., Spiegelman, D., Willett, W.C., 2000. Prospective study of major dietary patterns and risk of coronary heart disease in men. Am. J. Clin. Nutr. 72 (4), 912–921.
Jacobs Jr., D.R., Gross, M.D., Tapsell, L.C., 2009. Food synergy: an operational concept for understanding nutrition. Am. J. Clin. Nutr. 89 (5), 1543S–1548S.https://doi.org/ 10.3945/ajcn.2009.26736B.
Kaiser, H.F., Rice, J., 1974. Little jiffy, mark IV. Educ. Psychol. Meas. 34 (1), 111–117.
https://doi.org/10.1177/001316447403400115.
Lau, C., Glumer, C., Toft, U., et al., 2008. Identification and reproducibility of dietary patterns in a Danish cohort: the Inter99 study. Br. J. Nutr. 99 (5), 1089–1098.
https://doi.org/10.1017/s0007114507837494.
McNaughton, S.A., Mishra, G.D., Stephen, A.M., Wadsworth, M.E., 2007. Dietary patterns throughout adult life are associated with body mass index, waist circumference,
blood pressure, and red cell folate. J. Nutr. 137 (1), 99–105.
National Health and Welfare, 1977. Food consumption patterns report. (Ottawa, Ont, Canada).
Newby, P.K., Tucker, K.L., 2004. Empirically derived eating patterns using factor or cluster analysis: a review. Nutr. Rev. 62 (5), 177–203.
Norman, G.R., Streiner, D.L., 2008. Biostatistics: The bare essentials, Third edition. B.C. Decker (393 p).
Pan, S.Y., Ugnat, A.M., Mao, Y., Wen, S.W., Johnson, K.C., The Canadian Cancer Registries Epidemiology Research Group, 2004. A case-control study of diet and the risk of ovarian cancer. Cancer Epidemiol. Biomark. Prev. 13 (9), 1521–1527. Paquette, M., Genest, J., Baass, A., 2018. Familial hypercholesterolemia: experience from
the French-Canadian population. Curr. Opin. Lipidol. 29 (2), 59–64.https://doi.org/ 10.1097/mol.0000000000000487.
Perrin, A.E., Dallongeville, J., Ducimetiere, P., et al., 2005. Interactions between tradi-tional regional determinants and socio-economic status on dietary patterns in a sample of French men. Br. J. Nutr. 93 (1), 109–114.https://doi.org/10.1079/ BJN20041280.
Randall, E., Marshall, J.R., Graham, S., Brasure, J., 1990. Patterns in food use and their associations with nutrient intakes. Am. J. Clin. Nutr. 52 (4), 739–745.
Roy-Gagnon, M.H., Moreau, C., Bherer, C., et al., 2011. Genomic and genealogical in-vestigation of the French Canadian founder population structure. Hum. Genet. 129 (5), 521–531.https://doi.org/10.1007/s00439-010-0945-x.
Ruusunen, A., Lehto, S.M., Mursu, J., et al., 2014. Dietary patterns are associated with the prevalence of elevated depressive symptoms and the risk of getting a hospital dis-charge diagnosis of depression in middle-aged or older Finnish men. J. Affect. Disord. 159, 1–6.https://doi.org/10.1016/j.jad.2014.01.020.
Santé Québec, (sous la direction de Lise Bertrand), 1995. Les Québécoises et les Québécois mangent-ils mieux? In: Rapport de l'enquête Québécois sur la nutrition, 1990. Ministère de la Santé et des Services sociaux, Montréal, QC, Canada (297 p).
Schwerin, H.S., Stanton, J.L., Riley Jr., A.M., et al., 1981. Food eating patterns and health: a reexamination of the Ten-State and HANES I surveys. Am. J. Clin. Nutr. 34 (4), 568–580.
Shin, D., Song, S., Krumhar, K., Song, W.O., 2015. Snack patterns are associated with biomarkers of glucose metabolism in US men. Int. J. Food Sci. Nutr. 66 (5), 595–602.
https://doi.org/10.3109/09637486.2015.1064873.
Tremblay, G., 2013. Perceptions des hommes québécois de leurs besoins psychosociaux et de santé.
Tseng, M., Breslow, R.A., DeVellis, R.F., Ziegler, R.G., 2004. Dietary patterns and prostate cancer risk in the National Health and nutrition examination survey epidemiological follow-up study cohort. Cancer Epidemiol. Biomark. Prev. 13 (1), 71–77.https://doi. org/10.1158/1055-9965.EPI-03-0076.
van Dam, R.M., Rimm, E.B., Willett, W.C., Stampfer, M.J., Hu, F.B., 2002. Dietary pat-terns and risk for type 2 diabetes mellitus in U.S. men. Ann. Intern. Med. 136 (3), 201–209.https://doi.org/10.7326/0003-4819-136-3-200202050-00008. Varraso, R., Fung, T.T., Hu, F.B., Willett, W., Camargo, C.A., 2007. Prospective study of
dietary patterns and chronic obstructive pulmonary disease among US men. Thorax 62 (9), 786–791.https://doi.org/10.1136/thx.2006.074534.
Walker, M., Aronson, K.J., King, W., et al., 2005. Dietary patterns and risk of prostate cancer in Ontario, Canada. Int. J. Cancer 116 (4), 592–598.https://doi.org/10.1002/ ijc.21112.
Willet, W., 1998. Nutritional epidemiology, 2nd edition. Oxford University Press, New York.
World Health Organization, 2000. Obesity: preventing and managing the global epi-demic. Report of a WHO consultation. World Health Organ. Tech. Rep. Ser. 894 (i–xii), 1–253.
Wu, K., Hu, F.B., Willett, W.C., Giovannucci, E., 2006. Dietary patterns and risk of prostate cancer in U.S. Men. Cancer Epidemiol. Biomark. Prev. 15 (1), 167–171.
https://doi.org/10.1158/1055-9965.EPI-05-0100.
Xu, M., 2016. Subject response rates in case-control studies of cancer: time trends, study design determinants, and quality of reporting. Université de Montréal, Montréal. Zhou, S., Ambalavanan, A., Rochefort, D., et al., 2016. Rnf213 is associated with
in-tracranial aneurysms in the French-Canadian population. Am. J. Hum. Genet. 99 (5), 1072–1085.https://doi.org/10.1016/j.ajhg.2016.09.001.