HAL Id: hal-00715946
https://hal.archives-ouvertes.fr/hal-00715946
Submitted on 9 Jul 2012
HAL is a multi-disciplinary open access
archive for the deposit and dissemination of
sci-entific research documents, whether they are
pub-lished or not. The documents may come from
teaching and research institutions in France or
abroad, or from public or private research centers.
L’archive ouverte pluridisciplinaire HAL, est
destinée au dépôt et à la diffusion de documents
scientifiques de niveau recherche, publiés ou non,
émanant des établissements d’enseignement et de
recherche français ou étrangers, des laboratoires
publics ou privés.
Discrimination of old document images using their style
Mickaël Coustaty, Jean-Marc Ogier
To cite this version:
Mickaël Coustaty, Jean-Marc Ogier. Discrimination of old document images using their style.
Internation Conference on Document Analysis and Recognition 2011, Sep 2011, Beijing, China. pp.389
-393. �hal-00715946�
Discrimination of old document images using their style
Mickael Coustaty, Jean-Marc Ogier L3i labs
University of La Rochelle La Rochelle, France
Email:{mcoustat,jmogier}@univ-lr.fr
Abstract—Based on the principle described by Pareti et al. in [1], [2], and by Chouaib et al. in [3], this paper proposes to combine the use of the Zipf law and the use of bag of patterns for the implementation of a document indexing processing scheme. Contrarily to these two mentioned approaches, we retain the most important patterns based on the TF-IDF criteria, and the pattern selection is local. This paper presents the different stages of our indexing process, as well as their application to historical documents. Results on comlex images are given, illustrated and discussed.
Keywords-Old documents, Image analysis, Style recognition
I. INTRODUCTION
With the improvement of printing technology since the 15th century, there is a huge amount of printed documents published and distributed. Since that time, many of the books have been falling into decay and have been degraded by the time. This means that the physical objects, i.e. books themselves, are disappearing, but the most important is the corresponding knowledge, which belongs to our cultural heritage. Therefore, there are a lot of attempts to keep, organize and restore ancient printed documents, in order to preserve these documents and their contents. With the improving digital technology, one of the tools contributing to the preservation of these old documents is the digiti-zation. As a consequence, many digitizing process can be observed worldwide in many institutions. However, digitized documents are not sufficient by themselves if one want to have the ability to retrieve, navigate, and extract information from documents, operation which can be performed by using techniques of document analysis and indexing.
The project NaviDoMass challenge to index ancient doc-ument. The global objective of this project is to build a framework to derive benefit from historical documents. As a part of NaviDoMass project, this paper focuses on the graphics part : graphics indexing and CBIR. However, the main interest of this study is based on specific graphics called lettrines and on the recognition of background style in lettrines. This work is inspired by [2] and [3] in which a Zifp law and a TIF IDF criteria were used to compare images.
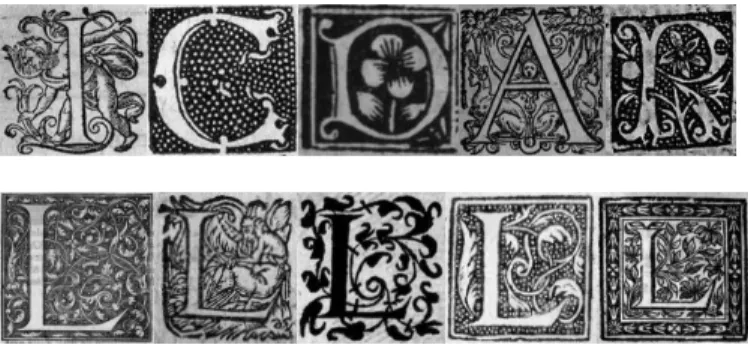
Figure 1. Examples of lettrines and style of lettrines
A. Lettrines in details
Images of documents of the inheritance are heterogeneous and damaged by time. Lettrines (decorative capital letters also named drop caps or drop cap) belong to the images to index, in the context of NAVIDOMASS project. As one can see on figure 1, these images are made up of two principal elements: the letter and the background. An important step in the recognition process of the drop caps consists in recognizing the letter and the style of the background. These elements are used by historians to retrieve similar lettrines, to identify the printer and the period. The letter has already been extracted and recognized in [4], and in this paper we propose a new method to identify the style of the background.
Background of images we are processing in this article can be classified in different classes. The second line of images of the figure 1 present some examples with different backgrounds. Background can be white, black, hashed, or dotted. Moreover, it contains illustrative information and can be considered as decorative (the background only contains ornamental elements) or figurative (the background contains representation of persons or social scene) by historian ex-perts.
B. overview of the proposed approach
Based on the principle described by Pareti et al. in [1], [2], and by Chouaib et al. in [3], this paper proposes to combine the use of the Zipf law and the use of bag of patterns, in order to identify the style of the background. First, a set of 3x3 patterns are extracted from images and ordered using
the TF-IDF criteria. Contrarily to these two first approaches, we retain the most important patterns based on this unique frequency criteria. This selection allows to retain a subset peculiar to each image. Section II-B presents how patterns are extracted from image. Section III-A presents the Zipf law and its use with old document images. Section III presents the proposed approach, and section IV presents results obtained with our approach.
II. PATTERNS EXTRACTION AND COMPARISON
A. Existing approach
Methods used for text understanding tend to extract se-quences of characters that are gathered in words of different lengths. The frequency of these words is thus used to characterize the document. Each document is summarized by the set of most frequent words that composes it. Following this idea, different works proposed to use this to characterize old documents images.
Pareti et al. defined in [1], [2], the principle of words in images. A word corresponds to any possible pattern contained in a mask of size n∗m. An image is thus described by the computation of the frequency of its patterns. From these words, different methods have been proposed in the literature, in order to extract words and compute their fre-quencies. All the proposed methods try to reduce the number of possible patterns: Indeed, images with 256 greylevels, the number of possible patterns, would be 256n∗mfor n ∗ m windows sizes. In the case of patterns of size 3∗3, this would lead to more than 1021different words. This represents a too large dictionary and information related to the frequency of each pattern would be too much dispatched (the frequency of each mask will be near from zero). Existing approaches have then tried to find methods allowing to reduce the size of the dictionary. Dictionary size can be reduced using two ways:
• Reducing the size of the masks: [3] proposed to use patterns as features, but by using patterns the size of which is 2∗3. They obtained a vector of 729 features (ie. 729 patterns possible). For each pattern, they compute their frequency in the image and in the database. The distance between two images consist in computing a cosine similarity between two vector’ images;
• Reducing the number of colours in image: [1], [2] proposed to quantize the number of greylevels in im-ages to three, in order to reduce the dimensionality of the problem. Moreover, they highlight the fact that the graph of pattern’s frequencies follows a Zipf law. This law was approximated using three linear functions. Then, they use features from these linear functions (slopes, junction points) to characterize images. B. Pattern extraction
In our case, drop caps images are graphics, and are fun-damentally binary images. In fact, when observing images
from a perceptual point of view, the images, due to the shading effect by using parallel lines, we can see three levels that can be described as black, grey and white. Thus, in order to retrieve this idea, a quantization was applied on the original image (composed of 256 grelevels) to obtain a new 3 greylevels image. With 3 greylevels and a mask of size 3 ∗ 3, the number of possible patterns is reduced to 39, ie. 19683 patterns.
C. Similarity measurement
Once different patterns have been extracted, each of them is considered as a term in a document. Then the T F − IDF model used in classical textual Information Retrieval meth-ods [5], can be applied in order to compare our documents. The aim of using T F − IDF (Term Frequency - Inverse Document Frequency) is to weight each pattern depending on its frequency in the image on the one hand, and in all the database on the other hand. The T F −IDF allows to find the most relevant patterns that represent an image. Considering the set of all possible patterns in an image I: |P AT TI| and the occurrence number of a pattern k in an image I: |P attk,I|,the Term Frequency of a pattern k in an image I (T FP attk,I) corresponds to:
T FP attk,I =
|P attk,I| |P AT TI|
(1)
In other words, this corresponds to the number of instances of a pattern comparatively to the number of patterns in the image.
In addition, IDF (Inverse Document Frequency) mea-sures how infrequent a pattern is in the database. This value is estimated using the whole collection of images. From a set of |I| images in the database (the jthimage of the database is denoted ij), the IDF of a pattern P attkis thus computed as follows:
IDFP attk= log
|I| |{ij : P atti ∈ ij}|
(2)
From these two values, we can compute the T F − IDFi,j of a pattern i in an image j as:
T F − IDFk,l= T Fk,l∗ IDFk (3) Each pattern is thus weighted according to its use in an image, and in all the database. Each pattern can be seen as a ”word” that compose a dictionary.
III. PROPOSED APPROACH
A. Zipf Law and images
Texts are always referring to a dictionary. In fact all the possible sequences of character do not have a real meaning but only a rather small number of them is really significant for characterizing a document. The number of words is the dimension of the text representation space. As mentioned earlier, the dictionary is composed of 19.683 terms, which is big to describe properly an image, and to compute easily and quickly a distance between images. In order to tackle this problem, we thus plotted the Zipf graph of pattern frequencies, and obtained a Zipf law.
B. Zipf law
Zipf’s law [6] is an empirical law formulated fifty years ago, which relies on a power law. The law states that in a phenomena described by a set of topologically organized symbols, the distribution of the occurrence numbers of n-tuples named patterns is organized in such a way that the frequencies of the patterns M1, M2...Mn, denoted N1, N2...Nn, are related to the rank of these symbols when sorted with respect to their frequency occurrence. The fol-lowing relation holds:
Nσ(i) = k ∗ ia
Nσ(i) represents the occurrence number of the σth pattern with rank i, and k and a are constants. This power law is characterized by the value of the exponent a; k is more closely linked to the length of the symbol sequence studied. C. Zipf law and TF-IDF
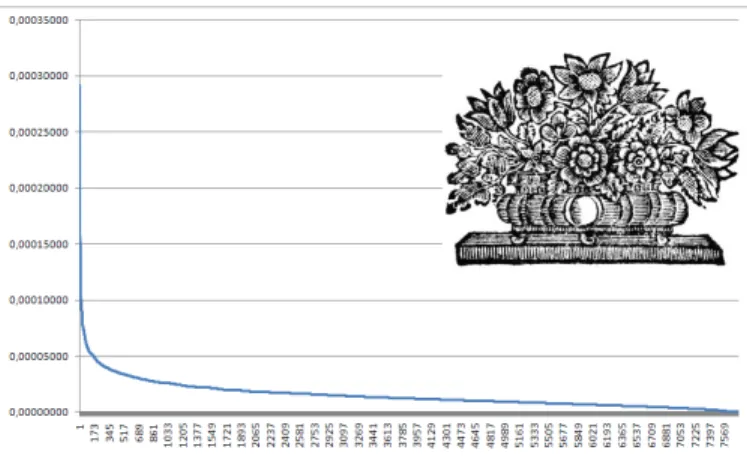
Below, the graph given in figure 2, is a Zipf graph. The X-Axis correspond to the list of patterns which could be found in an image, while Y-Axis correspond to the TF-IDF value of each pattern. Patterns have been sorted in descending order.
Figure 2. Example of tf-idf graph obtained on an old document graphical image
A close examination of the curves shows they are not linear but similar to a decreasing exponential. The left-hand
portion of the graph is concerned with the regions in the image with high value of TF-IDF. A pattern with a high value of TF-IDF correspond to a pattern that is frequent in the image, and that is not existing in all the images of the database. In other words, patterns that belong to the left-hand portion appear frequently in the image, and are peculiar to this style of image. Since extracted patterns have a small size comparatively to the image one, patterns can not be used to describe images in details. However, these patterns give an overview of the context of the image. As a consequence, we can use them as global document features and thus describes styles of image.
D. From Zipf law to Image description
Starting from this assertion, we decided to only keep patterns the TF-IDF of which is in this left-hand portion. To do this, we retain patterns the T F − IDF of which is higher than t% of the max value of T F − IDF for each image, t being computed on the basis of a training procedure applied a significant sets of images. In our case, we found that an optimal value of t was 0.20 (20%). An image is then described by a vector or pattern with their T F − IDF values.
The main advantage of this selection relies on the fact that we do not select the most interesting patterns for all the database, but the most interesting set of patterns for each image. The result of this selection gives a subset of patterns (with theirs values) for each image. Thus, each image is characterized by a variable sized vector corresponding to the T F − IDF of selected patterns. In order to compare two images, we need to measure the similarity between two vectors of different size and patterns.
E. Image similarity measurement
Each image is described by a vector that contains the list of most interesting patterns for this image. This selection involves different sizes of vector, and different features in vectors. We thus defined a similarity measure between im-ages (ie. vectors) to compare imim-ages. This measure between two vectors (v1 and v2) tries to integrate different aspects which are embedded in each T F − IDF vector, in order to finely characterize the similarity between images. This measure relies on a series of three values.
1) Length Ratio: In order to integrate the similarity between vectors, we first calculate a feature based on the lenght ratio between two vectors. This ratio RL is equal to:
RL=
min(Lv1,Lv2) max(Lv1,Lv2)
with Lv1 and Lv2 which correspond to the respective
lengths of each vector to be compared. The assumption behind this ratio is that two images that have vectors of different length are dissimilars;
2) Similarity Ratio: the second measure indicates how many patterns which can be found in the first vector,
are present in the second one. With P att1, P att2the set of patterns of each image, the similarity ratio RS is computed as follow:
RS= |Pi
:Pi∈P att1∩Pi∈P att2|
max(Lv1,Lv2)
The ratio indicates if two vectors contain the same patterns, ie. if images are composed of the same patterns;
3) Pattern Distance: finally, in order to obtain a more precise comparison between images with same terns, we add an euclidean distance between the pat-terns that appears in both vectors. With P att12the set of patterns that are common to P att1 and P att2 and LP att12 the number of common patterns, the distance
correspond to: DP att=P
LP att12 i=1
√
(T F IDFP att1(i)−T F IDFP att2(i))2
LP att12
The distance is then normalized by dividing it by the maximum value of T F − IDF found in all the database.
The two first ratios indicate the similarity between two vectors. RL and RS have a value ∈ [0; 1], with 0 corre-sponding to dissimilar vectors, while 1 indicates a perfect similarity between them. On the other hand, the pattern distance correspond to an euclidean distance. This means that the smaller the distance is, the closer the vectors are (and vice-versa).
We thus combine these three values into a global similar-ity measure. Considering two images i1and i2, the measure is defined as:
Simi1,i2 = (1 − (RL∗ RS)) ∗ DP att)
Starting from this similarity measure, some experiments have been implemented in order to evaluate its performances. They are presented in the next section.
IV. EXPERIMENTS
Each image is described using the T F − IDF frequency of patterns that compose it. Using the similarity criteria defined above, some experiments have been implemented in order to evaluate the suitability of the proposed approach. A. Lettrines database
Firstly, we evaluated the method using a database of lettrines1. This database, used in [1], [2], contains more than 300 images coming from the Centre d’Etudes Sup´erieur de la Renaissanceof Tours, France. Images from this database have been labelled by experts who indicated the ”style” of the lettrine. The three main styles are presented in figure 3 We used 10 images by style (ie. class) in the learning step (' 13% of all database images), and the rest for the recognition step. For all images, the distance between the image and all the others of the database are computed. We then used a k-nearest neighbour (k − N N ) classifier 1A lettrine is an ornamental letter that start a paragraph or a chapter in
books from the Renaissance
Style 1 Style 2 Style 3 Other style
Figure 3. Examples of lettrines for each style present in the database used in [1], [2]. Style 1 correspond to lettrines composed of hashed background, style 2 contains lettrines with white and decorative background, style 3 lettrine with a black background with white dot, and last style contains all lettrines that do not belong to the three first styless
to find most similar images. Results are presented in table I, and compared to those obtained in [2]. Results obtained correspond to the recognition rate. For k = 1, we calculated the number of well recognized images. For k = 3 and k = 5, we applied a majority voting process from a weighted k − N N [7], and selected the class to assign to an image. Results show that the proposed approach gives good results, and show its ability to surpass already existing methods, especially on classes with lower recognition rates (comparatively to those presented in [2].
K Method Style 1 Style 2 Style 3 1 [2] 92% 70% 84% Proposed approach 98.2% 100% 95.3% 3 [2] 100% 94% 91% Proposed approach 98.2% 100% 97.6% 5 [2] 100% 100% 97% Proposed approach 100% 100% 100% Table I
COMPARISON BETWEEN THE METHOD PRESENTED IN[2]AND THE PROPOSED METHOD. WE CAN SEE THAT RECOGNITION HAVE BEEN INCREASED IN ALL THE STYLES OF LETTRINES,AND PARTICULARLY
FOR THE STYLES WITH LOW RECOGNITION RATES.
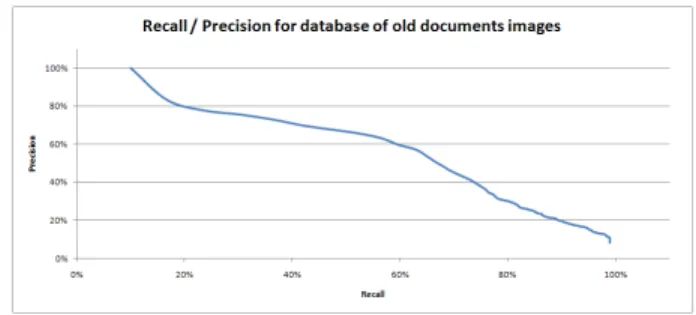
Figure 4. Recall-Precision graph of lettrines’ style
to globally characterize the style of old documents images. We also calculated the Recall-Precision graph obtained using this current dataset. This graph can be observed in figure 4. We can notice that the proposed approach is able to recall 80% of the results with a good precision, and thus could be used in an indexing problem of old documents.
B. Old documents images
In order to extend the experiments, and to prove that our results can be applied to a more general case, we performed a second series of experiments. This second series were applied on a database of 100 images of 9 classes. Some examples of the classes are presented in figure 5.
Figure 5. Examples of old documents images from the nine classes used in the second series of experiments
As for the first series of experiments, we used a k − N N classifier and we applied a majority voting process from a weighted k − N N for k > 1. We obtained the recognition rates presented in table II.
K Recognition rate 1 62% 3 83,3% 5 85,6% Table II
RECOGNITION RATES OF IMAGES PROVIDING FROM A DATABASE OF OLD DOCUMENTS IMAGES.
We present the recall-precision curve obtained on this database in the graph in figure 6. As one can see, the first elements returned by the system are very significant. Moreover, if we chose to return a set of thirty images to the final user, we can see that the system is able to get a precision higher than 75% (ie. there are less than 7 wrong images among 30).
V. CONCLUSION
This paper proposes to combine the use of the Zipf law and the use of bag of patterns for the implementation of a document indexing processing scheme. Contrarily to the approaches described by Pareti et al. in [1], [2], and by
Figure 6. Recall-Precision graph obtained on the database of old documents images
Chouaib et al. in [3], we retain the most important patterns based on the TF-IDF criteria, and the pattern selection is local. We thus obtained a subset of patterns peculiar to each image. We validated our approach on two databases of old documents. The first experiment shows that our approach gives better results than those obtained in the literature. Finally, the second database highlights the fact that our approach gives encouraging results to characterize the type of complex old documents.
ACKNOWLEDGMENT
This work is supported by the French National Re-search Agency project NAVIDOMASS, and referenced un-der ANR-06-MCDA-012. For more details and ressources, visit http://navidomass.uni-lr.fr.
We wish to thank Damien Saunier for his contribution to this work.
REFERENCES
[1] R. Pareti and N. Vincent, “Global discrimination of graphic styles,” in GREC, ser. Lecture Notes in Computer Science, W. Liu and J. Llad´os, Eds., vol. 3926. Springer, 2005, pp. 120–130.
[2] ——, “Ancient initial letters indexing,” in 18th International Conference on Pattern Recognition. Hong Kong, China: IEEE Computer Society, 2006, pp. 756–759.
[3] H. Chouaib, F. Cloppet, and N. Vincent, “Graphical drop caps indexing,” in Graphics Recognition. Achievements, Challenges, and Evolution, ser. LNCS.
[4] M. Coustaty, R. Pareti, N. Vincent, and J.-M. Ogier, “Towards historical document indexing: extraction of drop cap letters,” International Journal on Document Analysis and Recognition, pp. 1–12, 2011.
[5] K. S. Jones, “Experiments in relevance weighting of search terms,” Information Processing & Management, vol. 15, no. 3, pp. 133 – 144, 1979.
[6] G. Zipf, Human Behavior and the Principle of Least Effort. Hafner Pub. Co, 1949.
[7] K. Hechenbichler and K. Schliep, “Weighted k-nearest-neighbor techniques and ordinal classification,” 2004. [Online]. Available: http://epub.ub.uni-muenchen.de/1769/
![Figure 3. Examples of lettrines for each style present in the database used in [1], [2]](https://thumb-eu.123doks.com/thumbv2/123doknet/14500971.527810/5.918.489.821.107.270/figure-examples-lettrines-style-present-database-used.webp)