R
ESEARCHA
RTICLE/ A
RTICLE DE RECHERCHEPerception of climate change and farm level adaptation choices
in central Kenya
Kinfe Asayehegn
1,2,3,*, Ludovic Temple
2, Berta Sanchez
3and Ana Iglesias
31
SupAgro Montpellier, 2, place Pierre-Viala, 34060 Montpellier cedex 1, France
2
Cirad, UMR Innovation, 73, avenue Jean-François Breton, 34398 Montpellier, France
3
Department of Agricultural Economics and Social Sciences, Universidad Politecnica de Madrid, Avenida de la Complutense SN, 28040 Madrid, Spain
Abstract – Farmers are experiencing the need to adapt to climate change, and are developing different strategies. This article contributes to the understanding of farmers’ adaptation choices, their determinants and their implications, in relation to the household income. In 2014, Focus Group Discussions (FGDs) and 220 household surveys were carried out with farmers in coffee and food crop zones in Central Kenya. The Heckman model was used to evaluate the determinants of adaptation choices and their marginal effect. Farmers from the coffee zone or from the food crop zone perceive and adapt differently to climate change. Farmers who are aware of changes in climate are more willing to explore adaptation strategies. A positive relationship is found between adaptation to climate change and household income. The highest payoff/return is achieved if multiple adaptation choices are used rather than a single strategy. The choices of strategies are also determined by household characteristics, resource endowment, institutional variables, and climate information. The strong correlation between socio-institutional variables and adaptation capacity suggests the need for the establishment and strengthening of local institutions, such as micro-finance and extension.
Keywords: climate change adaptation / coffee / farmers / Kenya
Résumé – Perception des changements climatiques et choix d’adaptation des agriculteurs du Kenya central.Les agriculteurs doivent s’adapter au changement climatique et développent pour cela différentes
stratégies. Cet article contribue à la compréhension des choix d’adaptation des agriculteurs, de leurs déterminants et implications, en lien avec le revenu des ménages. Des groupes de discussion et des enquêtes ont été menés en 2014 auprès de 220 producteurs de zones caféières et de zones de cultures vivrières dans le centre du Kenya. Le modèle d’Heckman a été utilisé pour évaluer les déterminants des choix d’adaptation et leurs effets marginaux. Les producteurs de la zone caféière et de la zone de cultures vivrières perçoivent et s’adaptent différemment au changement climatique. Les agriculteurs qui sont conscients du changement climatique sont plus disposés à explorer différentes stratégies d’adaptation. Une corrélation positive est identifiée entre l’adaptation au changement climatique et l’augmentation du revenu des ménages. Des choix d’adaptation multiples sont plus payants que le choix d’uneseulestratégie.Lesstratégiesd’adaptationsontaussidéterminées par les caractéristiques des ménages, les dotations en ressources, les variables institutionnelles et l’information relative au climat. La forte corrélation entre les variables socio-institutionnelles et les capacités d’adaptation suggère le besoin de renforcer les institutions locales de microfinance et de conseil technique.
Mots clés : adaptations aux changements climatiques / café / agriculteur / Kenya
1 Introduction
One of the most widespread anthropogenic challenges affecting agricultural production is climate change and climate variability (Torquebiau, 2016). An adjustment to the actual or
expected changes has to be, therefore, among priorities in policy decisions. Farmers’ behavioural change towards adaptation and willingness to take action are as important as are policy decisions (García de Jalón et al., 2013; Banna et al., 2016).
The need for adaptation to ensure food security, particularly in Africa, is highly justified and supported at the political and policy levels (Lobell et al., 2008; Yegbemey et al., 2014). These policy level adaptation needs are
* Corresponding author:[email protected],
DOI:10.1051/cagri/2017007
Les agricultures face au changement climatique. Coordonnateur : Emmanuel Torquebiau
Disponible en ligne :
insufficiently supported by local level farmers’ choices (Souza et al., 2015). The difficulty in understanding farmers’ choices of adaptation holds back the development of concrete measures. That is why the success of various policy proposals has been limited, reflecting a difficulty in linking policy studies to real local farmers’ contexts, needs and capacities (García de Jalón et al., 2013).
Studies concerning farmers’ adaptation choices and determinants of choices are insufficient, unlike analysis of public perception (García de Jalón et al., 2013; Merot et al., 2014). Two points are noted in this regard:
– there are many micro studies on attitudes of African farmers faced with climate change (Maddison, 2007; Patt and Schroter, 2008; Mertz et al., 2009; Fosu-Mensah et al., 2012; Silvestri et al., 2012);
– large surveys have also addressed farmers’ perceptions towards climate (Maddison, 2007; Nhemachena and Hassan, 2008), and ethnography has outlined how limiting factors relate to adaptation choices at a conceptual level (Angeon and Caron, 2009; Souza et al., 2015), where representation of local context is one of the limitations. This study, therefore, bridges the massive surveys and the ethnographic approaches, examining the relations between perception and adaptation, in order to explore the reasons behind the farmers’ choices. Even in a local context, perception and adaptation to climate change vary across production systems due to differences in opportunities and determinants. In rainfed crops production, adaptation for instance comprises practices such as adopting drought-resistant varieties (Teucher et al., 2016), or intercropping of different crops (Lobell et al., 2008), while changing breeds, and alternative feeding strategies (Seo, 2010) are common in the livestock sector. This paper addresses three questions:
– Are adaptation choices similar among farmers of the coffee and food crop zones?
– What determines the adoption of adaptation choices to climate change in the coffee and food crop zones? – What are the implications of the adoption of different
adaptation choices to household income? This research is framed in a context, where:
– economic and climate pressures are already major issues and all climate scenarios project further temperature increase (Silvestri et al., 2012);
– policy actors are starting to look for micro studies on farmers’ action (World Bank, 2016);
– affected farmers contribute to almost 65% of the local economy, and 50% of principal export earnings (Republic of Kenya, 2015).
2 The Murang
’a case study in Central Kenya
The study was conducted in Murang’a County, Central Kenya, an area with diversified physical environments and climatic extremes (World Bank, 2016). National coffee production has been on an increasing trend for a long time; it increased from 43 778 tonnes in 1963–1964 to 140 000 tonnes in 1987–1988 (Thuku, 2013). After 1988, however, coffee production has declined and stagnated at about 50 000 tonnes,
and its world market share has dropped from 3.2% in 1987 to 0.6% in 2006 (Thuku, 2013).
Environmental dynamics and climate change were the factors for the steady decline of production (Davis et al., 2012). Arabica coffee grows at an average temperature between 18°C and 21°C and at an annual rainfall of 1500–3000 mm (Lin, 2007). However, rainfall tends to reduce while hot periods become more common. As a result, coffee plants tend to dry, while pests and diseases emerge (Lin, 2007). Because of these constraints, two zones exist in the area, dedicated to coffee and food crops, respectively. The two zones differ in altitude (the food crop zone is situated below 1450 meters above sea level [masl], while the coffee zone ranges between 1450 and 1800 masl), type of production systems (coffee is the dominant crop in terms of cultivated land area and share of income in the coffee zone, while food crops are dominant in the food crop zone), and climate (the coffee zone is comparatively cooler and has higher annual rainfall).
The food crop zone is characterized by semiarid climatic conditions with a high potential for droughts. Rainfall is erratic, uncertain and unevenly distributed into two seasons. However, both seasons are characterized by a short to very short growing period. Simulations predict that yields of main crops are on a decreasing trend. Future climate projections show that the agroecological situation will get worse and substantiate the introduction of drought-resistant crop varieties (Lobell et al., 2008).
3 Methods
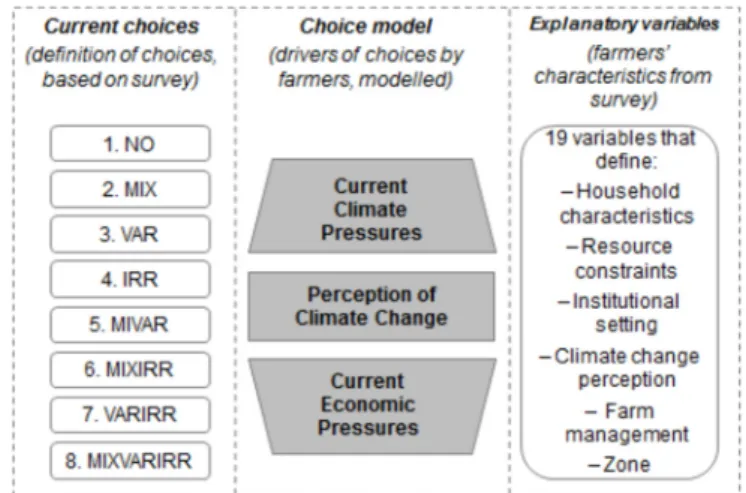
3.1 Framework and rationale for model development Wefirst identified and characterised the major adaptation choices by analysing changes by household members, including investments in livestock management, crop-live-stock mix, tree planting, new crop varieties, changes in planting dates, irrigation, and soil and water conservation during the last three decades. We compared the implementa-tion of adaptaimplementa-tion strategies within and across the two zones. Based on their importance to the farming community as best options to adapt to climate change and a high rate of adoption, we chose three adaptations: crop-livestock diversification (MIX), changing crop varieties (VAR), and irrigation supplementation (IRR), and their combinations, for further analysis (Fig. 1andTab. 1).
The choices are categorised into eight categories (Tab. 1) with no adoption of choices at all (NO) as a base category, and seven other elements. The choice of strategies depends on the effects of current climate trends and climatic variability, the effects of current economic pressures on the farm, and the farmers’ perception of climate change. Data on farmers’ choices are derived from the consultation process (focus groups and a survey). These choices are affected by a large set of explanatory variables (19) (Tab. 2).
3.2 Data collection 3.2.1 Sample
Primary data were collected using Focus Group Dis-cussions (FGDs) and a household survey. The household survey was conducted via face to face meetings during
June–October 2014 with a total sample of 220 farm house-holds equally divided into farmers from the coffee zone (110) and farmers from the food crop zone (110). Then, we classified farmers by villages, age groups and gender. Finally, we took samples randomly. Prior to the household survey, eight FGDs were conducted, with about twelve farmers per group. Discussions with two groups for each of the following areas were conducted: coffee-tea intersection of the upper highland, potential coffee area, marginal coffee area, and complete food crop area of the lower altitude.
3.2.2 Questionnaire
The survey was composed of 36 questions, including check-all and forced-choice questions, followed by a comprehensive discussion. We formulated eight groups of questions. First, the percentage of farmers having access to climate information from both scientific and indigenous knowledge was calculated. Scientific knowledge of climate change comes from the meteorological offices, scientific conferences and consultations, manuals and leaflets, while indigenous knowledge comes from knowledgeable traditional people. Second, three questions were used to measure the scale of farmers’ perception and concern of climate change (one question evaluated the understanding of climate in general, and two questions were specific to rainfall and temperature). Farmers who responded ‘yes’ to the general question on ‘increased/decreased temperature and rainfall’ were consid-ered as perceiving changes. Third, a scale to measure the adoption of the selected adaptation actions, consisting of 13 questions, was developed. Fourth, the gender was formulated as a binary option with value ‘1’ for male and ‘0’ for female; age and education of the head and family size were also asked. Fifth, household resource endowment, i.e. total farm size, farm and off-farm income, livestock owned, and distance to market was also registered; farm income consisted of all incomes from farming for the year 2013–2014. Sixth, the households’ access to institutions (i.e. access to credit and extension) was valued‘1’ or ‘0’. Seventh, farmers’ use of inputs was registered as a‘yes’ or ‘no’ response, and,
finally, the agroecological zone was considered as ‘1’ for coffee zone and‘0’ for food crop zone.
3.2.3 Choice model
In the area of climate change adaptation, farmers may be unable to adopt their most preferred strategies due to different determinants affecting their adaptive capacity, including inadequate climate information (Deressa et al., 2009), partial understanding of climate impacts and low level of awareness about benefits of adaptation (Iglesias et al., 2011), perception and concern towards future change (Maddison, 2007), disconnection between climate science and policy, insufficient institutional infrastructure, such as access to credit and extension services (Yegbemey et al., 2014; Bryan et al., 2009). Empirical studies, such as those byAbid et al. (2015)and
Bryan et al. (2013), used a binary logistic regression to measure adoption choices by classifying the dependent variables into a binary option as adopted or not adopted choices. Farmers, however, differ in choice of strategy adoption (some adopt single choice, while others adopt multiple choices). Applying binary logistic regression is, therefore, inappropriate to evaluate whether adoption of a combination of adaptation choices is better than the adoption of single choices. On another way,Yegbemey et al. (2014)and
Deressa et al. (2009)used Heckman model to analyse climate change perception and determinants of adaptation.
The choice of adaptation strategies in this study is, therefore, modelled as a choice between alternatives:‘adopted choices’ (at least one of the options of MIX, VAR, IRR, MIXVAR, MIXIRR, VARIRR, or MIXVARIRR) and ‘no strategy’ represented as ‘NO’ (Fig. 1 andTab. 1). We used Heckman two stage estimation to analyse the determinants and the marginal effect. Previous studies claim that higher level of education, increasing in farm size, farm income and household size increase the probability of choice of adaptation strategies such as tree planting, crop-livestock diversification and variety change (Abid et al., 2015). Input use, such as manure and compost, negatively correlate with household adaptation choices, such as cropping system diversification and improved variety change (Teklewold et al., 2013). Constraints in farm credit, extension services, lack of access to land and information about climate change, are negatively correlated to adaptation (Bryan et al., 2009). Based on a review of literature from similar empirical studies, 35 explanatory variables were selected. But for our specific study area, 19 explanatory variables were considered important (Tab. 2).
4 Results
4.1 Farming systems
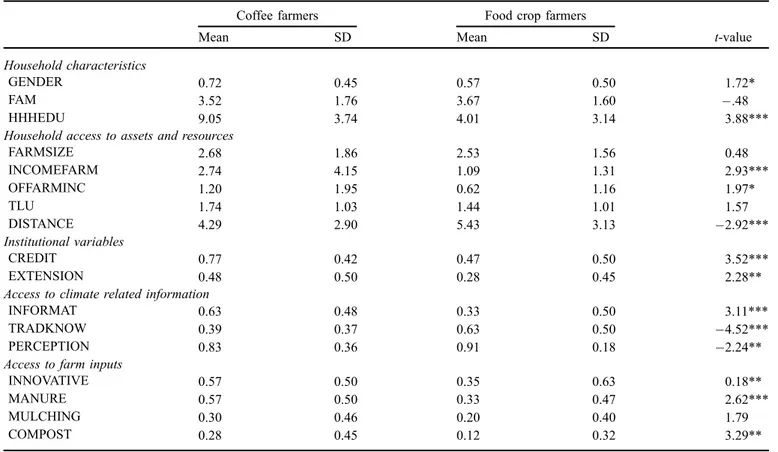
Results (Tab. 3) show that 72% of farmers from the coffee zone and 57% from the food crop zone are male-headed households. This may relate to the significant number of farmers from the food crop zone who used off-farm employment and temporary migration for casual work. Household heads in the coffee zone had a three years higher education level than farmers from the food crop zone. Farmers from the coffee zone had higher farm and off-farm incomes, compared to farmers from the food crop zone. Farmers from
Fig. 1. Proposed framework for analysing farmers’ adoption of innovation strategies.
Fig. 1. Cadre proposé pour l’analyse de l’adoption par les agriculteurs de stratégies d’innovation.
the coffee zone had better institutional services such as credit and extension. This may depend on the access, farmers’ information and attitude towards the services. The results show that the number of farmers from the coffee zone who had access and use of information exceeded that of farmers from the food crop zone by 30%.
In total, 87% of the farmers perceived the overall climate to have changed, while 84% and 76% respectively perceived that the rainfall had declined and that temperature had increased
during the last 30 years. The analysis of coffee and food crop zones revealed that farmers from the food crop zone have a better understanding that climate has changed. This might be in relation with perceived impacts of the changes. Farmers from the food crop zone explained that crops failure due to erratic rainfall and heat stress was frequent. The number of farmers who used manure and compost to improve their production and productivity was higher in the coffee zone than in the food crop zone (Tab. 3).
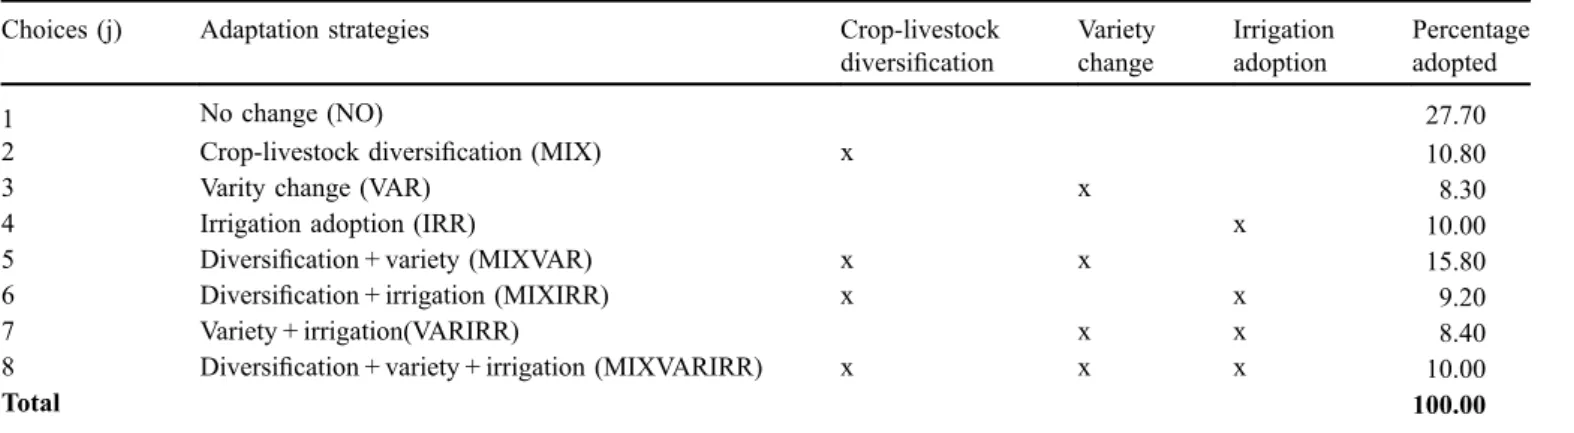
Table 1. Percentage distribution of sample farmers across the selected choices.
Tableau 1. Répartition en pourcentage des éleveurs de l’échantillon selon les stratégies choisies. Choices (j) Adaptation strategies Crop-livestock
diversification Variety change Irrigation adoption Percentage adopted 1 No change (NO) 27.70
2 Crop-livestock diversification (MIX) x 10.80
3 Varity change (VAR) x 8.30
4 Irrigation adoption (IRR) x 10.00
5 Diversification + variety (MIXVAR) x x 15.80 6 Diversification + irrigation (MIXIRR) x x 9.20
7 Variety + irrigation(VARIRR) x x 8.40
8 Diversification + variety + irrigation (MIXVARIRR) x x x 10.00
Total 100.00
The binary triplet represents the possible strategy combinations. Total number of observations (n = 220).
Table 2. Description of explanatory variables used in the model.
Tableau 2. Description des variables explicatives utilisées dans le modèle.
Variables Description and unit of measurement Mean Household characteristics
GENDER Binary, 1 if the head is male and 0 if female 0.64 FAM Continuous, family size of the household in adult equivalent 3.58 HHHEDU Continuous, education of the household head in number of years 6.47 Resource constraint
FARMSIZE Continuous, farm size holding of the household in acres 2.60 INCOMFARM Continuous, farm income of the household in‘000’ USD 1.91 OFFARMINC Continuous, off-farm income of the household in‘000’ USD 0.91 TLU Continuous, total livestock ownership in TLU 1.59 DISTANCE Continuous, distance to market in KMs 4.86 Institutional settings
CREDIT Binary, 1 if access to credit and 0 otherwise 0.62 EXTENSION Binary, 1 if access to extension and 0 otherwise 0.38 Information and perception
INFORMAT Binary, 1 if head has access to information and 0 otherwise 0.48 TRADKNOW Binary, 1 if head has indigenous knowledge of forecasting and 0 otherwise 0.52 PERCEPTION Binary, 1 if head perceives climate change and 0 otherwise 0.87 Access and use of farm inputs
INNOVATIVE Binary, 1 if household head experienced new farm inputs and 0 otherwise 0.46 MANURE Binary, 1 if prepares and uses manure and 0 otherwise 0.45 MULCHING Binary, 1 if practices mulching and 0 otherwise 0.25 COMPOST Binary, 1 if prepares and uses compost and 0 otherwise 0.20 Agro-ecological zone
COFFEE Binary, 1 if the zone is coffee and 0 otherwise 0.50 FOODCROP Binary, 1 if the zone is food crop and 0 otherwise 0.50
4.2 Farmers’ choices
4.2.1 Crop management choices
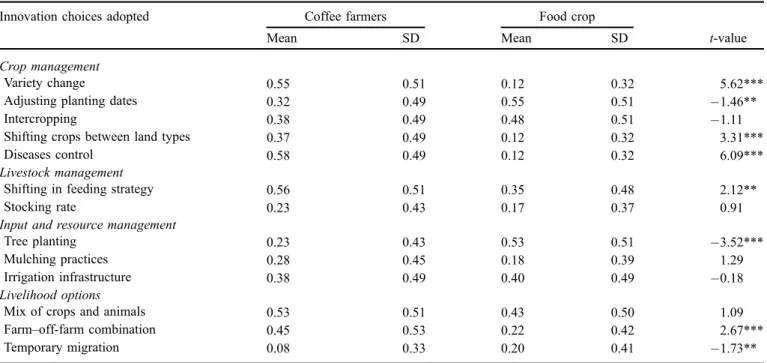
Farmers from both the coffee zone and the food crop zone had access to different crop varieties (local or commercial). Rainfall period in the food crop zone lasted usually less than three months. Thus, farmers of the food crop zone were forced to use short maturity varieties of annual crops such as maize, but they were able to adjust planting and harvesting times in response to the onset and offset of rainfall. Farmers from the coffee zone were able to change varieties of annual crops such as maize, depending on their expectations of rainfall duration. A positive significant relationship between farmers from the coffee zone and shifting crops (Tab. 4) indicates that farmers from the coffee zone had better access to rainfall forecast. Farmers with such access keep changing their annual crops depending on the rainfall expectations. For farmers with similar farm profiles and who are limited to other options, intercropping could be the option for adapting to the stresses. Therefore, farmers in the food crop zone were found to intercrop maize with beans.
4.2.2 Livestock management choices
Farmers shift from one type of feed to another, based on availability, and reduce herds to a manageable size (Tab. 4). 56% of farmers in the coffee zone and 35% in the food crop
zone practice shifting feeds. Optionally, livestock feed is available at an affordable price at veterinary service shops, and farmers use it in shortage periods. Due to small herd size, only a small fraction of coffee zone farmers (23%) and food crop zone farmers (17%) reduce the stocking of cattle (Tab. 4). 4.2.3 Livelihood options
Enterprise diversification (e.g., crop-livestock diversifica-tion and combinadiversifica-tion of farm with non-farm activities) were other strategies used by many farmers to minimise risks and improve income. Combined farm and off-farm activities were mainly undertaken by farmers from the coffee zone, while temporary or permanent migration were means of livelihood for a significant number of farmers from the food crop zone (Tab. 4). 4.3 Effect of perceptions
In the coffee zone, a significant difference was found in choices adoption, between farmers who perceived climate change and farmers who did not perceive any change, while in the food crop zone, no significant difference was found between farmers who perceived climate change and farmers who did not perceive any change (Tab. 5). Farmers who perceived climate change adopted more choices compared to those who did not perceive it. However, this is not an exclusive
Table 3. Defining coffee zone and food crop zone farmers of the study area.
Tableau 3. Description des producteurs de la zone de culture caféière et de la zone de cultures vivrières dans la zone d’étude. Coffee farmers Food crop farmers
Mean SD Mean SD t-value
Household characteristics
GENDER 0.72 0.45 0.57 0.50 1.72*
FAM 3.52 1.76 3.67 1.60 .48
HHHEDU 9.05 3.74 4.01 3.14 3.88***
Household access to assets and resources
FARMSIZE 2.68 1.86 2.53 1.56 0.48 INCOMEFARM 2.74 4.15 1.09 1.31 2.93*** OFFARMINC 1.20 1.95 0.62 1.16 1.97* TLU 1.74 1.03 1.44 1.01 1.57 DISTANCE 4.29 2.90 5.43 3.13 2.92*** Institutional variables CREDIT 0.77 0.42 0.47 0.50 3.52*** EXTENSION 0.48 0.50 0.28 0.45 2.28**
Access to climate related information
INFORMAT 0.63 0.48 0.33 0.50 3.11***
TRADKNOW 0.39 0.37 0.63 0.50 4.52***
PERCEPTION 0.83 0.36 0.91 0.18 2.24**
Access to farm inputs
INNOVATIVE 0.57 0.50 0.35 0.63 0.18**
MANURE 0.57 0.50 0.33 0.47 2.62***
MULCHING 0.30 0.46 0.20 0.40 1.79
COMPOST 0.28 0.45 0.12 0.32 3.29**
Number of observations (n = 220). *, ** and *** indicate statistical significance at 10%, 5% and 1% level respectively. Survey data, 2014.
conclusion. Farmers from the coffee zone who perceived climate changes in the long term, essentially changed the varieties depending on the expectation of the rainfall durations, adjusted planting and harvesting time fitting them with the onset and offset of rainfall, and looked for alternative income sources such as mixed farming of crops and livestock (Tab. 5).
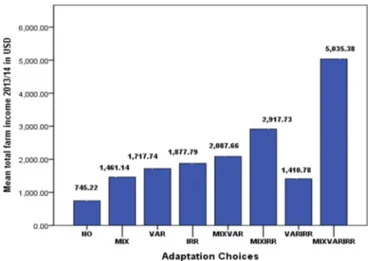
4.4 Implications of the choices on household income Farmers’ adaptation choices could have two purposes: expecting profit or avoiding risk. Adopters of any adaptation strategy in this study were found to have a higher income than the non-adopters, in all cases. Non-adopters of adaptation strategies had a lower annual income, compared to adopters of a strategy (about 665 US Dollars [USD] less than the strategy with a minimum return of 1,410.78 USD from a combined adoption of improved varieties and irrigation [VARIRR]) (Fig. 2). The comparison between single choice adoptions also reveals that irrigation adoption is related to a higher income, followed by varietal change and mixed crop-livestock diversification. Farmers adopting the three choices of crop-livestock diversification, variety change, and irrigation (MIXVARIRR) had a better income than single strategy adopters. Their annual income was 3,574 and 3,157 USD higher than those of crop-livestock and irrigation adopters, respectively (Fig. 2). Although the choice of combined or separate strategies always had significant and positive relations with household income, the adoption of a combination of packages benefited farmers more than the adoption of a single strategy. Similar results are reported byTeklewold et al. (2013)
in Ethiopia.
4.5 Determinants of adaptation choices
The results of the Heckman model are presented inTable 6
and 7. Households with a higher family size were likely to choose irrigation strategies (IRR), or variety change and irrigation (VARIRR). This could be in relation with labour availability as most of the choices were labour intensive. Better educated farmers were more likely to choose crop-livestock diversification, variety change and irrigation (MIXVARIRR) in combination, while a unit increase in education level of the household head increased the probability of choosing crop-livestock diversification, variety change and irrigation (MIXVARIRR) by 1.9%. This could be related to the awareness of profitability, risk aversion and knowledge and skill in managing mixed farming.
Farm income was related to the choice of every package. The adoption of the choices of crop-livestock diversification (MIX), variety change (VAR), irrigation (IRR), variety change and irrigation (VARIRR), and crop-livestock diver-sification, variety change and irrigation (MIXVARIRR) were found to have positive correlation with increasing household total annual farm income. The choice of a combination of adaptation strategies was higher for farmers with better income through developing the capacity to breakdown the capital constraint to invest in new technologies. Being a coffee farmer led to choosing variety change (VAR) and crop-livestock diversification and variety change (MIXVAR) with a probability of 43%, and 34%, respectively. However, an opposite sign and similar magnitude was observed being a food crop farmer (Tabs. 6and7). This may be related to the duration of rainfall of the two zones. In the coffee zone, duration of rainfall is higher, which enables farmers to
Table 4. Current choices of coffee zone and food crop zone farmers in the study area.
Tableau 4. Choix actuels des producteurs de la zone caféière et de la zone de cultures vivrières dans la zone d’étude. Innovation choices adopted Coffee farmers Food crop
Mean SD Mean SD t-value
Crop management
Variety change 0.55 0.51 0.12 0.32 5.62*** Adjusting planting dates 0.32 0.49 0.55 0.51 1.46**
Intercropping 0.38 0.49 0.48 0.51 1.11
Shifting crops between land types 0.37 0.49 0.12 0.32 3.31*** Diseases control 0.58 0.49 0.12 0.32 6.09*** Livestock management
Shifting in feeding strategy 0.56 0.51 0.35 0.48 2.12**
Stocking rate 0.23 0.43 0.17 0.37 0.91
Input and resource management
Tree planting 0.23 0.43 0.53 0.51 3.52***
Mulching practices 0.28 0.45 0.18 0.39 1.29 Irrigation infrastructure 0.38 0.49 0.40 0.49 0.18 Livelihood options
Mix of crops and animals 0.53 0.51 0.43 0.50 1.09 Farm–off-farm combination 0.45 0.53 0.22 0.42 2.67*** Temporary migration 0.08 0.33 0.20 0.41 1.73** Number of observations (n = 159). *, ** and *** indicate statistical significance at 10%, 5% and 1% level respectively.
Table 5. Current choices of adaptation and farmers ’ perception of climate change in the study area. Tableau 5. Choix actuels d’ adaptation et per ception des changements climatiques par les agriculteurs dans la zone d’ étude. Current choices Cof fee farmers Food crops farmers All farmers Change perceived Change not perceived Change perceived Change not perceived Change perceived Change not perceived Mean SD Mean SD t-value Mean SD Mean SD t-value Mean SD Mean SD t-value Cr op management V ariety change 0.62 0.49 0.13 0.33 2.71*** 0.10 0.31 0.50 0.71 1.73* 0.35 0.48 0.20 0.41 1.12* Adjusting planting dates 0.48 0.51 0.00 0.00 2.67** 0.55 0.50 0.50 0.71 0.14 0.52 0.50 0.10 0.30 6.42*** Intercropping 0.35 0.48 0.63 0.52 1.52 0.48 0.50 0.50 0.71 0.05 0.42 0.50 0.55 0.52 0.78 Shifting crops 0.42 0.50 0.00 0.00 2.38** 0.12 0.33 0.00 0.00 0.52 0.27 0.44 0.00 0.00 3.98** Diseases control 0.67 0.47 0.00 0.00 3.99*** 0.12 0.33 0.00 0.00 0.52 0.39 0.49 0.00 0.00 2.46*** Livestock management Shifting in feeding 0.46 0.50 0.38 0.52 0.45 0.34 0.48 0.50 0.71 0.45 0.40 0.50 0.40 0.51 0.00 Stocking rate 0.27 0.50 0.00 0.00 1.69* 0.17 0.38 0.00 0.00 0.64 0.22 0.42 0.00 0.00 1.75* Access input and resour ces management T ree planting 0.25 0.44 0.13 0.33 0.67 0.55 0.50 0.00 0.00 1.54 0.41 0.49 0.09 0.30 1.94* Mulching 0.29 0.46 0.25 0.46 0.22 0.17 0.38 0.50 0.71 1.17 0.23 0.42 0.27 0.47 0.52 Irrigation 0.40 0.50 0.25 0.46 0.03 0.40 0.49 0.50 0.71 0.29 0.59 0.49 0.16 0.50 2.19** Livelihood options Mixed crop and livestock 0.58 0.50 0.25 0.46 1.71* 0.43 0.50 0.50 0.71 0.79 0.50 0.50 0.27 0.47 3.47** Farm –of f-farm combination 0.46 0.54 0.38 0.52 0.43 0.21 0.41 0.50 0.71 0.98 0.33 0.49 0.36 0.50 0.21 T emporary migration 0.08 0.33 0.13 0.33 0.38 0.19 0.39 0.50 0.71 1.07 0.14 0.37 0.18 0.41 0.37
change their maize varieties depending on different reasons such as productivity and tolerance to disease and drought. In the food crop zone, on the other hand, duration of rainfall is always short, and farmers are forced to use short maturity crop varieties.
An increase of one acre of land ownership of the household was linked with a probability of choosing crop-livestock diversification and irrigation (MIXIRR) at 3%. Smallholder farmers were likely to invest in irrigation strategy and to change their variety, to compensate the small size of their farm by intensification, whereas large holder farmers tended to rely on crop-livestock diversification and irrigation (MIXIRR), due to the requirement of space for the animals and irrigated crops’ production. Institutional varia-bles (access to credit and extension services) had a positive impact on the adoption of choices, such as crop-livestock diversification (MIX) and crop-livestock diversification and variety change (MIXVAR). This is similar to previous results (Yegbemey et al., 2014). Farmers perceiving that the climate is either changing positively or not at all were linked to the crop-livestock diversification option (MIX) at a probability level of 14%. Innovative farmers were likely to adopt variety change (VAR) and crop-livestock diversification and variety change (MIXVAR), at probability levels of 10% and 17%, respectively.
5 Discussion and conclusions
The results of this study have some limitations. The adaptation strategies were limited to on-farm choices. However, in the context of climate change, other strategies, such as new infrastructure, subsidies, or voluntary market solutions are likely to determine the adaptation process.
Despite these limitations, the results provide information for local policy decisions. Farmers from the coffee zone who perceive that the climate is changing adopt more choices than farmers who perceive no change, while in the food crop
zone, there is no significant difference among farmers, whether they perceive changes or not. Perceptions may be in relation with current pressures and impacts, while adaptation requires elements beyond perception, such as education, information, assets and resources, institutions, and infra-structures. Macro studies, such as the Intergovernmental Panel on Climate Change (IPCC) fifth assessment, domi-nantly emphasize on adaptation and mitigation interactions, basically on regional levels (IPCC, 2014). Micro studies, so far, are limited to the conclusion that only farmers who perceive climate change respond to the changes by considering a series of adaptation strategies (Maddison, 2007; Deressa, 2008; Bryan et al., 2009; Abid et al., 2015). However, farmers adopt adaptation strategies in response to other causes, such as economic and social pressures.
Farmers responded differently to the changing climate depending on the area (coffee or food crop zone). There is no adequate literature, so far, which compares adaptation choices between farmers with different means of livelihood strategies such as coffee, food crop, dairy farming or off-farm activities. Studies from Central America and Mexico (Tucker et al., 2010), for instance, claim different adaptation choices for farmers from coffee zones, and other studies such as
Bryan et al. (2013), Nhemachena and Hassan (2008), describe adaptation choices to climate change also pertinent to farmers from food crop zones. Though these studies were conducted separately, at different locations, researches on coffee and food crop areas showed similar results. Choice of crop types, improved farm inputs, diseases control, crop-livestock diversification were mostly used by farmers from the coffee zone, while adaptation choices such as tree planting, irrigation, intercropping, adjusting planting dates in response to rainfall onset and offset, and permanent or temporary migration were mostly adopted by farmers from food crop zones.
Our results on the likelihood of choices of adaptation confirm the results from previous studies. Family size was found to determine adoption choices such as irrigation, which is similar to the results of Deressa et al. (2009)and
Abid et al. (2015); while education of the household head is positively correlated with crop-livestock diversification, variety change and irrigation (MIXVARIRR). Household farm income determines positively all choices of adaptation. Similar studies, such as Deressa et al. (2009), show that farm income positively affects the choice of irrigation and variety.
Access to credit was associated with crop-livestock diversification (MIX), variety change (VAR), and crop-livestock diversification and variety change (MIXVAR). Similar studies, such asTeklewold et al. (2013)andYegbemey et al. (2014) find a similar result. In our study, a significant
portion of the farmers who did not perceive any change was found to be using some adaptation strategies. This could be due to economic factors, such as income or other drivers, and disproves that farmers adopt adaptation choices if, and only if, they perceive changes. The strong correlation between the socio-institutional variables and the choice of adaptation strategies suggests the need for the establishment and strengthening of local institutions, such as micro-finance and extension institutions.
Fig. 2. Relation between adaptation choices and household farm income (USD).
Fig. 2. Relation entre choix d’adaptation et revenu agricole des ménages (USD).
Table 6. Parameter estimates of the determinants of adaptation choices. Tableau 6. Estimations des paramètres des déterminants des choix d’adaptation.
Variables MIX VAR IRR MIXVAR MIXIRR VARIRR MIXVARIRR Coef. Coef. Coef. Coef. Coef. Coef. Coef. GENDER 0.18 2.14 0.86 1.01 1.33 1.18 28.94 FAM 0.61 0.30 0.34** 0.20 0.37 0.56* 0.64 HHHEDU 0.01 0.01 0.15 0.05 0.05 0.15 0.71* FARMSIZE 0.41 0.24 0.24 0.08 0.53* 0.68* 0.04 INCOMEFARM 3.1e 0.00** 0.00*** 0.00** 0.00** 0.00** 0.00*** OFFARMINC 0.00 5.2e- 6.1e 2.5e- 7.7e** 2.2e- 3.4e***
TLU 0.56 0.29 0.80 0.24 0.11 0.36 1.07 DISTANCE 0.49* 0.10 0.58** 0.41 20.22 0.05 0.41 CREDIT 3.24** 0.27** 1.59 2.40** 0.61 1.17 21.09 EXTENSION 3.57* 1.04 1.60 1.87* 0.03 2.18 3.72** INFORMAT 0.18 0.80 1.91 0.33* 1.15 3.63*** 3.33 TRADKNOW 1.35 1.31 0.64 1.19 15.87 0.56 0.17 PERCEPTION 3.11* 1.06 1.05 3.39** 0.01 1.27 5.72 INNOVATIVE 1.37 4.65** 15.80 4.25** 3.21 2.92 1.33 MANURE 1.51 0.85 1.12 0.11 1.26 3.09* 2.93 MULCHING 0.09 0.33 2.14 0.15 0.07 2.93** 1.34 COMPOST 2.43 2.52** 4.01* 2.31* 1.87 1.80 5.03 COFFEE (Base Food crop) 0.57 2.97** 0.24* 23.31*** 0.23 1.48 0.34 FOODCROP (Base Coffee) 0.57 2.97** 0.24* 23.31*** 0.24 1.48 0.34 CONSTANT 1.36 6.04** 9.82*** 1.51*** 29.46 0.37 75.38 Coef = Coefficient, base category = NO; number of observations (n = 220); log likelihood = 131.62; LR x2
= 212.27; prob.x2= 0.0000; pseudo R2= 0.4464. *, **, *** indicate statistical significance at 10%, 5% and 1% level respectively.
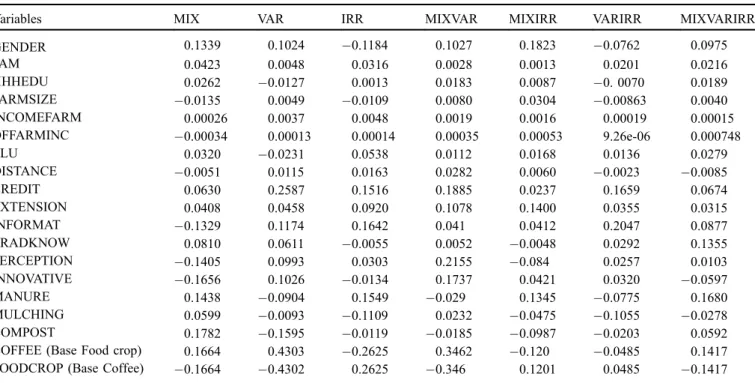
Table 7. Marginal effect from the Heckman model of farm level adaptation measures.
Tableau 7. Effet marginal du modèle Heckman des mesures d’adaptation au niveau des exploitations agricoles.
Variables MIX VAR IRR MIXVAR MIXIRR VARIRR MIXVARIRR GENDER 0.1339 0.1024 0.1184 0.1027 0.1823 0.0762 0.0975 FAM 0.0423 0.0048 0.0316 0.0028 0.0013 0.0201 0.0216 HHHEDU 0.0262 0.0127 0.0013 0.0183 0.0087 0. 0070 0.0189 FARMSIZE 0.0135 0.0049 0.0109 0.0080 0.0304 0.00863 0.0040 INCOMEFARM 0.00026 0.0037 0.0048 0.0019 0.0016 0.00019 0.00015 OFFARMINC 0.00034 0.00013 0.00014 0.00035 0.00053 9.26e-06 0.000748 TLU 0.0320 0.0231 0.0538 0.0112 0.0168 0.0136 0.0279 DISTANCE 0.0051 0.0115 0.0163 0.0282 0.0060 0.0023 0.0085 CREDIT 0.0630 0.2587 0.1516 0.1885 0.0237 0.1659 0.0674 EXTENSION 0.0408 0.0458 0.0920 0.1078 0.1400 0.0355 0.0315 INFORMAT 0.1329 0.1174 0.1642 0.041 0.0412 0.2047 0.0877 TRADKNOW 0.0810 0.0611 0.0055 0.0052 0.0048 0.0292 0.1355 PERCEPTION 0.1405 0.0993 0.0303 0.2155 0.084 0.0257 0.0103 INNOVATIVE 0.1656 0.1026 0.0134 0.1737 0.0421 0.0320 0.0597 MANURE 0.1438 0.0904 0.1549 0.029 0.1345 0.0775 0.1680 MULCHING 0.0599 0.0093 0.1109 0.0232 0.0475 0.1055 0.0278 COMPOST 0.1782 0.1595 0.0119 0.0185 0.0987 0.0203 0.0592 COFFEE (Base Food crop) 0.1664 0.4303 0.2625 0.3462 0.120 0.0485 0.1417 FOODCROP (Base Coffee) 0.1664 0.4302 0.2625 0.346 0.1201 0.0485 0.1417 Base category = NO; number of observations (n = 220). *, ** and *** indicate statistical significance at 10%, 5% and 1% level respectively. Survey data, 2014.
References
Abid M, Scheffran J, Schneider UA, Ashfaq M. 2015. Farmers’ perceptions of and adaptation strategies to climate change: the case of Punjab province, Pakistan. Earth System Dynamics 6: 225–243. Angeon V, Caron A. 2009. Quel rôle joue la proximité dans
l’émergence et la pérennité de modes de gestion durable des ressources naturelles ? Natures Sciences Sociétés 17: 361–372. Disponible sur http://www.cairn.info/revue-natures-sciences-soci etes-2009-4-page-361.htm.
Banna H, Afroz R, Mehedi Masud M, Sohel Rana M, Koh EH, Ahmad R. 2016. Financing an efficient adaptation programme to climate change: a contingent valuation method tested in Malaysia. Cahiers Agricultures 25: 2–8
Bryan E, Deressa T, Gbetibouo GA, Ringler C. 2009. Adaptation to climate change in Ethiopia and South Africa: options and constraints. Environmental Science and Policy 12: 413–426. Bryan E, Ringler C, Okoba B, Roncoli C, Silvestri S, Herrero M.
2013. Adapting agriculture to climate change in Kenya: household strategies and determinants. Journal of Environmental Manage-ment 114: 26–35.
Davis AP, Gole TW, Baena S, Moat J. 2012. The impact of climate change on indigenous arabica coffee (Coffea arabica): predicting future trends and identifying priorities. PLoS ONE 7: 10–14. Deressa T. 2008. Analysis of perception and adaptation to climate
change in the Nile Basin of Ethiopia. Pretoria: Centre for Environmental Economics and Policy for Africa (CEEPA), University of Pretoria.
Deressa T, Hassan RM, Ringler C, Alemu T, Yesuf M. 2009. Determinants of farmers’ choice of adaptation methods to climate change in the Nile Basin of Ethiopia. In: Working paper number 19. Washington DC: The World Bank.
Fosu-Mensah PL, Vlek G, MacCarthey DS. 2012. Farmers’ perception and adaptation to climate change: a case study of Sekyedumase district in Ghana. Environment, Development and Sustainability 14: 495–505.
García de Jalón S, Iglesias A, Quiroga S, Bardají I. 2013. Exploring public support for climate change adaptation policies in the Mediterranean region: a case study in Southern Spain. Environ-mental Science & Policy 29: 1–11.
Iglesias A, Mougou R, Moneo M, Quiroga S. 2011. Towards adaptation of agriculture to climate change in the Mediterranean. Regional Environmental Change 11: 159–166.
IPCC. 2014. Summary for policy makers in climate change 2014. Impacts, adaptation and vulnerability: contribution of working group II to the fifth assessment report. United Kingdom: Cambridge University Press.
Lin BB. 2007. Agroforestry adaptation and mitigation options for smallholder farmers vulnerable to climate change. Agroecology, ecosystems and sustainability. 1st ed. New York: Taylor and Francis Group.
Lobell DB, Burke MB, Tebaldi C, Mastrandrea MD, Falcon WP, Naylor RL. 2008. Prioritizing climate change adaptation needs for food security in 2030. Science 319: 607–610.
Maddison D. 2007. The perception of and adaptation to climate change in Africa. In: Policy Research Working Paper 4308. Washington DC: The World Bank.
Merot P, Corgne S, Delahaye D, Desnos P, Dubreuil V, Gascuel C, et al. 2014. Évaluation, impacts et perceptions du changement climatique dans le Grand Ouest de la France métropolitaine le projet CLIMASTER. Cahiers Agricultures 23: 96–107.
Mertz O, Mbow C, Reenberg A. 2009. Farmers’ perceptions of climate change and agricultural adaptation strategies in rural Sahel. Environmental Management 43: 804–816.
Nhemachena C, Hassan R. 2008. Determinants of African farmers’ adapting to climate change: multinomial choice analysis. AfJARE 2: 83–104.
Patt AG, Schroter D. 2008. Perceptions of climate risk in Mozambique: implications for the success of adaptation strategies. Global Environmental Change 18: 458–467.
Republic of Kenya. 2015. Kenya’s intended nationally determined contribution. Presented at the COOP 21 adaptation and mitigation to climate change, Kenya.
Seo SN. 2010. Is an integrated farm more resilient against climate change? A micro-econometric analysis of portfolio diversification in African agriculture. Food Policy 35(1): 32–40.
Silvestri S, Bryan E, Ringler C, Herrero M, Okoba B. 2012. Climate change perception and adaptation of agro-pastoral communities in Kenya. Regional Environmental Change 12: 791–802.
Souza KD, Kituyi E, Harvey B, Leone M, Subrammanyam K, Ford JD. 2015. Vulnerability to climate change in three hot spots in Africa and Asia: key issues for policy-relevant adaptation and resilience building research. Regional Environmental Change 15: 747–753.
Teklewold H, Kassie M, Shiferaw B, Köhlin G. 2013. Cropping system diversification, conservation tillage and seed adoption in Ethiopia: impacts on household income, agrochemical use and demand for labor. Ecological Economics 93: 85–93.
Teucher M, Hornetz B, Jatzold R. 2016. Increasing livelihood through use of adapted crop varieties; case study from a semiarid region of East Kenya. Agroecology and Sustainable Food Systems 40(6): 614–632.
Thuku GK. 2013. Effects of reforms on productivity of coffee in Kenya. International Journal of Business and Social Science 4: 196–213.
Torquebiau E. ed. 2016. Climate change and agriculture worldwide. Heidelberg: Springer, 373 p. Available from http://doi.org/ 10.1007/978-94-017-7462-8.
Tucker CM, Eakin H, Castellanos EJ. 2010. Perceptions of risk and adaptation: coffee producers, market shocks, and extreme weather in Central America and Mexico. Global Environmental Change 20: 23–32
World Bank. 2016. Climate information services, agriculture global practical assistance paper. Washington DC: The World Bank. Yegbemey RN, Jacob AY, Ghislain BA, Armand P. 2014.
Modélisation simultanée de la perception et de l’adaptation au changement climatique : cas des producteurs de maïs du Nord Bénin. Cahiers Agricultures 23: 177–187.
Cite this article as: Asayehegn K, Temple L, Sanchez B, Iglesias A. 2017. Perception of climate change and farm level adaptation choices in central Kenya. Cah. Agric. 26: 25003.