A C CLIMATE APPLICATIONS”
«AGACC»
M. De Mazière, H. De Backer, M. Carleer, E. Mahieu, K. Clémer, B. Dils, M. Kruglanski, F. Hendrick, C. Hermans, M. Van Roozendael, C. Vigouroux, A. Cheymol, V. De Bock,
A. Mangold, R. Van Malderen, P.-F. Coheur, S. Fally, J. Vander Auwera, J.-L. Lacour, P. Demoulin, P. Duchatelet
Atmosphere and Climate
(SSD)
FINAL REPORT
ADVANCED EXPLOITATION OF GROUND-BASED
MEASUREMENTS FOR ATMOSPHERIC CHEMISTRY AND CLIMATE APPLICATIONS
«AGACC»
SD/AT/01
Promotors
Martine De Mazière (BIRA-IASB) Hugo De Backer (KMI-IRM)
Michel Carleer (ULB) Emmanuel Mahieu (ULg)
Authors
Martine De Mazière, Katrijn Clémer, Bart Dils, Michel Kruglanski, François Hendrick, Christian Hermans, Michel Van Roozendael,
Corinne Vigouroux (BIRA-IASB)
Hugo De Backer, Anne Cheymol, Veerle De Bock, Alexander Mangold, Roeland Van Malderen
(KMI-IRM)
Michel Carleer, Pierre-François Coheur, Jean-Lionel Lacour, Sophie Fally, Jean Vander Auwera
(ULB)
Emmanuel Mahieu, Pierre Duchatelet, Philippe Demoulin
(ULg)
Editorial support
D/2011/1191/21
Published in 2011 by the Belgian Science Policy Louizalaan 231 Avenue Louise 231 B-1050 Brussels Belgium Tel: +32 (0)2 238 34 11 – Fax: +32 (0)2 230 59 12 http://www.belspo.be
Contact person: Martine Vanderstraeten +32 (0)2 238 36 10
Neither the Belgian Science Policy nor any person acting on behalf of the Belgian Science Policy is responsible for the use which might be made of the following information. The authors are responsible for the content.
No part of this publication may be reproduced, stored in a retrieval system, or transmitted in any form or by any means, electronic, mechanical, photocopying, recording, or otherwise, without indicating the reference:
Martine De Mazière, Hugo De Backer, Michel Carleer, Emmanuel Mahieu, Katrijn Clémer, Bart Dils, Michel Kruglanski, François Hendrick, Christian Hermans, Michel Van Roozendael, Corinne Vigouroux, Anne Cheymol, Alexander Mangold, Roeland Van Malderen, Pierre-François Coheur, Sophie Fally, Jean Vander Auwera, Jean-Lionel Lacour, Pierre Duchatelet, Philippe Demoulin. Advanced exploitation of Ground-based measurements for Atmospheric Chemistry and Climate applications “AGACC”. Final Report. Brussels : Belgian Science Policy 2009 – 123 p. (Research Programme Science for a Sustainable Development)
TABLE OF CONTENT
SUMMARY ... 5
I INTRODUCTION ... 11
I.1 Focus on chemistry-climate interactions: rationale ... 11
I.2 Objectives ... 11
II METHODOLOGY AND RESULTS ... 13
II.1 Field observations... 13
II.1.1 Water Vapour ... 13
II.1.1.1 Rationale ... 13
II.1.1.2 Exploitation of radiosondes measurements at Ukkel ... 14
II.1.1.3 Retrieval of water vapour from Fourier Transform Infrared observations ... 18
II.1.1.3.1 At Ukkel ... 18
II.1.1.3.2 At Jungfraujoch ... 19
II.1.1.3.3 At Reunion Island ... 22
II.1.1.4 Comparisons of IWV measurements from FTIR, radiosoundings, CIMEL and GPS at Ukkel ... 27
II.1.1.5 Major conclusions ... 29
II.1.2 Aerosol detection and properties ... 29
II.1.2.1 Rationale ... 29
II.1.2.2 CIMEL sunphotometer measurements of aerosol ... 30
II.1.2.3 MAXDOAS measurements of aerosol ... 31
II.1.2.3.1 The measurements ... 32
II.1.2.3.2 Semi-blind intercomparison of NO2 and O4 columns during CINDI ... 33
II.1.2.3.3 Retrieval of aerosol extinction profiles ... 35
II.1.2.3.4 Auxiliary results: Retrieval of trace gas vertical profiles ... 38
II.1.2.4 Comparison of aerosol measurements ... 38
II.1.2.4.1 Comparison of the MAXDOAS AOD data with CIMEL and Brewer data, at Ukkel and Beijing ... 38
II.1.2.4.2 Comparison of the MAXDOAS profile extinction data with Lidar and in-situ data during CINDI ... 40
II.1.2.4.3 Comparisons between the CIMEL and Brewer spectrometer at Ukkel ... 43
II.1.2.5 Brewer AOD and UV index prediction ... 44
II.1.2.5.1 AOD variability in Uccle ... 44
II.1.2.6 Major conclusions ... 48
II.1.3 Detection of other climate-related trace species ... 49
II.1.3.1 Rationale ... 49
II.1.3.2 Hydrogen cyanide (HCN) ... 50
II.1.3.2.1 Introduction ... 50
II.1.3.2.2 HCN above Jungfraujoch ... 50
II.1.3.2.3 HCN above Ile de la Réunion ... 53
II.1.3.3.2 HCHO at Ukkel ... 55
II.1.3.3.3 HCHO at Jungfraujoch ... 59
II.1.3.3.4 HCHO at Ile de la Réunion ... 61
II.1.3.4 Methane (CH4) and its isotopologues ... 69
II.1.3.4.1 Introduction ... 69
II.1.3.4.2 Retrieval of 12CH 4 and 13CH4 above Jungfraujoch ... 70
II.1.3.4.3 CH3D at Jungfraujoch ... 74
II.1.3.4.4 CH3D at Ile de la Réunion ... 75
II.1.3.5 Carbon monoxide (CO) and its isotopologues ... 76
II.1.3.5.1 Introduction ... 76
II.1.3.5.2 Retrieval of 12CO and 13CO at Jungfraujoch... 76
II.1.3.6 Ethylene ... 77
II.1.3.7 Acetylene ... 79
II.1.3.7.1 Introduction ... 79
II.1.3.7.2 Observations of acetylene at the Jungfraujoch... 79
II.1.3.7.3 Observations of acetylene at Ile de la Réunion ... 81
II.1.3.8 HCFC-142b ... 82
II.1.3.8.1 Introduction ... 82
II.1.3.8.2 HCFC-142b observations at the Jungfraujoch ... 82
II.1.3.9 Major conclusions ... 84
II.2 Supporting Laboratory data ... 86
II.2.1 Rationale ... 86
II.2.2 H2O and its isotopologues ... 86
II.2.3 Other molecules and their isotopologues ... 88
II.2.3.1 Acetylene ... 88
II.2.3.2 Ethylene ... 88
II.2.3.3 Formic acid ... 89
II.2.3.4 Carbon monoxide istopologues ... 89
II.2.4 Major conclusions ... 90
III POLICY SUPPORT ... 91
IV DISSEMINATION AND VALORISATION ... 93
V PUBLICATIONS ...107
VI ACKNOWLEDGEMENTS ...115
VII REFERENCES ...117
VIII LIST OF ACRONYMS ...123 Error! Bookmark not defined.
SUMMARY
We live in an era in which human activities are causing significant changes to the atmospheric environment which result in local to global consequences on the ecosystems. Changes in the atmospheric composition impact our climate via chemical and dynamical feedback mechanisms; in many instances they also affect air quality, and the health of the biosphere. Monitoring and understanding those changes and their consequences is fundamental to establish adequate actions for adaptation to and mitigation of the environmental changes. Furthermore, after implementation of regulatory measures like the Montreal Protocol, it is necessary to verify whether the measures are effective. This can only be achieved if we have adequate detection methods and a reliable long record of a series of key geophysical parameters.
Thus the AGACC project contributes to the provision of basic new knowledge regarding the atmospheric composition and its changes, based on advanced ground-based monitoring, in combination with satellite and numerical modelling data. Its results are integrated in ongoing international research programmes.
The general objective of AGACC has been to improve and extend the ground-based detection capabilities for a number of climate-related target species and, ground-based hereupon, analyse past and present observations to derive new information about the atmospheric composition, its variability and long-term changes. Despite the advent of a growing and more performant fleet of Earth Observation satellites, ground-based observations are still indispensable to (1) guarantee long-term continuity, homogeneity and high quality of the data, and (2) to underpin the satellite data for calibration and (long-term) validation.
A first target gas is atmospheric water vapour. It is the key trace gas controlling
weather and climate. It is also the most important greenhouse gas in the Earth’s atmosphere. Its amount and vertical distribution are changing, but how and why? Especially in the upper troposphere - lower stratosphere, the radiative effects of changes in the water vapour are significant and should be quantified. The measurement of water vapour is a hot topic since several years. It is a challenge, because water vapour exhibits a large gradient in its concentration when going from the ground to the stratosphere, and because it is highly variable in time and space. For example, we have found that the time scale of the variations of the total water vapour amount at Jungfraujoch is in the order of minutes.
In AGACC, we have therefore investigated various experimental techniques to measure the concentration of water vapour in the atmosphere, focusing on the total column as well as on the vertical distribution in the troposphere up to the lower stratosphere. The retrieval of water vapour vertical profiles and total columns from ground-based FTIR
verification are available, namely Ukkel (± sea level, mid-latitude), Ile de La Réunion (± sea level, tropical) and Jungfraujoch (high altitude, mid-latitude), with promising results. In particular, at Jungfraujoch, it has been demonstrated that the precision of the FTIR integrated water vapour (IWV) measurements is of order 2%. The capability to retrieve individual isotopologues of water vapour, and to monitor their daily and diurnal variations, has also been demonstrated. This could open new ways to study in the future the role of water vapour in the radiative balance, the global circulation, precipitation etc. We also started joint exploitation of ground-based FTIR and satellite IASI data for water vapour and its isotopologues, in order to exploit fully the potential of the existing instrumentation.
A correction method for the radiosoundings at Ukkel has been successfully implemented, resulting in a homogeneous and reliable time series from 1990 to 2008 from which trends in upper troposphere humidity (UTH) and tropopause characteristics have been derived. One observes a rising UTH until September 2001, followed by a decline, accompanied by a descent and heating of the tropopause up to the turning point and an ascent and cooling afterwards. The changes after September 2001 in the upper troposphere can be explained by surface heating and convective uplift. At Jungfraujoch, one does not observe any significant trend in the total water vapour abundance above the station over the 1988-2010 time period, although significant positive summer and negative winter trends have been detected.
We have made a quantitative statistical comparison between ground-based FTIR, CIMEL, GPS and integrated (corrected) radio sounding measurements of the IWV at Ukkel. This work is important to better characterize the different sensors in order to exploit together different observations made by different instruments.
A second target species is atmospheric aerosol. There is a very large variety of
aerosol both from natural or anthropogenic origin. One of the reasons why they are so important is that they affect the optical properties of the atmosphere. In particular, it has been demonstrated in previous studies that the aerosols have a large impact on the quantity of harmful UV-B radiation received at the Earth’s surface. The latest IPCC Report also stressed that the radiative forcing caused by atmospheric aerosols is one of the largest uncertainties in determining the total radiative forcing in the atmosphere. Better monitoring capabilities of aerosol properties can therefore improve our understanding and forecasting of the atmospheric processes and evolution, and in particular of UV-B and climate changes.
Several measurement techniques are now operational in the AGACC consortium for the ground-based monitoring of aerosol properties. These are the Brewer spectrometer and CIMEL observations at Ukkel, the latter contributing also to the AERONET network since July 2006, and the newly developed MAXDOAS observations. Unlike CIMEL and Brewer measurements, that provide the total Aerosol Optical Depth, it has been
demonstrated that the MAXDOAS measurements also provide additional information about the vertical distribution of the aerosol extinction in the lowest kilometres of the troposphere. A better understanding of the ultimate capabilities of MAXDOAS aerosol remote sensing has been gained through participation to the international CINDI campaign (Cabauw Intercomparison Campaign of Nitrogen Dioxide measuring Instruments ) in summer 2009. The combination of Brewer, CIMEL and MAXDOAS instruments gives us a remote-sensing dataset that will enable a more comprehensive characterization of the tropospheric aerosol optical properties. The usefulness of these aerosol observations has already been demonstrated in the improvement of the UV-index predictions for the general public. Another application is their use as input data in the retrieval of vertical profiles of tropospheric pollutants from MAXDOAS measurements, like tropospheric NO2 andformaldehyde.
Third we have focused on a few climate-related trace gases. Changing
greenhouse gas and aerosol concentrations directly affect the radiative budget of the atmosphere, and therefore climate. But many species known as pollutants like carbon monoxide (CO), nitrogen oxides (NOx) and hydrocarbons, - often related to fossil fuel or biomass burning -, also affect climate through their role in chemical reactions that produce tropospheric ozone, which is a well-known greenhouse gas, or that modify the lifetime of gases like methane, or the oxidation capacity of the atmosphere.
Therefore in AGACC, we have focused on the measurement of a number of trace gases that are subject to changing concentrations, that directly or indirectly affect climate, and that are either difficult to monitor or that have not yet been measured from the ground. We have included attempts to observe distinctly some isotopologues, because the isotopic ratios observed in an airmass provide information on its history, and because the FTIR solar absorption measurements provide a rather unique capability hereto. The investigated species are the isotopologues of CH4 and CO, and hydrogen cyanide
(HCN), as examples of biomass burning tracers, some hydrocarbons like formaldehyde (HCHO), ethylene (C2H4) and acetylene (C2H2), and HCFC-142b, a replacement product
for CFCs and a greenhouse gas.
In many cases, retrieval strategies had to be adapted when going from one site to another with different atmospheric conditions, especially when the local humidity and abundances are very different as is the case between Jungfraujoch (dry, high altitude, mid-latitude) and Ile de La Réunion (humid, low altitude, low latitude). Still we have been able to show the feasibility of retrieving particular trace gas information even under difficult conditions. Many of our results have been compared to correlative data, to validate the approach and to gain complementary information. It is also important to note that the retrieval strategies developed in AGACC have regularly been presented to
proposed for adoption as a standard in the community (e.g., for hydrogen cyanide (HCN)).
In particular:
We have been able to study the seasonal variations of HCN at the Jungfraujoch and at Ile de La Réunion, and to show the dominant impact of biomass burning.
Formaldehyde was studied in much detail at Ukkel, Jungfraujoch and Ile de la
Réunion. The challenge for detection at Jungfraujoch is the small abundance (about 10 times smaller than at Ukkel and Ile de La Réunion); a particular observation strategy was developed successfully, resulting in a time series that already shows the day-to-day and seasonal variations. At Ile de La Réunion, comparisons of FTIR, MAXDOAS, satellite and model data have (1) shown the good agreement between the various data sets, but also, (2), the variability of HCHO (diurnal, seasonal, day-to-day), and (3), thanks to the complementarities of the various data sets, they have enabled us to learn more about the long-range transport of Non-methane Volatile Organic Compounds (NMVOCS, precursors of HCHO) and deficiencies in the models. It was shown that fast, direct transport of NMVOCS from Madagascar has a significant impact on the HCHO abundance and its variability at Ile de La Réunion, and that this is underestimated in the model.
Significant progress was made as to the detection of 13CH
4 and CH3D from
ground-based FTIR observations, both at Jungfraujoch and Ile de La Réunion. To our knowledge, it is the first time that a δ13C data set is derived from ground-based FTIR
observations. More work is needed to improve the CH3D retrieval at Ile de La Réunion,
and to interpret the results, in combination with models.
Also for the first time, 12CO and 13CO have been retrieved individually at Jungfraujoch.
The δ13C time series shows significant seasonal and interannual changes.
As to the hydrocarbon ethylene, it is shown that it can be detected at Jungfraujoch only in spectra at low solar elevation, given its small atmospheric abundance.
Regarding acetylene, the observed time series at Jungfraujoch and Ile de La Réunion show clear seasonal variations and enhancements due to the impact of biomass burning events, correlated with enhancements in CO, C2H6 and HCN.
It is not clear yet whether we can reliably retrieve the concentration of HCFC-142b, a replacement product that is increasing strongly in the troposphere. New line parameters for the interfering species HFC-134a are required to confirm/infirm the preliminary results. This highlights again the importance of the laboratory work for providing such parameters.
Improved line parameters have been obtained for water vapour and its
isotopologues, ethylene and formic acid. These AGACC results have been integrated in the international spectroscopic databases. We also showed that line intensities available
around 2096 cm–1 for the 13C16O isotopologue of carbon monoxide in the HITRAN
database seem to be accurate to 2%. We failed to improve line intensities for the 13.6 m region of acetylene.
The new data sets that have been derived in AGACC from FTIR and MAXDOAS observations have been archived in the NDACC data centre, where they are available for users (generally modelers and satellite teams). In addition, they are stored locally and are available to users upon request.
AGACC results have been reported to the international scientific community, via the literature, via integration in geophysical or spectroscopic databases, and via participation to international research initiatives like the Atmospheric Water Vapour in the Climate System (WAVACS) Cost Action, the International Space Science Institute (ISSI) Working Group on Atmospheric Water Vapour, the International Union of Pure and Applied Chemistry (IUPAC) project, the International CINDI campaign, etc.
The results have already found important scientific applications. A few examples are worth mentioning: the re-evaluation of methane emissions in the tropics from SCIAMACHY based on the new H2O spectroscopy, and the improved retrievals of
HCOOH from the satellite experiments ACE-FTS and IASI, and from the ground.
In the longer-term, the AGACC results will no doubt benefit the research in atmospheric sciences –in particular in the monitoring of its composition changes–, which is the fundamental basis of environmental assessment reports for supporting policy makers.
Keywords:
Atmospheric composition change; trends; monitoring; remote-sensing; ground-based spectrometry; radio soundings; greenhouse gases; tropospheric chemistry; climate change
I INTRODUCTION
I.1 Focus on chemistry-climate interactions: rationale
Because of their environmental consequences, including their effects on the climate system and on living organisms, perturbations in the chemical composition of the stratosphere and the troposphere have drawn the attention of the scientists, the decision makers and the general public. Before any measures can be taken to counter harmful changes, one must (1) identify the changes, and (2) understand the chemical and physical processes that are involved, and (3) be able to predict the future evolution. This project focuses on the first and second points, and particularly looks at a few atmospheric constituents that have a direct or indirect impact on the Earth climate. It is well understood that many changes in the chemical composition of the atmosphere not necessarily directly affect the radiative budget of the atmosphere, but often affect it via chemical processes that create tropospheric ozone, or change the lifetime of greenhouse gases, or – in case of the aerosol – create clouds and fog that alter the penetration of sunlight through the atmosphere. Often the changes go hand in hand with a degrading of the air quality and of the quality of life.
I.2 Objectives
The choice of the scientific objectives of the project have taken into account ongoing international research programmes, the specific observation capabilities and expertise in the consortium, as well as its collaborations with foreign research teams.
The general objective has therefore been to improve and extend the ground-based detection capabilities for a number of climate-related target species and, based on these new or improved capabilities, analyse past and present observations to derive new information about the atmospheric composition, its variability and long-term changes. Despite the advent of a growing and more performant fleet of Earth Observation satellites, ground-based observations are still indispensable to (1) guarantee long-term continuity, homogeneity and high quality of the data, and (2) to underpin the satellite data for calibration and (long-term) validation.
The more specific objectives have been:
- To gain a better understanding of the atmospheric water vapour, by (1) correcting and exploiting long-term radiosoundings of the atmospheric humidity up to the Upper Troposphere/Lower Stratosphere (UTLS) at Ukkel, (2) contributing to the development of retrieval strategies for water vapour and its isotopologues from ground-based Fourier transform infrared remote-sensing observations, at various
types of sites. A side objective has been to study the consistency between various observing systems for the integrated water vapour (IWV) content in the atmosphere. - To develop new observation capabilities for operational monitoring of the aerosol optical depth and additional optical properties, and to improve UV-index forecasts and the retrieval of other trace gases based on the derived aerosol information.
- To develop observation and retrieval strategies for some atmospheric climate-related gases that have not yet or not yet sufficiently precisely been detected and that are important in the chemistry of the troposphere or stratosphere. The species considered are methane and carbon monoxide and their isotopologues, formaldehyde, hydrogen cyanide, HCFC-142b, ethylene, acetylene, and OH.
- To use all these developments to analyse past and present timeseries, to obtain new information about the atmospheric composition and variability.
- Our advantage is that we make observations at different sites under different atmospheric conditions, and that we are thus well placed to evaluate such strategies and, once operational, to derive interesting information;
- To provide improved spectroscopic data to support not only the above ground-based remote-sensing observations but also the satellite measurements, as well as radiative budget calculations.
- To prepare for satellite validation: many of the above targets are also measured from satellite but urgently need to be validated.
II METHODOLOGY AND RESULTS
Section II is structured as follows:
For each major research topic (sections II.N.n), we start with a rationale for the topic, then we give the more technical information about the research activities that have been carried out and we discuss detailed results, and we end with some major conclusions. Some of the technical details that were discussed in intermediate reports have not been repeated here. We refer to them as AGACC2007, AGACC200806, and AGACC200812 for the Activity Report intended for the Intermediary Evaluation, the Final Report of Phase I and the Annual Report 2008, respectively.
II.1 Field observations II.1.1 Water Vapour II.1.1.1 Rationale
Water vapour in the atmosphere is the key trace gas controlling weather and climate. It also plays a central role in atmospheric chemistry, e.g., by influencing the heterogeneous chemical reactions that destroy stratospheric ozone. Water vapour is also the most important greenhouse gas in the Earth’s atmosphere. Its amount is changing. Much research is ongoing to identify these changes and to understand their origin and consequences. There exist many in situ and remote sensing techniques – from ground, balloon, aircraft and space - to measure water vapour in the atmosphere. Some measure only the total amount, also called the Integrated Water Vapour amount or IWV. Some techniques are capable of determining the vertical distribution of water vapour in the atmosphere, in a limited altitude range. There is no technique available that can measure the water vapour vertical profile with sufficient precision over the whole altitude range of the atmosphere, mainly because of the large vertical gradient in the water vapour concentration. Therefore, different techniques are needed to get a complete picture. But an additional challenge is that the abundance of water vapour is highly variable in time and space. Therefore, it is more difficult to compare or to use in a synergistic way different observations that are not taken exactly in the same airmass. The measurement of water vapour is a hot topic since several years, this can be demonstrated by the large number of coordinated investigations that have been and are still ongoing. We can mention the latest SPARC (Stratospheric Processes and their Role in Climate) Assessment of Upper Tropospheric and Stratospheric Water Vapour [SPARC, 2000], as well as the ongoing WAVACS Cost Action (Atmospheric Water Vapour in the Climate System; http://www.isac.cnr.it/~wavacs/), and the meetings and reports of the
ISSI (International Space Science Institute) Working Group on Atmospheric Water Vapour.
(http://www.iapmw.unibe.ch/research/projects/issi/index.html)
In the AGACC consortium, we have various techniques at our disposal to observe water vapour, especially the IWV and the vertical distribution in the troposphere up to lower stratosphere. In the Upper Troposphere/Lower Stratosphere (UTLS), the effects of water vapour are large and its long-term variation is not well known.
Our objectives have therefore been (1) to improve the quality of radiosonde measurements of upper troposphere humidity (UTH), (2) to investigate trends in UTH, (3) to investigate the capabilities of Fourier-transform infrared measurements from ground and space for the observation of the column and vertical distribution of water vapour, (4) to compare various observation techniques of the IWV, and (5) to contribute with this expertise to the international research forum via WAVACS and the ISSI Working Group on Atmospheric Water Vapour.
Recent studies have demonstrated the potential and the interest of the water vapour isotopologues for studying fine processes of the hydrological cycle ([Worden, 2007]; [Frankenberg, 2009]; [Risi, 2010]; [Sherwood, 2010]). The analysis of the water vapour isotopologic partioning is strongly influenced by evaporation sources and condensation conditions and it is therefore very useful to derive information on the water vapour sources, sinks and dynamics ([Herbin et al, 2009]; [Zahn et al.,2006]). In this perspective, an additional objective has been to investigate the potentiality of FTIR measurements to retrieve information on water vapour isotopes.
II.1.1.2 Exploitation of radiosondes measurements at Ukkel
Climate models predict that the concentration of water vapour in the upper troposphere could double by the end of the century as a result of increases in greenhouse gases [Soden et al., 2005]. Observations indicate that the height of the tropopause has increased by several hundred meters since 1979 [Santer et al., 2003]. We try to reconcile these two trends by using the rather uniform dataset of radiosonde vertical profiles we gathered at Ukkel since 1990. This dataset can form the basis for a time series analysis of the humidity field in the UTLS.
As the radiosonde humidity sensors suffer from several instrumental or calibration shortcomings (e.g. time lag of the response, inaccurate calibration model for the temperature dependence of the response at low temperatures, solar radiation dry bias, chemical contamination dry bias, icing during the ascent…) we compared 2 different
and independent (dry) bias correction methods suggested in the literature by Leiterer et al. [2005] and Miloshevich et al. [2004]. After comparison of the humidity profiles corrected by either method with simultaneous data measured by another radiosonde type on the same balloon, we conclude that the Miloshevich method tends to overcorrect the humidity profile in UT conditions (i.e. at low temperatures and high relative humidity). This finding is in agreement with studies based on the comparison of radiosonde data with data from independent and well-calibrated hygrometers [Suortti et al., 2008]. We therefore chosed to correct our database with the method developed by Leiterer et al. [2005].
Nevertheless, after correction, a dry bias persists in the humidity profiles of the RS80 type of sondes, even at the lower tropospheric layers. A supplementary indication for this dry bias is given by the comparison of the total integrated water vapour amount (IWV) calculated from or measured with four different instruments at Ukkel, as discussed hereafter in Section II.1.1.4.
The 1990-2007 time series of corrected relative humidity profiles was then further used for a trend analysis, where we first focus on the UTH. As can be seen in Figure 1, the upper tropospheric layers are moistening until September 2001, underwent a drop in humidity around this date, and are drying (not significantly, however) afterwards. The same change point occurs for the tropopause temperature/height/pressure: before Sept. 2001, the tropopause layer was descending, after this date, it is moving up.
So we conclude that the tropopause layer above Ukkel is going down from 1990 – September 2001, hence warming up, which results in a moistening. After September 2001, the tropopause layer is lifting, cooling down and (slightly) drying. The September 2001 change seems to have a physical origin, because this change point or trend turning point was detected in the time series of different observed variables. Moreover, Randel et al. [2006] also mentioned decreases in stratospheric water vapour after 2001 in both satellite (HALOE) and balloon (Boulder) observations. They related this feature to an enhanced tropical upwelling after 2001 – resulting also in lower tropical tropopause temperatures and a lower ozone amount near the tropical tropopause – and leading to a change in the Brewer-Dobson circulation.
However, we found indications that the movement of the upper tropospheric layers is rather due to the dynamics of the underlying troposphere, which in turn is governed by the temperature variation at the surface. Indeed, the surface temperature is correlated with the temperature at 500 hPa, which is anti-correlated with the tropopause temperature. As shown in Figure 2, the surface warming is responsible for the heating of the lower tropospheric layers. Due to convection, this heating will give rise to a lifting
difference of the geopotential height at 300 hPa with the geopotential height at 700 hPa): its trend is clearly correlated with the lower tropospheric temperature trend and anti-correlated with the tropopause temperature trend, with also a change point around September 2001. Finally, we also calculated the trends of the tropopause temperature (i) from the Ukkel radiosonde time series starting in 1969 and (ii) for radiosonde databases gathered at other European stations. It turns out that the September 2001 change point is degraded in the longer times series (other, stronger, change points exist), but that it is nevertheless present in the time series at stations located close to Ukkel. We also conclude that the Ukkel monthly mean tropopause temperature anomaly trends are very typical for the 45°– 55° NB and 5°WL – 15°OL geographical range (correlation coefficients larger than 0.6). The scenario discussed in Figure 2 can also be applied to this geographical range to explain the observed temperature trends.
Figure 1 : Left panel: Ukkel trend analysis results for the monthly means of specific humidity calculated for layers of thickness 1 km and central height relative to the tropopause. The vertical green dash-dotted line marks the September 2001 change point, full lines represent statistically significant linear trends, dashed lines non-significant trends. Right panel: Ukkel trend analysis results for the monthly anomalies of tropopause height (in km). The time series is split in two parts: one before and one after the September 2001 change point and trends are calculated for the partial time series.
A new, very surprising result of our detailed analysis of the radiosonde time series at Ukkel is the presence of a correlation between the 11-years solar cycle and, for instance, the tropopause temperature (see Figure 3). It seems that the solar cycle influences the time series of the studied tropospheric variables and it might also partly be responsible for the September 2001 change in UTH and tropopause properties.
Figure 2 : Proposed scenario, which is able to explain the observed temperature and humidity trends at different heights at Ukkel.
Figure 3 : Comparison of the normalized smoothed monthly anomalies of the time series of the solar (radio) flux at 10.7cm and the tropopause temperature.
II.1.1.3 Retrieval of water vapour from Fourier Transform Infrared observations
Retrieval of water vapour (total column and profile information) from ground-based FTIR observations is a relatively new activity which is still under development [e.g., Schneider et al., 2009a; 2009b]. One of the key issues in the development of the technique is to have coincident measurements available for comparison and validation of the FTIR results. This is problematic owing to the extreme temporal and spatial variability of water vapour in the troposphere. Therefore, we have initiated these developments at three stations where correlative data are available, namely Ukkel, Ile de La Réunion and Jungfraujoch. Details about the retrieval strategy at the three locations have been provided in the Annex to AGACC2007; updates since then at Jungfraujoch are discussed hereinafter (Section II.1.1.3.3).
II.1.1.3.1 At Ukkel
At Ukkel, we had a dedicated observations campaign with simultaneous FTIR, CIMEL, radiosonde and GPS measurements, between July 13, 2006 and April 22, 2007. Details about the experimental setup during this campaign have been decribed in the Annex to AGACC2007. During this period, about 900 spectra were recorded in the IR during 37 sunny days, and 20 noon PTU soundings were performed. Finally for only 11 IR spectra recorded on 4 different days the temporal noon coincidence with the sonde was achieved. The coincidence criteria have been set as: ± 75 minutes time difference between sonde launch and FTIR spectrum acquisition.
Much effort has been put on the retrieval of the main isotopologue H216O from the FTIR
data for the purpose of intercomparison with the radiosonde data. The characterization of the information comprised in the measurements and error budgets computations have been performed. Typical averaging kernels show that the FTIR observations contain information about the vertical distribution from the surface up to 12 km. The best vertical resolution of the retrieval is observed between 0 and 6 km. The number of independent layers contained in the retrieved profile is 3 at best. On the basis of errors and averaging kernels, the sensitivity is max between 0 and 8 km, and the corresponding uncertainty is less than 50%.
Total columns (expressed as molec/cm2) have been converted to Total Precipitable
Water (TPW) or IWV (mm) and comparisons have been made with CIMEL, integrated sonde and GPS data, as further discussed in Section II.1.1.4. We observe a systematic dry bias of the FTIR with respect to the other data.
To compare the retrieved low-resolution vertical distribution from the ground-based FTIR data with the high-vertical-resolution radiosoundings, the latter profiles have been smoothed with the FTIR averaging kernels. Figure 4 shows a typical example comparison on Oct. 11, 2006. The agreement is good except for the lowest layers below
4 km, where the FTIR underestimates the concentration in water vapour, thus explaining the dry bias in the columns.
0 2 4 6 8 10 12 14
1E-5 1E-4 1E-3 0.01 -3 -2 -1 0
H 2OLog(VMR) [ppmv] Al ti tu d e [ km] 11 Oct 2006 Mid-lat A priori sonde Retrieved Smoothed sonde -20 0 20 Rel diff [%] Diff (x1E-3)
Figure 4: Retrieved H216O profile in log(vmr) on Oct. 11, 2006 (4 other coincident retrievals gave identical results but are not shown for clarity), and comparison with the coincident sonde profile. The a priori profile is also shown.
II.1.1.3.2 At Jungfraujoch
A validation campaign has been performed above the Zugspitze station (~250 km away from Jungfraujoch) in the second part of 2002, allowing to perform comparisons between radiosondes and FTIR integrated water vapor (IWV) measurements taken within ±1 hour and a few km apart. This offered the unique possibility to set up and tune the FTIR retrieval strategy for water vapour, to match IWV deduced from the radiosondes. The optimization was achieved by implementing a Tikhonov regularization scheme and tuning the corresponding parameters to get the best agreement between both data sets. Three domains completely free of telluric interferences were selected for the FTIR retrievals (839.5 – 840.5, 849.0 – 850.2 and 852.0 – 853.1 cm-1), they include strong
and weak absorption lines to maximize the information content and get optimum sensitivity in the whole troposphere.
This retrieval approach has been adopted also for Jungfraujoch, after proper adjustment of the retrieval parameters, e.g. taking into consideration the influence of the spectral point spacing on the regularization strength. Further harmonization was ensured by using, e.g., the same a priori H2O vertical distribution for both Alpine sites, the same
Jungfraujoch spectra encompassing the selected windows and recorded either with the Homemade or the Bruker instrument from 1988 onwards have been analyzed. After selection, results from more than 9000 spectra were included in the trend analysis; a mean Degree of Freedom for Signal (DOFS) of 1.87 was achieved.
YEAR 1989.0 1992.0 1995.0 1998.0 2001.0 2004.0 2007.0 2010.0 Integr at ed w at er vapor (m m ) 0 1 2 3 4 5 6 7 8 9 10 11
Jungfraujoch FTIR
measured trend + intra-annual trend
Figure 5 : Time series of IWV measurement derived from Jungfraujoch observations performed with the homemade and the Bruker FTIR instruments [updated from Sussmann et al., 2009]. Table I : Trend statistics for IWV above Jungfraujoch
2.5th percentile Trend 97.5th percentile Trend 1988-2010 mm/decade Wintertime (Dec.-Feb.) -0.168 -0.129 -0.093 -0.13 ± 0.04 Summertime (Jun-Aug) 0.256 0.360 0.459 0.36 ± 0.10 Year-round -0.008 0.031 0.068 0.03 ± 0.04
Trends are given in mm/decade, for the time periods identified in the first column. The uncertainty intervals are provided at the 2.5th and 97.5th percentiles.
Figure 5 reproduces the Jungfraujoch IWV time series. The long-term trend was evaluated using the bootstrap resampling method described in Gardiner et al. [2008]. The derived trend (as well as its linear component) is reproduced as a thick red line in Figure 5. As expected, the seasonal modulation shows a very large amplitude, with
maximum IWV in August while the driest days are found in winter. Table I lists the trends derived over 1988 – 2010, together with associated uncertainties (95% interval), when considering year-round data or only the winter and summer seasons. If significant positive or negative trends are derived for summer and winter, respectively, the whole set does not show a statistically significant trend, in contrast with Zugspitze results. Identification of the causes for these uneven trend behaviors will require further investigations.
Figure 6 : Standard deviation of the IWV differences deduced from nearly coincident measurements performed at the Jungfraujoch with the homemade and the Bruker FTIR instruments. The rapid increase noted in the standard deviation reflects the very large intraday variability of water vapor [Sussmann et al., 2009].
In addition, we have taken advantage of the fact that two FTIR instruments are regularly operated simultaneously at the Jungfraujoch. Nearly coincident measurements have been compared to check the consistency between both instruments, but also to derive the precision of the IWV measurements. IWV data derived from the two FTIRs were compared, a series of subsets were generated, allowing progressively for an increasing time difference between the two measurements, from a few minutes to several hours. In a next step, the standard deviation was computed for each ensemble. All these values are reported in Figure 6 as a function of the maximum time difference allowed. The numbers of available coincidences per subset are provided in the figure. This allows (i) to determine a negligible bias between the two instruments of 0.02±0.01 mm when considering the 32 coincidences within 3.75 min, the corresponding standard deviation amounts to 0.07 mm; (ii) to illustrate how rapidly the natural atmospheric variability impacts and dominates the statistics of the comparisons, and therefore that meaningful comparisons really require very close coincident measurements of water vapor, in space
lower than 0.05 mm, or 2.2% of the mean IWV. More details about these investigations can be found in Sussmann et al. [2009].
II.1.1.3.3 At Reunion Island
Because of the increasing interest of water vapour isotopologues for studying the physical processes underlying the hydrological cycle, the retrieval of vertical profiles of different isotopic species from the FTIR spectra has been initiated in the course of the project. We focused on the two isotopologues H216O and HDO because the accuracy
needed to get variations of the HDO/H2O ratio (5-10%), wich expresses the
fractionation processes between the two species, is expected to be achieveable with FTIR measurements. However, the retrieval of accurate HDO/H2O ratios is highly
challenging. In the case of H218O and H217O the variations of their respective ratios with
H2O (H218O/H2O and H217O/H2O) are smaller than the HDO/H2O ratio and would
require accuracies of 1% which are hardly reachable. Nevertheless, the retrievals of H218O and H217O were tested in order to fully exploit the measurements. The retrieval
code was Atmosphit [Barret et al., 2005; Hurtmans et al., 2005].
It is the first time that retrievals of water isotopologues are attempted at sea level with high humidity level. For that reason a series of new narrow spectral windows, including lines of medium strength have been studied and selected.
For H216O, 4 independent pieces of vertical information, mainly located between the
ground and 7 km could be extracted. The retrieved profiles and total columns were compared to coincident CIMEL sunphotometer measurements and a good agreement was obtained (Figure 8 and Figure 9). For H218O, vertical profiles are obtained for the
first time. They also contain 4 independent pieces of information, with a vertical sensitivity similar to that of H216O. For HDO, the coupling of 2 well-chosen
micro-windows instead of a single micro-window gave improved results as to the quantitative information that could be extracted from the measurements as well as to the error budget. This approach allowed extracting 3 pieces of information with a vertical sensitivity again similar to that of H216O in the best cases. Finally, for H217O only total
columns could be retrieved because the absorptions are very weak. For all, the retrieved information is mainly restricted to the low and the free troposphere (up to 14 km at best). An example timeseries for H218O is presented in Figure 7.
Figure 10Figure 10 shows the ∂D time series for the 2009 campaign of measurements at Ile de la Réunion. We only plot the results between 1 and 5 kilometers where the sensitivity is maximum for H2O and HDO. Beyond these maximum sensitivity limits, the
of this time series shows low ∂D values for June and high values during the austral summer. This can be explained simply by the increase of the sea surface temperature and thus the increase of evaporation from ocean wich is the source of heavy molecules. However points are quite scattered around this seasonal trend. The scattering of the points can be explained for two reasons: the limited accuracy of the retrievals and a possible diurnal cycle for ∂D. Our measurements have provided evidence for the existence of this diurnal cycle (Figure 11).
Figure 7 : Temporal evolution of the H218O vertical profiles during the 2004 campaign.
Figure 8 : Time series of IWP at Ile de la Reunion with CIMEL time series 2009 campaign. As in situ measurements of ∂D require specific instruments, the validation of
is provided through comparison to simple models. Figure 12 shows a delta-q diagram for the ∂D estimates of the 2009 campaign [Worden, 2007]. The Rayleigh distillation curve describes the depletion of air mass with respect to sea surface temperature. The evaporation line represents the enriching effect that arises from mixing moist marine with drier air parcel. If the air mass behaves exactly as the model predicts, the measurements should be located between the two curves. The pattern of our results follows well a Rayleigh distillation pattern with an increase of the depletion with drier air masses. However our measurements seem to be more depleted than predicted, which could indicate a bias in the retrievals. Worden (2006) has earlier suggested the existence of a 5% bias due to errors in HDO reference line intensities.
Figure 9 : Comparison of coincident FTIR and CIMEL measurements at Ile de la Réunion during the 2009 campaign.
Figure 10 : ∂D time series for the 2009 campaign. ∂D = 1000*((HDO/H2O)/VSMOW-1). VSMOW is the Vienna standard for the mean isotopic composition of ocean water.
Figure 11 : ∂D plotted in function of the local time. The trend shows a diurnal cycle of the depletion with an increase of ∂D from 8 hr to 12 hr and a decrease from 12 hr to 16 hr.
The coupling of ground-based upward looking FTIR measurements with the IASI nadir infrared satellite measurements was attempted during the project. Retrievals of H216O,
HDO and H218O from ground based and IASI spectra were first compared and
characterized. Ground-based retrievals show a better sensitivity in the planetary boundary layer (PBL, 0-1 km), but a loss of sensitivity and a significant increase of the uncertainties above 6km. On the other hand, IASI retrievals give a higher number of independent values and a uniform sensitivity throughout the troposphere above the PBL. Near the surface, IASI retrievals show less sensitivity as expected from nadir thermal IR soundings.
Figure 12 : Delta-q diagram of FTIR measurements at Ile de La Réunion
A joint retrieval was shown to improve the vertical sensitivity, mainly by adding to the satellite data information on the concentration of the heavier isotopologues in the boundary layer, as illustrated in Figure 13.
Figure 13: Averaging kernels for HDO obtained from an IASI retrieval alone (left) and a joint gb+IASI retrieval (right).
The maximal sensitivity which was located in the 4-6km altitude layer for IASI alone is extended to the 0-6 km altitude range. Also, the number of independent information on the vertical has slightly increased (degrees of freedom= 3.43 for IASI alone and 3.88 for the combination). The situation is a bit different for H216O because the sensitivity close
to the ground is already good for the IASI retrieval. In fact, we find that the joint retrieval allows an increase of the vertical sensitivity in the upper troposphere, up to the tropopause. The errors remain, however, relatively large and this is likely to be a drawback in determining isotopic ratios. Considerable time and efforts were devoted to
improving the algorithm, notably by introducing a constrained retrieval of the isotopic ratio. The technique was tested on the IASI HDO/H2O ratio but again with mitigated
results, likely due to improper retrieval constraints (a priori variance-covariance matrix). The results gathered during this project with regard to the retrieval off the heavier isotopologues open promising research perspective for the future. However, we recommend that more work is carried out to build adapted covariance matrices and/or to assign the constrain during the retrieval process on the HDO/H2O directly.
II.1.1.4 Comparisons of IWV measurements from FTIR, radiosoundings, CIMEL and GPS at Ukkel
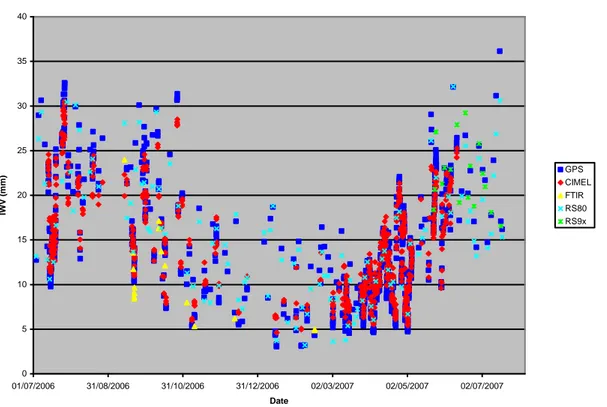
The data collected during the campaign at Ukkel from July 2006 to April 2007 constitute a very useful set for comparing IWV measurements from ground-based FTIR, CIMEL, and GPS instruments and radiosoundings. Although the measurement principles for the various instruments are very different, one sees from Figure 14. a relatively good agreement between all data sets.
Nevertheless, if we look at the differences relative to the GPS measurement, we see a seasonal variation in the difference, especially of the CIMEL versus the GPS. Table II provides an overview of the statistical results of the comparisons.
Table II : Results of different intercomparisons between instruments measuring IWV (in mm) at Ukkel. RMS: root-mean-square standard deviation of the differences; N: number of measurements in the comparison data sets; Slope, Intercept and R2 define the correlation line and the correlation coefficient, respectively.
Bias (mm) RMS (mm) N RMS/ N Comments
(1 2)
Slope Intercept R2
CIMEL-GPS 0.28 1.16 734 0.043 No bias 0.87 2.10 0.98
FTIR-GPS -2.64 3.58 25 0.716 Dry bias 0.82 0.25 0.87
RS80-GPS -1.22 2.21 123 0.199 Dry bias 0.88 0.74 0.94
RS9x-GPS 0.91 1.41 17 0.342 Wet bias 1.01 0.66 0.91
We can conclude that the FTIR data gives the driest results, followed (in order dry to wet) by the RS80, then the GPS, the CIMEL and finally the RS9x soundings that give the wettest results. We have not yet further investigated the reasons for the differences. Schneider et al. [2009b] have made a similar study at Izaña very recently.
0 5 10 15 20 25 30 35 40 01/07/2006 31/08/2006 31/10/2006 31/12/2006 02/03/2007 02/05/2007 02/07/2007 Date IWV ( m m ) GPS CIMEL FTIR RS80 RS9x
Figure 14 : Comparison of simultaneous integrated water vapour (IWV) amounts at Ukkel measured by 4 different techniques (5 instruments) for the period July 2006 to April 2007. The vertical humidity profiles measured by radiosondes were corrected with the Leiterer method (RS80) or the Miloshevich method (RS9x) before calculating the IWVs.
-8 -6 -4 -2 0 2 4 6 8 01/07/2006 31/08/2006 31/10/2006 31/12/2006 02/03/2007 02/05/2007 02/07/2007 Date IWV CIMEL-GPS FTIR-GPS RS80-GPS RS9x-GPS Poly. (CIMEL-GPS)
Figure 15 : Time series of differences between simultaneous hourly Integrated Water Vapour values recorded by different instruments at Ukkel (July 2006-April 2007). The black line shows a polynomial fit through the difference between the CIMEL and the GPS data.
II.1.1.5 Major conclusions
In AGACC, we have investigated various experimental techniques to measure the concentration of water vapour in the atmosphere, focusing on the total column as well as on the vertical distribution in the troposphere up to the lower stratosphere. The retrieval of water vapour profiles and total columns from ground-based FTIR data has been initiated at three very different stations where correlative data for verification are available, namely Ukkel (± sea level, mid-latitude), Ile de La Réunion (± sea level, tropical) and Jungfraujoch (high altitude, mid-latitude), with promising results. In particular, at Jungfraujoch, it has been demonstrated that the precision of the FTIR IWV measurements is of order 2%. The capability to retrieve from the FTIR measurements individual isotopologues of water vapour and to follow their day-to-day and even their diurnal cycle has been demonstrated. The comparison to models sheds light on some of the fine processes of the hydrological cycle. Joint retrievals of FTIR water vapour profiles with IASI have been attempted and look promising, but need further investigations.
A correction method for the radiosoundings at Ukkel has been successfully implemented, resulting in a homogeneous and reliable time series from 1990 to 2008 from which trends in UTH and tropopause characteristics have been derived. One observes a rising UTH until September 2001, followed by a decline. These trends are accompanied by a descent and heating of the tropopause up to the turning point and an ascent and cooling afterwards. The changes after September 2001 in the upper troposphere can be explained by surface heating and convective uplift. A new result is also the correlation between the 11-year solar cycle and the tropopause properties at Ukkel.
At Jungfraujoch, one does not observe any significant trends in the total water vapour abundance above the station for the last 23 years, although significant negative winter and positive summer trends have been detected. A study of the time variability of the total water vapour abundance has indicated that the time scale of the variations is in the order of minutes.
We have made a quantitative statistical comparison between ground-based FTIR, CIMEL, GPS and integrated (corrected) sonde measurements of IWV at Ukkel: we find very good correlations between all datasets, but also some wet and dry biases.
II.1.2 Aerosol detection and properties II.1.2.1 Rationale
for various reasons. First they serve to transport nonvolatile material from one place to another on Earth. Second, they affect the optical properties of the atmosphere. In particular, it has been demonstrated in previous studies that the aerosols have a large impact on the quantity of harmful UV-B radiation received at the Earth’s surface. This radiation has consequences on both climate and the health of the biosphere (including human health, crop growth, etc.). The latest IPCC Report also stressed that the radiative forcing caused by atmospheric aerosols is one of the largest uncertainties in determining the total radiative budget of the atmosphere. Part of the radiative forcing is indirect, because the aerosols act as nuclei for the formation of clouds or fog, which in turn affect the penetration of sunlight to the surface. And last but not least, aerosols affect the chemical reactions in the atmosphere; a well-known effect is their impact on the ozone depletion processes. Better monitoring capabilities of aerosol properties can therefore improve our understanding and forecasting of the atmospheric processes and evolution, and in particular of UV-B and climate changes.
In AGACC, we developed and implemented new observation techniques for monitoring aerosol properties. The focus is on the total aerosol optical depth (AOD), profiling in the boundary layer, and the derivation of some optical properties. These developments have already served to improve UV-B forecasting and the retrieval of other trace gases that are affected by the presence of aerosol.
That operational monitoring of aerosol is of current interest in the international atmospheric research community can be seen also in the efforts that have been deployed in this direction during the CINDI (Cabauw Intercomparison Campaign of Nitrogen Dioxide measuring Instruments; http://www.knmi.nl/samenw/cindi/
index.php) campaign in June-July 2009 in Cabauw (the Netherlands), that is discussed
briefly in Section II.1.2.3. This campaign was supported by CEOS (Committee on Earth
Observation Satellites) and the EU Integrated Project GEOmon
(http://www.geomon.eu). BIRA-IASB participated to this campaign and is currently
working on the results.
II.1.2.2 CIMEL sunphotometer measurements of aerosol
A CIMEL sunphotometer was installed at Ukkel (50.5°N, 4°E) in July 2006 and has operated correctly from July 2006 to September 2007 and from March 2008 to April 2009. There have been 2 recalibration periods (standard intercalibration with an AERONET master instrument at Carpentras (44° N, 5° E)) during October 2007-February 2008 and May 2009. Since June 2009 the recalibrated instrument is back in operation. The instrument is part of the AERONET network [Holben et al. (1998)] and its processed data (e.g., aerosol optical depth (AOD), aerosol size distribution, and integrated water vapor (IWV) are available on the associated website (http://aeronet.gsfc.nasa.gov/). They
have already been used in several studies – e.g., in the IWV comparisons discussed in Section II.1.1.4, and in Dewitte et al. [2007] to perform an analysis of the solar radiation at Ukkel from a climate change point of view. The AOD data have also been used in an intercomparison of AOD retrieved from the CIMEL measurements and from Brewer ozone measurements by Cheymol et al. [2008]. And they supported the validation of the AODs retrieved from MAXDOAS measurements in Ukkel – see Section II.1.2.3.4, and for intercomparison with the Brewer data, as described in Section II.1.2.4.
II.1.2.3 MAXDOAS measurements of aerosol
In the framework of the AGACC project a “new generation” of multi-axis differential optical absorption spectroscopy (MAXDOAS) instruments has been designed. These instruments are optimized for the retrieval of atmospheric absorbers, including aerosol and trace gases, present in the lower troposphere. They are able to measure the direct-sun and scattered light at various elevation and azimuth angles in the UV and visible (VIS) regions of the electromagnetic spectrum. To obtain near real time information on aerosol properties and trace gas profiles from the MAXDOAS measurements, a state-of-the-art retrieval algorithm was developed based on the radiative transfer code LIDORT and the optimal estimation method (OEM).
Currently two of these “new generation” MAXDOAS instruments are operational: A first one has been operated for a 10-month time period (June 2008 to April 2009) in Beijing (39°58’37”N; 116°22’51”E), China, where it was installed on the roof of the institute of atmospheric physics a few hundred meters from the Beijing Olympic stadium. Later on, this instrument was involved in the CINDI campaign in June-July 2009 in Cabauw, the Netherlands. During this campaign a large number of MAXDOAS instruments were brought together to evaluate the performance of the newly developed systems through intercomparison of the measured differential slant column densities (DSCDs) and relative intensities. As part of post-campaign activities, the aerosol extinction and trace gas vertical profiles retrieved by the different participating state-of-the-art algorithms will be intercompared. We will also have the opportunity to validate and uniformize the retrievals through comparison with additional aerosol and trace gas measurements (sunphotometer, LIDAR, and in-situ measurements) made in Cabauw. Such validations of both measurements and retrieved data products are essential milestones in the process of building reliable monitoring facilities for the near real time retrieval of aerosol and trace gas properties from MAXDOAS measurements.
A second MAXDOAS instrument was installed on the roof of the building of the Royal Meteorological Institute in Ukkel (50.5°N, 4°E). The instrument operated continuously from March until June 2009.
A short description of the MAXDOAS instruments designed and assembled at BIRA-IASB was already given in AGACC200806 and is not repeated here. The next section provides a short outline of how these systems were set up at the different observation sites and how the raw DSCDs measurements are obtained. The following section describes the algorithm developed for the retrieval of aerosol extinction vertical profiles and shows the results for two different sites: The heavily polluted Beijing site, and the relatively less polluted site Brussels.
II.1.2.3.1 The measurements
The measured spectra of scattered sunlight are analysed using the DOAS technique based on a least-squares spectral fitting method [Platt, 1994]. The direct results of this fitting are the DSCDs, i.e. the integrated concentrations of the absorbers along the effective light path of the scattered photons relative to the concentrations of the absorbers in a reference spectrum. For tropospheric profiling purposes, one can eliminate the stratospheric contribution to the measured DSCD by subtracting for each scan the DSCD measured at zenith from the off-axis DSCDs [Wagner et al., 2004; Friess et al., 2006]. The O4 DSCD, needed for the aerosol profile retrieval, are retrieved at 360,
477,577, and 630 nm in the wavelength intervals 344.7-365 nm, 455-500 nm, 540-588 nm, and 602-645 nm. These wavelength regions were optimized to obtain optimal sensitivity for O4 while minimizing correlations with interfering absorption structures. In
addition to the O4 cross-section (xs) other trace gas cross-sections such as O3, H2O, BrO,
were included in the fitting routine, along with a Ring interference spectrum and a low-order polynomial closure term.
As a consistency check, we compared the O4 DSCDs measured on clear-sky days with
relatively low aerosol pollution at 30° elevation with O4 DSCDs simulated using
retrieved aerosol profiles and ancillary aerosol information. Under these conditions, the O4 DSCDs are rather insensitive to changes in the aerosol profile or other atmospheric
parameters. Therefore, a good agreement between the O4 DSCD is expected [Wagner et
al., 2009]. We noticed, however, that depending on location and wavelength the simulated O4 DSCDs were systematically lower by a factor of about 0.8-0.9. Possibly,
the difference is induced during the DOAS retrieval, maybe because of errors in the absolute values of the O4 cross-section. To account for this, we applied a corresponding
II.1.2.3.2 Semi-blind intercomparison of NO2 and O4 columns during CINDI
In June-July 2009, over thirty different in-situ and remote sensing instruments all capable of measuring atmospheric nitrogen dioxide (NO2), were jointly operated during the
Cabauw Intercomparison campaign for Nitrogen Dioxide measuring Instruments (CINDI). The campaign took place in The Netherlands at the Cabauw Experimental Site for Atmospheric Research (CESAR), which is managed by the Royal Dutch Meteorological Institute (KNMI). Its main objectives were to determine the accuracy of state-of-science ground-based NO2 measuring techniques and to investigate their use in
satellite validation. During the first two weeks of the campaign a semi-blind intercomparison was performed involving 22 MAXDOAS and Zenith Sky instruments from a number of institutes worldwide [Roscoe et al., 2010]. These instruments (among them the BIRA-IASB MAXDOAS system) pointed in the same direction and scanned almost the same air mass every 20-30 minutes. The wavelength ranges and inversion algorithm to obtain slant columns of NO2 and O4 were prescribed to minimise
differences caused by these algorithms. The 30-minute averages of the slant column densities of NO2 and O4 matched within 5% for most participating instruments and all
Figure 16 : Straight-line slopes and their standard errors of NO2 slant columns against those of the reference data set, for each instrument at visible wavelengths and for the whole campaign. Colours refer to elevation angles shown top right [Roscoe et al., 2010].
Note that such results are comparable to those obtained in previous intercomparions which were only for zenith-sky instruments hence focussing on stratospheric NO2. The
fact that during CINDI an almost as good agreement was found in MAXDOAS measurements of NO2, which have a much shorter heritage than zenith measurements,
and that an almost as good agreement was found for MAXDOAS measurements of O4,
which are important to diagnose the state of cloud and aerosol in the troposphere, bodes well for the future of measurements of tropospheric NO2 by this important
technique. From this study it became clear that a proper calibration of the elevation angles is crucial for the interpretation of the measurements. Also, the variability of the NO2 with time is observed to be quite large, and a significant part of the scatter in the
Figure 17 : Straight-line slopes and their errors of O4 slant columns against those of the reference data set, for each instrument at visible wavelengths and for the whole campaign. Colours refer to elevation angles shown top right. MPI-Mainz used a non-standard wavelength range for analysis, which did not produce an O4 amount.
II.1.2.3.3 Retrieval of aerosol extinction profiles General algorithm description
An inversion algorithm was developed for the retrieval of aerosol extinction profiles at different wavelengths from MAXDOAS measurements. A detailed description of the algorithm was already given in AGACC200806 and AGACC200812; here we just repeat a short summary.
The aerosol extinction vertical profile is obtained by combining the retrieved O4 DSCDs
for different line of sight (LOS) directions. [Wagner et al., 2004; Hönninger et al., 2004; Friess et al., 2006; Li et al., 2008; Irie et al., 2008] In general, the length of the light path through the atmosphere and thus the observed DSCD of an atmospheric absorber depend not only on the concentration of the trace gas but also on the vertical distribution and optical properties of the aerosol present in the atmosphere [Wagner et al., 2004; Friess et al., 2006]. Consequently, when the vertical distribution of an


![Figure 5 : Time series of IWV measurement derived from Jungfraujoch observations performed with the homemade and the Bruker FTIR instruments [updated from Sussmann et al., 2009]](https://thumb-eu.123doks.com/thumbv2/123doknet/5517849.131734/21.892.149.737.243.680/measurement-jungfraujoch-observations-performed-homemade-bruker-instruments-sussmann.webp)