Implementing Self-Service Business Analytics in Support of
Lean Manufacturing Initiatives
by
Simon LIZOTTE-LATENDRESSE
MANUSCRIPT-BASED THESIS PRESENTED TO ÉCOLE DE
TECHNOLOGIE SUPÉRIEURE IN PARTIAL FULFILLEMENT
FOR A MASTER’S DEGREE WITH THESIS
IN MECHANICAL ENGINEERING
M.A.Sc.
MONTREAL, JANUARY 7 2019
ÉCOLE DE TECHNOLOGIE SUPÉRIEURE UNIVERSITÉ DU QUÉBEC
© Copyright reserved
It is forbidden to reproduce, save or share the content of this document either in whole or in parts. The reader who wishes to print or save this document on any media must first get the permission of the author.
BOARD OF EXAMINERS
THIS THESIS HAS BEEN EVALUATED BY THE FOLLOWING BOARD OF EXAMINERS
Mr. Yvan Beauregard, Thesis Supervisor
Department of Mechanical Engineering, École de technologie supérieure
Mrs. Sylvie Nadeau, President of the Board of Examiners
Department of Mechanical Engineering, École de technologie supérieure
Mr. Lucas Hof, Member of the jury
Department of Mechanical Engineering, École de technologie supérieure
THIS THESIS WAS PRENSENTED AND DEFENDED
IN THE PRESENCE OF A BOARD OF EXAMINERS AND PUBLIC MONTREAL, DECEMBER 17 2018
ACKNOWLEDGMENTS
This past year and a half has felt like a blur to me; a good kind of blur. I have made so many memories, and learned so much about myself and the world, it feels like I have just started truly living. I have so many people to thank for it – mentors, family, and friends. Undertaking this master’s was a big part of this journey, and I would therefore first like to express my gratitude towards Mr. Yvan Beauregard for having seen the potential in me, given me opportunities for growth, and steered this research towards academic rigor and industrial impact – something we can both be proud of.
I would also like to thank my colleagues Christian Leblanc, Sylvain Thibault, and Yanic Berube. It proved challenging at times to study and work full time, but thanks to flexibility, exchange of ideas, and teamwork, I believe the result is more than the sum of its parts.
Special thanks go out to Martin Vigeant not only for having been a good first supervisor in the engineering profession, mentored me for the OIQ, but also for having lent me a copy of
The Goal at a time when I was trying to better understand the dynamics within our company.
I believe it is that read which first sparked my interest for my thesis subject. As to my interest for reading and writing, which goes way back, it is to the fantasy author R. A. Salvatore that I am most grateful. However fictional the novels, I must say my younger self found its moral compass branded by Salvatore’s brilliant plots letting the reader walk in the shoes of characters which were neither black nor white, but gray.
I would like to thank my family for the tremendous amount of support it has given me throughout this endeavor. To my friends, thanks for having stuck through my neglecting and helped me forget about work and school at times – recharge –, I’ll make it up to you. Last but not least, I would like to extend my gratitude towards the Choquette and Derigaud families for having inspired me to become a better version of myself in so many ways.
Implémentation d’analytiques d’affaire libre-service pour supporter les initiatives en opérations épurées dans les environnements manufacturiers
Simon LIZOTTE-LATENDRESSE
RÉSUMÉ
Les programmes d’amélioration continue tels que Lean Six Sigma (LSS) sont les pierres angulaires de nombreuses cultures d’entreprise à haute performance. Toutefois, plusieurs obstacles peuvent se dresser quand vient le temps d’implémenter et de pérenniser des amélioration – de hauts taux d’échec sont rapportés en amélioration continue. La mise à profit des systèmes d’information (SI) existants peut se révéler être un obstacle dans les environnements où les données sont fragmentées entre les multiples bases de données des progiciels de gestion intégrés et des systèmes d’exécution de la production.
Les analytiques d’affaire libre-service (AALS) offrent la flexibilité requise pour unifier de telles données fragmentées avec des temps de cycle minimaux, ce qui en fait la classe de logiciel idéale pour les gestionnaires pilotant des projets d’opérations épurées en milieux manufacturiers. Les AALS peuvent permettre aux gestionnaires de concevoir et réajuster des métriques convenables tout au cours de la durée typique de trois à six mois d’un projet LSS. Le but principal de cette étude est de proposer un cadre pour l’implémentation d’AALS supportant les initiatives d’opérations épurées en milieux manufacturiers. Ce cadre de nature prescriptive est conçu pour guider les gestionnaires en ce qui a trait à maximiser les résultats et minimiser les délais – faire du projet un succès.
Pour atteindre ce but, une méthodologie de sciences de la conception impliquant une étude de cas industrielle est réalisée. En un premier temps, une revue de littérature systématique est exécutée, établissant une base pour la recherche et mettant en évidence les lacunes dans l’état de l’art. Puis, un modèle d’implémentation est conçu pour les AALS. Ce modèle est appliqué et évalué à l’usine partenaire, division canadienne d’une entreprise internationale fabriquant des pièces d’acier et disposant d’environ 15000 employés à travers le monde. Les leçons apprises sont ensuite étayées et intégrées pour produire un cadre d’implémentation généralisable appuyé par l’étude empirique en milieu manufacturier.
Les résultats quantitatifs du sondage d’évaluation sont supérieurs au seuil initialement défini. Des observations qualitatives en entreprise révèlent les impacts positifs de l’utilisation d’AALS supportant les opérations épurées dans les environnements manufacturiers – une communication interdépartementale accrue améliorant la prise de décision opérationnelle.
Mots-clés: Étude de cas, Conception de systèmes d’information, Analytiques d’affaire
Implementing Self-Service Business Analytics in Support of Lean Manufacturing Initiatives
Simon LIZOTTE-LATENDRESSE
ABSTRACT
Continuous improvement (CI) programs such as Lean Six Sigma (LSS) are the cornerstones of many high-performance corporate cultures. However, numerous obstacles can arise when comes the time to implement and sustain improvements – high failure rates are reported for CI programs. Leveraging existing information systems (IS) can be an obstacle for lean manufacturing initiatives in environments where data is fragmented across multiple databases of Enterprise Resource Planning (ERP) and Manufacturing Execution Systems (MES). Self-service business analytics (SSBA) provide the flexibility required to unify fragmented data with minimal turnaround, which makes this class of software ideal for managers piloting lean manufacturing initiatives. SSBA can enable the managers themselves to design and redesign suitable metrics throughout the typical three to six months duration of LSS projects. The main goal of this study is to propose an implementation framework for SSBA supporting lean manufacturing initiatives. This prescriptive framework is designed to guide managers in maximizing results and minimizing delays – making the project successful.
To achieve this goal, a Design Science Research (DSR) methodology involving an industrial case study is carried out. First, a systematic literature review is conducted, which establishes a research base and highlights research gaps. Then, an implementation workflow is designed for SSBA. Next, this workflow is applied and evaluated at the case company – the Canadian division of an international steel parts manufacturing company with about 15000 employees worldwide. Lessons learned are then outlined and integrated to yield a generalizable implementation framework backed by empirical evidence in manufacturing.
Quantitative evaluation survey results for the implementation case study were above the threshold set. Qualitative observations reveal positive impacts of SSBA supporting lean manufacturing through improved inter-departmental communication leading to better operational decision making.
Keywords: Case study, Information system design, Self-service business analytics,
TABLE OF CONTENTS
Page
INTRODUCTION ...1
CHAPTER 1 LITERATURE REVIEW ...5
1.1 Background ...5
1.2 Lean Six Sigma tools and techniques ...6
1.2.1 Gemba walk ... 6
1.2.2 Mind mapping ... 6
1.3 Theory of Constraints ...7
1.4 Sales and operations planning techniques and key metrics ...9
1.5 Stakeholder oriented change management & QFD ...9
CHAPTER 2 METHODOLOGY ...11
2.1 General research methodology ...11
2.2 Ethics assessment ...12
2.3 Industrial case study ...13
2.4 Evaluation methods ...13
CHAPTER 3 INTEGRATED ARTICLE: AN EMPIRICAL FRAMEWORK FOR IMPLEMENTING SELF-SERVICE BUSINESS ANALYTICS SUPPORTING LEAN MANUFACTURING ...15
Abstract ...15
3.1 Introduction ...16
3.2 Literature review ...19
3.2.1 Background ... 19
3.2.2 Critical factors of success for analytics in a lean context ... 23
3.2.3 Contextualization of shop floor data with ERP systems ... 24
3.2.4 An expert system to help prioritize work orders ... 26
3.2.5 Dashboards to help solving departmental KPI conflicts ... 27
3.2.6 Producing and presenting information systems research ... 28
3.3 Methodology ...29
3.4 Design of the artifact ...31
3.5 Case study of the artifact development ...32
3.5.1 Assess available information systems ... 32
3.5.2 Map current versus desired processes ... 32
3.5.3 Select SSBA software ... 34
3.5.4 Develop a change management plan... 35
3.5.5 Deploy SSBA and continuously improve ... 35
3.6 Evaluation of the artifact developed ...45
3.7 Lessons learned ...46
3.8 Artifact generalization ...48
3.9 Conclusion and future work ...49
3.9.2 Limitations and directions for future work ... 50
3.9.3 Managerial implications... 51
CHAPTER 4 DISCUSSION AND CONCLUSIONS ...53
4.1 Discussion ...53
4.2 Conclusions ...54
APPENDIX I EVALUATION SURVEY...57
APPENDIX II EVALUATION SURVEY RESULTS ...59
APPENDIX III CODE EXCERPTS ...61
APPENDIX IV CONFERENCE PAPER PRESENTED AT INCOM 2018 ...67
APPENDIX V INCOM 2018 POWERPOINT PRESENTATION WITH COMPANY ANONYMIZED ...75
APPENDIX VI APPROVAL FROM THE RESEARCH ETHICS COMMITEE ...93
APPENDIX VII PROOF OF SUBMISSION OF THE INTEGRATED ARTICLE ...95
LIST OF TABLES
Page Table 2.1 Research fitness for DSR; criteria adapted from Dresch
et al. (2015) ...12
Table 3.1 Systematic literature review summary ...21
Table 3.2 Evolution of requirements over the project duration ...37
LIST OF FIGURES
Page
Figure 1.1 High-level mind map for Lean Six Sigma techniques ...7
Figure 2.1 Thesis methodology, adapted from Dresch, Lacerda, and Antunes Jr (2015) ...11
Figure 3.1 Case company present state BPMN (Lizotte-Latendresse & Beauregard, 2018) ...17
Figure 3.2 Lead times whiteboard ...18
Figure 3.3 Case company desired state BPMN (Lizotte-Latendresse & Beauregard, 2018) ...19
Figure 3.4 Project management triangle (Project Management Institute Inc, 2013) ...22
Figure 3.5 BPMN for the Selvaraju and Peterson (2017) framework ...24
Figure 3.6 BPMN for the MOC from Unver (2012) ...25
Figure 3.7 BPMN for the expert system from Saha et al. (2016) ...26
Figure 3.8 BPMN for Urabe et al. (2016) PSI problem solving ...28
Figure 3.9 Lean manufacturing SSBA implementation workflow (Lizotte-Latendresse & Beauregard, 2018) ...33
Figure 3.10 Lean manufacturing SSBA implementation framework...33
Figure 3.11 Count of improvements to the SSBA tool over the duration of the project ...36
Figure 3.12a Production-side dashboard part 1 ...38
Figure 3.12b Production-side dashboard part 2 ...39
Figure 3.13 Add-in user interface for the sales-side dashboard ...40
Figure 3.14 Daily view per machine drill-down feature ...42
Figure 3.15 Dashboard physical deployment machines slide ...42
Figure 3.17 Dashboard physical deployment ready to ship slide ...44 Figure 3.18 Evaluation survey results ...46
LIST OF ABREVIATIONS
AATP Advanced Available-To-Promise BA Business Analytics
BPMN Business Process Modeling and Notation CNC Computer Numerical Control
COMS Customer Order Management System DAQ Data Acquisition
DBR Drum-Buffer-Rope
DSR Design Science Research ERP Enterprise Resource Planning IoT Internet of Things
IRL Integrated Risk Likelihood
IS Information Systems
IT Information Technology KPI Key Performance Indicator
LSS Lean Six Sigma
MES Manufacturing Execution System MOC Manufacturing Operations Cockpit MSFIS Mamdani Style Fuzzy Inference System OEE Overall Equipment Effectiveness
OFPPT Order Fulfillment Progress Projection Tool
PO Purchase Order
QFD Quality Function Deployment RMT Risk Mitigation Tool
RPA Robotic Process Automation S&OP Sales and Operations Planning SSBA Self-Service Business Analytics
TI Total Impact
ToC Theory of Constraints
TOPSIS Technique for Order of Preference by Similarity to Ideal Solution TPM Total Productive Maintenance
VBA Visual Basic for Applications WIP Work In Progress
INTRODUCTION
For manufacturing companies, developing and keeping a competitive edge has become more important than ever. In an increasingly global supply chain, pricing considerations for suppliers are often superseded by that of flexibility and dependability. Indeed, customers are now very much aware of the cost of holding inventory to compensate for a supplier’s low ability to react to fluctuating demand. As supply chains become leaner, push dynamics between various stages switch to pull, and the system becomes more vulnerable to effects such as bullwhip (Ivanov, 2018).
Information systems (IS) play a key role in enabling the improvements required upon manufacturing companies by this new reality of the market. The data stored in those can be leveraged to increase awareness of manufacturing capacity and demand, bolstering the all-important communication channels between sales and production. However, the information relevant to improvement projects can be fragmented between multiple databases of Enterprise Resource Planning (ERP) and Manufacturing Execution System (MES) implementations. The data wrangling required to turn this fragmented data into valuable information such as metrics has traditionally been time consuming for both managers and IT specialists (Lohr, 2014). This can limit the ability of IS to support lean manufacturing projects with fast-evolving requirements, particularly within the typical three to six months timeframe of a Lean Six Sigma project. Self-Service Business Analytics (SSBA) expand perspectives for managers through a new class of software able to connect to a wide range of IS to combine and process fragmented data into information with minimal turnaround. With SSBA, managers therefore benefit from increased flexibility to dynamically tailor suitable sets of metrics and tools in support of improvement initiatives.
Nevertheless, challenges arise from the implementation of SSBA to support improvement projects within a three to six months timeframe. While best practices are well documented for implementing IS such as ERP in manufacturing environments, SSBA implementations can be seen as a form of corporate entrepreneurship (intrapreneurship). As autonomy and
ambiguity tolerance are present to various degrees in companies, implementation strategies must account for cultural specificities. The SSBA implementation project can stall at different stages, for instance if no link can be established with existing IS.
The primary objective of this research is to propose manager-oriented guidelines for SSBA implementation in support of lean manufacturing. Those guidelines are designed to increase project quality for both SSBA implementation and the lean manufacturing improvement initiative it supports. The goal for this resulting project is to finish on time, on budget, and with the desired outcomes. This is measured through a satisfaction survey involving key stakeholders, as well as qualitative observations.
The methodology selected for this research is Design Science Research (DSR), as it is an answer to the dilemma between rigorous theoretical contributions and action research yielding industrial impacts. For this research, literature review findings are integrated in an implementation workflow – the first iteration of the DSR artifact. This workflow is then applied by developing an implementation for SSBA at the case company for which the core business is thermal cutting of sheet metal. This implementation is then evaluated, which leads to lessons learned. These lessons learned are used to improve the artifact, yielding a comprehensive framework – the second iteration of the artifact.
This thesis begins with a general literature review on the continuous improvement, operations & change management methodologies used in this research. An overview of the methodological approach follows. Then, the integrated article is detailed through the steps of the DSR methodology, yielding an implementation framework. This integrated article is an extension from the conference paper presented at the 2018 IFAC Symposium on Information Control Problems in Manufacturing (Lizotte-Latendresse & Beauregard, 2018). The extended article was submitted to the International Journal of Lean Six Sigma October 4th 2018; it was under review with no feedback which could be accounted for at the time of completion of this thesis. Lastly, results are discussed, and a general conclusion summarizes contributions of this research & key opportunities for future work.
3
Supporting materials are provided in appendixes: evaluation survey & results (see Table-A II-1), code excerpts, INCOM 2018 paper & presentation, ethics committee approval, and integrated article proof of submission.
CHAPTER 1 LITERATURE REVIEW
1.1 Background
Continuous improvement is an essential component of high-performing corporate cultures. Without it, organizational success eventually becomes solely dependent on the market’s reaction to companies’ offerings. Improving the offering itself in a mature market poses several challenges (Cooper, 2011), and several organizations which do not succeed with bold innovation reach a plateau and eventual decline after growth periods. While it is possible to reshape business processes – clear and out-of-the-box thinking yielding breakthroughs (Goldratt & Goldratt-Ashlag, 2010) –, quantum leaps can become increasingly harder to achieve as the low hanging apples become exhausted. To net a significant and sustainable impact on large organizations’ long-term performance, sparse improvement projects cannot be solely relied upon. That is where improvement programs such as Lean Six Sigma (LSS) come in. With such programs, business objectives set by top management are disaggregated into specific targets for incremental improvements throughout the organization. This collaborative process is known as Catchball (Sunder M, Ganesh, & Marathe, 2018).
Rigorous improvement methods are then leveraged to progress towards those targets and achieve durable results. There are however numerous obstacles to the sustainability of improvements, with reported failure rates of up to 60% (McLean & Antony, 2014) – project management and implementation approaches have been additionally been reported as recurrent themes for organizational failure. As the focus of this thesis is supporting LSS projects with IS, this literature review includes an overview of Gemba walks and mind mapping, two of the LSS techniques used in this research. Since the industrial implementation case relates to the Theory of Constraints (ToC), the concept will be introduced next. Then, sales and operations planning (S&OP) techniques and metrics will be outlined. Lastly, stakeholder-oriented change management will be presented as a building block of the framework developed, and linked to Quality Function Deployment (QFD).
1.2 Lean Six Sigma tools and techniques 1.2.1 Gemba walk
The concept of Gemba walk refers to the act of spending time on site with the stakeholders involved in the process to develop an understanding of its ramifications. Gemba is the Japanese word for “the actual place”, which is where the work is carried out (Tyagi, Choudhary, Cai, & Yang, 2015). There are limitations to the understanding of a process which can be developed without leaving a manager’s office, as can be depicted by this quote:
“The knowledge of the world is only to be acquired in the world, and not in the closet”
(Philip Chesterfield)
An important philosophy behind the Gemba walk is to look up to the people doing the actual work. Those people often have considerable experience in doing what they do; they are best placed to advise of subtleties in the process, and even opportunities for improvement. They may very well simply not have had the time or tools to implement those changes themselves. A Gemba walk can additionally give a good feel of the general climate in an industrial setting with factors such as cleanliness, which can modulate a change agent’s approach.
1.2.2 Mind mapping
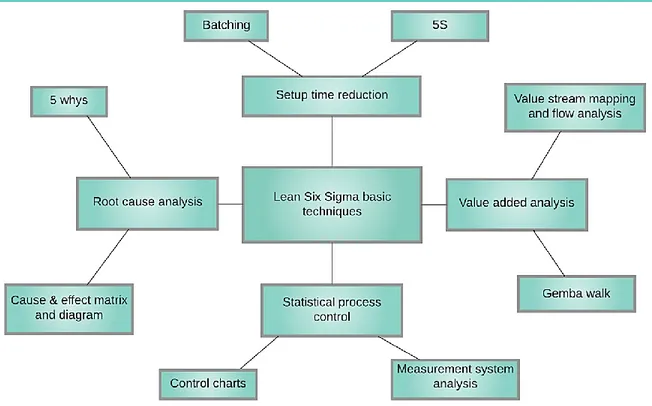
Mind mapping is a visual tool for brainstorming and problem solving. This representation was first promoted by Buzan (1976) and then Russell (1979) for its ability to boost creativity and learning, believed to stem from its stimulation of both the hemispheres of the brain – creative and logical. This tool differs from concept mapping (Novak & Gowin, 1984) in that there is necessarily a hierarchy of ideas, with one concept at the center and the others branching out. Keywords can be associated with the revolving concepts to further detail the mind map. As all the information radiates logically from the potentially complex central concept, its understanding is simplified.
7
This technique can be used as a LSS tool, for instance to brainstorm on opportunities for application of LSS method such as setup time reduction at a specific company. Areas where much time is wasted due to setup could be marked around the central concept of setup reduction, which could then lead to a Pareto analysis. An example of a mind map is shown at Figure 1.1; it integrates basic Lean Six Sigma techniques in a high-level representation.
Figure 1.1 High-level mind map for Lean Six Sigma techniques
1.3 Theory of Constraints
The ToC is an improvement methodology which was defined in The Goal by Goldratt and Cox (1984). It rests upon assumptions about what drives the long-standing profitability of a company – throughput accounting. While it was first coined for manufacturing, ToC has been successfully applied to other sectors such as service (Pacheco Lacerda, Augusto Cassel, & Henrique Rodrigues, 2010), healthcare (Garza-Reyes, Villarreal, Kumar, & Diaz-Ramirez, 2018; Taylor & Nayak, 2012), and even cloud storage (Chang, Chang, & Chang, 2017).
Key elements of this theory are core assumptions, the five focusing steps, and the Drum-Buffer-Rope (DBR) model – a simplified representation of effective production management. Assumptions include that profitability is highly correlated to the metrics of throughput (i.e. cash flow), inventory, and operational expenses. The five focusing steps are used to increase flow through the constraint (i.e. bottleneck) restricting throughput by subordinating considerations of lesser importance. The DBR model is of high relevance to this research, as the production capacity management system developed with SSBA for the case company is based upon this model.
In a DBR system, the drum is defined as the resource which is the most constrained in the system (Darlington, Francis, Found, & Thomas, 2015). In throughput accounting according to the ToC, the drum is effectively what restricts cash flow, limiting profitability. In the context of the case company for which the core business is cutting steel, the drum can be identified as the most loaded cutting line at a given moment. One option to reduce demand on the drum is to leverage redundant production line capabilities and spread the load. However, this strategy is only effective up to the point where all compatible lines have been overbooked, which is why sales have to be kept in the loop. That is where the rope comes in, which encompasses both direct sales-production communication and visual analytics. While there are challenging orders which command discussion between sales and production, it is with regular production that visual analytics can have the highest impact serving the purpose of rope. If peaks in capacity utilization are communicated, it is possible for sales to focus on under-utilized capacity – a pull dynamic is enacted. This dynamic helps to maintain a buffer, which is the safety margin to deliver orders to customers at the dates promised. This buffer is further secured through the integration of dynamic lead times communicated to sales. While simplicity is a good starting point with ToC, state-of-the-art algorithms such as advanced available-to-promise (AATP) algorithms can be leveraged to further secure the buffer based on stochastic simulations (Rabbani, Monshi, & Rafiei, 2014).
9
1.4 Sales and operations planning techniques and key metrics
S&OP is the process through which strategic objectives are linked to integrated plans for the sales and production departments (Thomé, Scavarda, Fernandez, & Scavarda, 2012). It is performed at least once a month with regard to both aggregated and long-term forecasts and shorter-term tactical plans – the associated hierarchical planning level can vary depending on the industry. The primary goal for this process is to ensure that there are sufficient resources allocated to the departments to support the company’s objectives. The process being integrated, alignment is ensured for the plans of the individual departments – imbalances can be detected and corrected at early stages.
The S&OP process can be supported by several metrics depending on the industry. Thomé et al. (2012) split those between six categories: plan, source, production, delivery, S&OP dashboard, and end-results. In a production system well modeled by DBR like the case company, the most relevant metrics are “capacity utilization”, “production lead-time”, “on-time delivery of goods”, and “adherence to sales, marketing and operations plan”.
By maximizing capacity utilization across the schedule, more can be produced with the initially allocated resources. This ensures that no capacity is wasted. Wasted capacity has the potential to cause unnecessary and costly overtime down the road during peak demand periods, as getting ahead of schedule increases the buffer to absorb peaks which would have otherwise required allocation of additional resources. This capacity utilization also has to be leveled, as utilization spikes increase the risk for late deliveries. The production lead time has a regulating effect on demand, and should therefore be neither too short or long to help with staying on track of the sales, marketing, & operations plans.
1.5 Stakeholder oriented change management & QFD
The stakeholder theory integrating all groups and interests impacted by activities was defined by Freeman (2010), originally in 1984. Application of this theory implies identifying key stakeholders, and analyzing their characteristics. Important characteristics for change
management include interest and influence; sorting stakeholders in a table and a quadrant can be particularly useful in some projects (Project Management Institute Inc, 2013). Additional factors include expectations, autonomy, and levers of power.
In the case of technology-driven change, the need to account for stakeholders is very high because of the potential for a disconnect between non-technical stakeholders and the design intent (Long & Spurlock, 2008). It is possible to go further than to simply account for or even involve stakeholders – a practice coined “stakeholder shaking” goes beyond this by enabling co-creation of solutions (Sulkowski, Edwards, & Freeman, 2017). For a manufacturing company, a good example of stakeholder shaking is communicating the impact of late deliveries on customer satisfaction. Even if some departments are affected more directly than others by customer dissatisfaction, increasing awareness of the systemic perspective can increase cooperation, in turn leading to ideas for improvement projects.
Stakeholder oriented change management relates to QFD defined in the ISO 16355 standard (International Standards Organization, 2015) in that the focus is working towards the benefit of the stakeholders. QFD emphasizes actively listening to the voice of stakeholders and includes Gemba visits to help in discovering unknown requirements. At the core of QFD is identification of requirements – which could be feature requests in the case of this study –, and prioritizing those requests to achieve maximum stakeholder satisfaction with the available resources. The ISO 16355 standard includes tools and techniques to aid stakeholder communications, requirements prioritization, scope delineation, and ultimately stakeholder satisfaction.
CHAPTER 2 METHODOLOGY 2.1 General research methodology
Since this research has the double aim of contributing to the body of knowledge of SSBA and improving the processes of an industrial partner through development of a SSBA tool, a practical research methodology is required. The selected methodology is DSR as represented in Figure 2.1, as this approach bridges the gap between theoretical and action research.
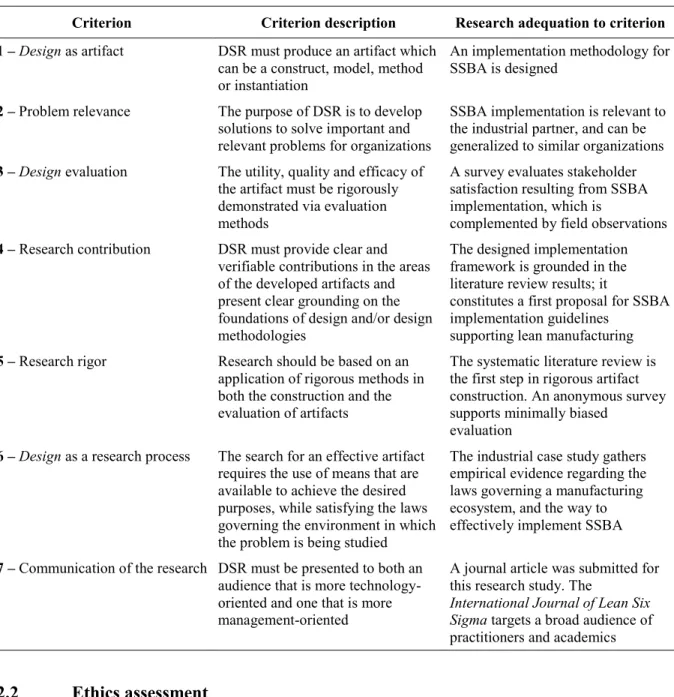
Fitness of the research project for the DSR methodology is detailed in Table 2.1. The general research methodology and its instantiation are further detailed in the integrated article sections 3.2.6 Producing and presenting information systems research and 3.3 Methodology.
Table 2.1 Research fitness for DSR; criteria adapted from Dresch et al. (2015)
Criterion Criterion description Research adequation to criterion 1 – Design as artifact DSR must produce an artifact which
can be a construct, model, method or instantiation
An implementation methodology for SSBA is designed
2 – Problem relevance The purpose of DSR is to develop solutions to solve important and relevant problems for organizations
SSBA implementation is relevant to the industrial partner, and can be generalized to similar organizations
3 – Design evaluation The utility, quality and efficacy of the artifact must be rigorously demonstrated via evaluation methods
A survey evaluates stakeholder satisfaction resulting from SSBA implementation, which is
complemented by field observations
4 – Research contribution DSR must provide clear and verifiable contributions in the areas of the developed artifacts and present clear grounding on the foundations of design and/or design methodologies
The designed implementation framework is grounded in the literature review results; it
constitutes a first proposal for SSBA implementation guidelines
supporting lean manufacturing
5 – Research rigor Research should be based on an application of rigorous methods in both the construction and the evaluation of artifacts
The systematic literature review is the first step in rigorous artifact construction. An anonymous survey supports minimally biased
evaluation
6 – Design as a research process The search for an effective artifact requires the use of means that are available to achieve the desired purposes, while satisfying the laws governing the environment in which the problem is being studied
The industrial case study gathers empirical evidence regarding the laws governing a manufacturing ecosystem, and the way to effectively implement SSBA
7 – Communication of the research DSR must be presented to both an
audience that is more technology-oriented and one that is more management-oriented
A journal article was submitted for this research study. The
International Journal of Lean Six Sigma targets a broad audience of
practitioners and academics
2.2 Ethics assessment
The research involves an industrial partner, which made ethics and confidentiality an important aspect. The case company has opted to remain anonymous. Managers were given
13
the opportunity to provide comments on manuscripts before those were submitted for publication. The evaluation survey was additionally designed to preserve the anonymity of the participants. Given those measures, ethics approval was obtained; this authorization is provided in APPENDIX VI.
2.3 Industrial case study
While the research & business problem definition was performed in collaboration with the industrial partner, the industrial case study is also very important to the research. It provides an opportunity to develop the artifact, and validate it empirically. The general workflow of the industrial case study is therefore the first iteration of the artifact, which is presented in Figure 3.9; it is grounded in the integrated article literature review at section 3.2.
The main steps of the industrial case study are therefore obtaining stakeholder support (executive, most importantly), assessing information systems, mapping processes, selecting SSBA software, developing a change management plan, deploying & continuously improving SSBA. The final stage of continuous improvement is iterative and incremental; it does not cease until empirical saturation is reached, meaning in this context that there are little new feature requests over time from stakeholders – a plateau is reached. This condition is not expected to be reached within the timeframe of this research, as it is geared towards LSS projects with a 3-6 months duration, hence the duration of the case study itself. There are countless new features which could be added to SSBA over time to better support the sales and production departments, but in this approach, feature requests must emerge from the stakeholders themselves to ensure that all those implemented add value. New feature requests are gathered via meetings and Gemba walks.
2.4 Evaluation methods
The evaluation approach selected is both quantitative and qualitative. A survey was designed to assess stakeholder satisfaction towards the tool based upon criterions from Hommes and Van Reijswoud (2000), which are further detailed in the integrated article section 3.3. This
survey is provided in APPENDIX I. It was disseminated via Google Forms to five employees from the sales and production departments, which is most of them – some were on vacation. Additionally, a data-logging feature was added in the SSBA implementation at the case company with the aim of supporting and assessing the impact of the SSBA tool on the manufacturing ecosystem; this production capacity management tool is shown in Figure 3.16, with the enabling VBA code provided in APPENDIX III. With this feature, it is possible to see if the calculated lead times are being respected to improve S&OP, and increase profitability as per the DBR model.
Qualitative observations complement quantitative evaluation methods. Indeed, LSS and QFD approaches both include Gemba visits or walks. This is because, while data-driven assessments are essential, those do not always tell the full story. Time is to be spent in the field with the sales and production departments to gather qualitative empirical evidence towards the industrial impacts of SSBA. The evaluation survey in APPENDIX I additionally includes a text field for anonymous feedback on the SSBA tool.
CHAPTER 3
INTEGRATED ARTICLE:
AN EMPIRICAL FRAMEWORK FOR IMPLEMENTING SELF-SERVICE BUSINESS ANALYTICS SUPPORTING LEAN MANUFACTURING
Simon Lizotte-Latendresse1, Yvan Beauregard1
1École de technologie supérieure, Department of mechanical engineering, 1100 rue Notre-Dame Ouest, Montréal, QC, Canada, H3C 1K3
This article was submitted to the
International Journal of Lean Six Sigma in October 2018 Abstract
Purpose – Managers driving lean initiatives in the manufacturing industry need to set up
metrics to support changes with limited time and resources. Relevant data is often fragmented across multiple information systems. Self-Service Business Analytics (SSBA) can be leveraged to convert this data into useful information. The aim of this paper is to develop an empirically supported framework to guide SSBA implementation within the typical 3 to 6 months timeframe of a Lean Six Sigma project.
Design/methodology/approach – The study as described in this paper adopts a Design
Science Research (DSR) methodology. A systematic literature review is conducted to identify gaps in current literature and establish a research base. Then, a workflow is designed to solve the implementation problem. This model then is applied at a case company for empirical evaluation. Lessons can then be learned from the case and integrated into a generalizable framework.
Findings – This paper identifies guidelines for successful SSBA implementation in the
manufacturing industry, which are synthetized in a framework. This framework stems from an implementation workflow and its evaluation in supporting the implementation of SSBA at the Canadian division of an international steel parts manufacturing company with about 15000 employees worldwide.
Originality/value – The main contribution of this paper is a framework designed to guide
managers in implementing SSBA to support fast evolving improvement initiatives in the manufacturing sector. Grounded in a theoretical research base and empirically validated, this framework bridges the gap between theory and practice as a first proposal for guidelines to implement SSBA supporting lean manufacturing.
Keywords Case study, Information system design, Self-service business analytics,
Implementation, Lean manufacturing, BPMN, Constructive Research
Paper type Research paper 3.1 Introduction
As the boundaries of inventory reduction are being pushed increase profitability, expectations towards suppliers are increased. It is not merely about pricing or even quality anymore, but also fast and reliable deliveries. While this wave of change can and must be a win-win situation for both suppliers and customers (Goldratt & Goldratt-Ashlag, 2010), it also brings about several challenges. A particularly important one for manufacturing companies is improving the ability to quickly react to fluctuating demand. This requires keen awareness of production capacity, as well as solid inter-departmental communication. Numerous information systems (IS) are available to assist production managers with these challenges for both the analytic and communication dimensions of planning. However, investing in powerful software does not guarantee the desired improvements. While several ERP systems and modules are marketed as polyvalent, implementation in specialized manufacturing environments will sometimes require compromise, even with subsequent investments. Managers navigating such environments to drive positive change – lean initiatives – must adapt to the IS landscape with limited time and resources.
With successful implementation, ERP neutral self-service tools can help managers bridge the gap between IS-native features and their lean manufacturing requirements. A literature review is conducted, which supports design of an implementation methodology for self-service business analytics (SSBA). The methodology is then applied to develop an
17
implementation of SSBA at a case company in the manufacturing industry. This development is then evaluated, and lessons learned enable incremental improvements on the implementation methodology itself.
Initial order management processes for the case company are represented at Figure 3.1 with the standardized approach of Business Process Model and Notation (BPMN) by the Object Management Group (2013). Lead times whiteboard (see Figure 3.2) & ad-hoc production impact assessments are central in the pre-SSBA workflow.
Figure 3.1 Case company present state BPMN (Lizotte-Latendresse & Beauregard, 2018)
For the case manufacturing plant, the core business is thermal cutting of parts out of sheet metal, with plasma for fast cuts and oxyfuel for thick material. Plasma melts steel with an electrical arc, and oxyfuel is propane burned with oxygen. While the decades old company has as much as 15000 employees worldwide, the plant studied has 50-100 employees. From an IT perspective, SAP Business One (B1) enhanced by the BX Manufacturing module is
adopted as corporate ERP, while the SigmaNEST software package is leveraged to program CNC plate processing machines. From a supply chain perspective, it should be noted that this plant also manufactures welded assemblies, and that a portion of orders require outside processing for operations such as bending or machining. Lean manufacturing projects impacted by the developed SSBA information system include improving lead time estimation with live update, increasing plasma/oxyfuel cutting torch time percentages by showing sales under-utilized machine capacity, and maximizing on-time delivery by detecting at risk orders. Figure 3.3 represents SSBA integration with the whiteboard superseded.
This paper begins with a presentation of the background in the fields of business analytics and lean manufacturing. Then, selected state-of-the-art literature is further detailed. Next, the selected Design Science Research (DSR) methodology is presented. An implementation workflow can then be designed, which is the initial methodological artifact in this DSR study. Application of the implementation workflow at the case company for development of an implementation of SSBA is subsequently documented and evaluated. Lessons learned from this development enable incremental improvements upon the initial artifact, and confer it a degree of generalizability. A key contribution of this paper is the resulting artifact – a prescriptive framework applicable to the SSBA implementation class of problems –, which fills a gap identified in current literature (Lizotte-Latendresse & Beauregard, 2018). As a result, conclusions can be drawn regarding both academic and managerial implications.
19
This research is an extension from the conference paper presented by the authors at the 2018 IFAC Symposium on Information Control Problems in Manufacturing (Lizotte-Latendresse & Beauregard, 2018).
Figure 3.3 Case company desired state BPMN (Lizotte-Latendresse & Beauregard, 2018)
3.2 Literature review 3.2.1 Background
A fundamental principle in Lean is that we need to measure if we are to improve. The more mature the lean organization, the harder the bottlenecks are to find and improve (Sims & Wan, 2017), and doing so will more often than not require gathering data. As in any science, data quality must be considered – cleansing big data is a major challenge today’s organizations face (Sadiq, 2013). Robotic process automation (RPA) tools such as Blue
Prism can improve the flow of data (Forrester Research, 2018). Still, data by itself is not enough to drive improvement, as it needs significance before it can be translated into accurate and timely control decisions (G. Meyer, Buijs, B. Szirbik, & Wortmann, 2014). Business Analytics (BA) address turning valid data into valuable insight for managers (Unver, 2012); this discipline adds the past and future dimensions (Calfa, Agarwal, Bury, Wassick, & Grossmann, 2015) to Business Intelligence (BI), which tracks real-time status (Unver, 2012).
The impact of Lean management initiatives (e.g. standard work) on key performance indicators (KPI) such as Overall Equipment Effectiveness (OEE) can then be tracked (Unver, 2012). With recent advances in the internet of things (IoT) yielding tools such as Worximity (2017), data acquisition (DAQ) can be performed from virtually any industrial equipment. Still, care must be taken to avoid pitfalls in defining KPIs, for instance setting the bar too low to make ourselves look good (Hammer, Haney, Wester, Ciccone, & Gaffney, 2007).
On the other hand, analytic tools such as Bayesian networks can assist decision makers by effectively processing highly complex datasets to forecast Engineer-to-Order (ETO) project workloads (Eickemeyer, Herde, Irudayaraj, & Nyhuis, 2014), helping reduce bottom-line uncertainty (Kogan & Tell, 2009). Analytics can also interface with Enterprise Resources Planning (ERP) systems, modulating sales-production interactions, which in turn correlate with higher customer satisfaction (de Vries & Boonstra, 2012; Parente, Pegels, & Suresh, 2002), all the while enabling dynamic pricing strategies (Özer & Uncu, 2015).
A new, disruptive trend in BA is self-service. Over the last decade, an increasing number of companies have opted for software such as Tableau, Microsoft Power BI, and IBM Watson Analytics (Alpar & Schulz, 2016; Dinsmore, 2016). Microsoft is positioned to the furthest for Completeness of Vision in the Leaders quadrant in the Gartner (2018a) Magic Quadrant for Analytics and Business Intelligence Platforms. Although having different feature sets when compared to leading data science and machine-learning platforms like RapidMiner (Gartner, 2018b), these tools target end users instead of experts (Dinsmore, 2016).
21
As a result of the shorter design cycles these decision support tools facilitate, time-sensitive decision making can be improved (Mayer, Hartwig, Roeder, & Quick, 2015). Managers quickly get actionable intel – the edge to effectively adapt in fast-changing environments (Balogun & Tetteh, 2014; Monostori et al., 2015). Visual analytics can now be updated real-time (Selvaraju & Peterson, 2017), and multi-database query mashups modified in a few clicks – minimal “data-wrangling” (Lohr, 2014) is required. Another benefit of SSBA is it requires managers to frame their requirements. Traditionally, resorting to Business Intelligence specialists without sufficient attention to requirements engineering (RE) could induce delays of weeks (Dinsmore, 2016), impacting long-term usability in notorious cases (Schlesinger & Rahman, 2016). Self-service attempts – even failed – can help mitigate such risks, as requirements are better framed should there be need for experts.
Table 3.1 Systematic literature review summary a
OR
AND
Framework Model Procedure Process Implement* Implant* Deploy* Operationaliz*
OR AND Self-serv* End-user Business Intel* OR BI Business Anal* OR BA Manufact* Intel* OR MI Decision Support OR DS
SSBI SSBA MIS DSIS
Support* For Sustain* Enabl*
Lean b
a. Strategy executed 02/10/18 in Scopus, Engineering Village, and Web of Science
b. The only hit is Lizotte-Latendresse and Beauregard (2018) if the “Lean” keyword is included
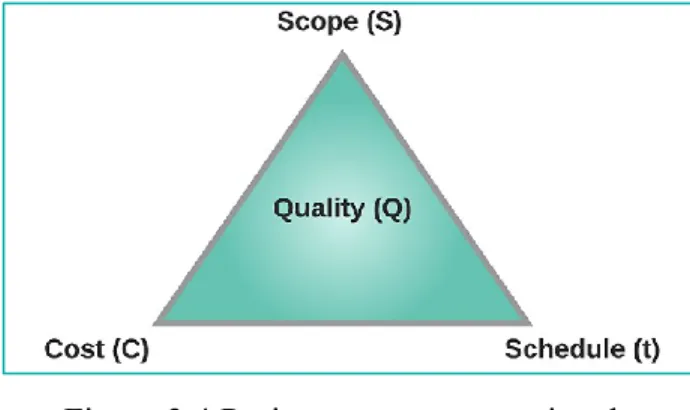
There is limited research on the relatively new topic of SSBA, particularly regarding the implementation dimension. In fact, the only two relevant hits in our systematic literature review at Table 3.1. (Olavson & Fry, 2008; Schuff, Corral, St. Louis, & Schymik, 2016) are not directly related to manufacturing. Since end-user software is involved, some improvisation is expected, which may explain in part why such implementations have been scarcely documented. This appears particularly true for the case of make-to-order (MTO) dominant manufacturing sites, where weak matrix project management support structures are frequent (Project Management Institute Inc, 2013). Nevertheless, a need is to be addressed
for implementation guidelines to maximize results and minimize delays with respect to the project manager’s triple constraint (see Figure 3.4).
Figure 3.4 Project management triangle (Project Management Institute Inc, 2013)
While project management best practices drive project team overall effectiveness to implement traditional ERP systems in manufacturing environments (Boykin, 2014), overemphasis on traditional project planning techniques may actually burden SSBA implementations. This is analogous to the plan-centric and agile approach dichotomy in software development (van Waardenburg & van Vliet, 2013). Some implementations of SSBA can also be seen as form of corporate entrepreneurship (intrapreneurship) initiative, for which autonomy and organizational ambiguity tolerance are key enablers – maturity factors (Elia, Margherita, & Petti, 2016). Furthermore, corporate culture factors such as workplace attitude and commitment should be taken into account in the implementation strategy, as they bear strong influence on long-term sustainability (Glover, Farris, Van Aken, & Doolen, 2011). Guidelines such as the MIT Lean Enterprise Self-Assessment Tool (LESAT) enable characterization of current versus desired states, as well as a Lean transformation roadmap (Lean Advancement Initiative, 2012).
Our contribution to the BA body of knowledge is through development of a methodology to implement SSBA in lean manufacturing environments with regard to current IS, sales and operations planning (S&OP), and workplace culture – the systemic perspective. This state-of-the-art review constitutes the foundations for the framework designed and developed through the Design Science Research methodology (Dresch et al., 2015). This framework is
23
incrementally improved with lessons learned throughout SSBA implementation in the steel industry.
Related state-of-the-art literature addresses several problems associated with design and implementation of intelligent systems supporting lean improvement programs in multiple industries. Selvaraju and Peterson (2017) present critical socio-technical factors of success for analytics in a lean context. Unver (2012) introduces a manufacturing intelligence (MI) system assisting lean continuous improvement by contextualizing shop floor data. Saha, Aqlan, Lam, and Boldrin (2016) develop an expert system to help prioritize customer orders. Urabe, Shuangquan, and Munakata (2016) attempt to solve KPI conflicts between sales and production by means of better communication with the help of an inter-departmental cockpit – improved S&OP. Dresch et al. (2015) produce a comprehensive guide to Design Science Research (DSR) in management and engineering, effectively synthetizing key advances such as those from Peffers et al. (2006) in information systems (IS) research.
3.2.2 Critical factors of success for analytics in a lean context
The first step in Selvaraju and Peterson’s research is developing a framework to assess the organization’s maturity for technology-supported Lean (Selvaraju & Peterson, 2017). A second goal of the authors is defining technology-supported business problem solving best practices. Thirdly, the authors wish to use analytics to monitor the lean transformation, as well as technology adoption rates. The framework aligns with Balanced Scorecard metrics: “Customer value, Financial excellence, Culture growth, and process excellence” (Selvaraju & Peterson, 2017).
The developed methodological artifact is based on existing state of the art models. First of all, an Organizational Culture Inventory (Human Synergistics International) is employed to characterize the organization’s culture for key behavioral styles such as Constructive or Passive/Defensive. Secondly, this analysis is combined with a lean technology and process maturity assessment. The technology and process assessments are out of the article’s scope.
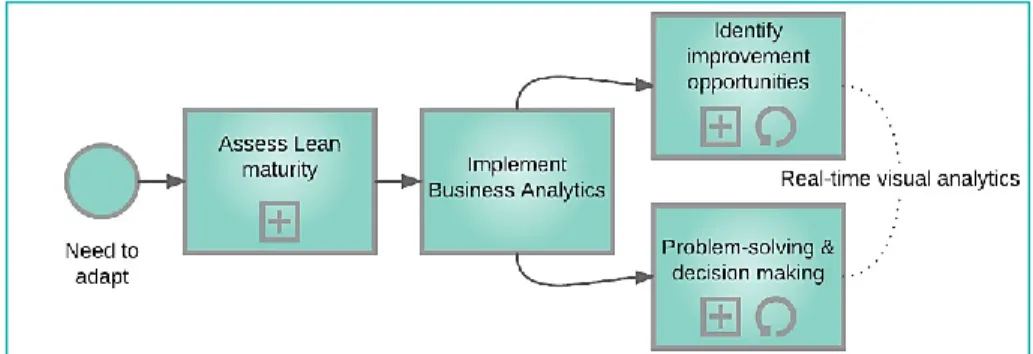
Then, BA are integrated in a decision-making methodology throughout the lean transformation. Here, BA enable managers to quickly identify improvement opportunities from dynamic performance measurements. The visual analytics process feedback loop enables continuous improvement of problem solving and decision-making processes (see Figure 3.5).
Figure 3.5 BPMN for the Selvaraju and Peterson (2017) framework
Application of this methodology yields an “Information Delivery Management Tool”. The resulting dashboard-based application is designed to gauge the effectiveness of organizational lean measures. The dashboard is deployed online with the help of IBM supply chain manufacturing. Selvaraju and Peterson (2017) conclude that the framework has been successfully validated for implementation in a complex manufacturing environment. Authors foresee application of the framework to other fields.
3.2.3 Contextualization of shop floor data with ERP systems
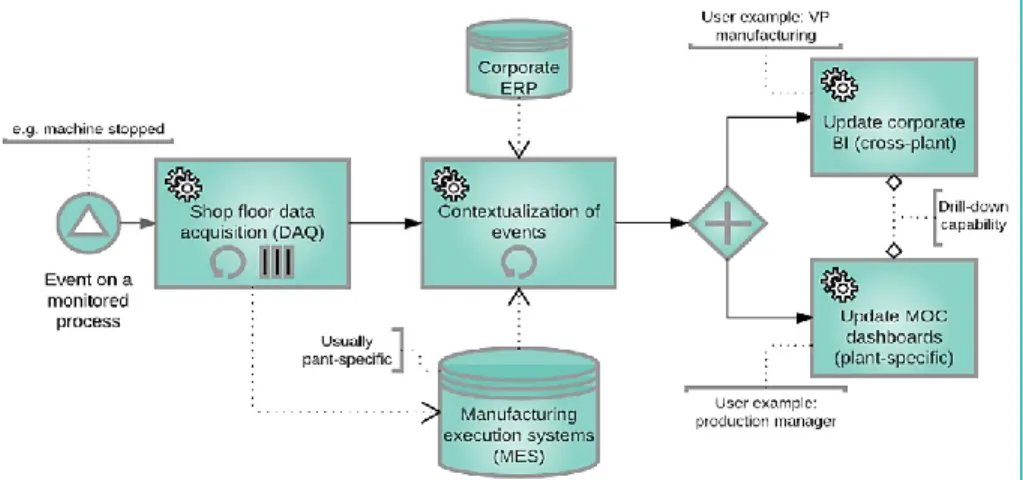
Unver (2012) aims to develop a framework for BA in the form of a manufacturing operations center (MOC) following guidelines of the International Society of Automation’s ISA-95 standard. Another requirement for the framework is to support implementation of the Lean philosophy, namely measures such as total productive maintenance (TPM) (Unver, 2012). As a major improvement over current tools and techniques, the author wishes to address the disconnection problem between shop floor systems and corporate-level ERP.
25
The author’s methodological approach is mainly one of software architecture. He is part of a team of developers at Oracle. The software architecture team starts by assessing the shortcomings of current ERP-integrated production support systems. Design requirements are outlined; for instance, the possibility for the system to bring relevant KPIs to both plant managers and cross-plant vice-presidents. An ERP-agnostic concept is then developed with numerous industry partners to support shop floor integration. The neutral design, bound by the ISA-95 standard, is meant to be sufficiently generic to harness components from various industries. Two use cases are presented, which are examples of lean transformations where the software helps.
Figure 3.6 BPMN for the MOC from Unver (2012)
Unver’s research yields a MOC (see Figure 3.6) which works by converting real-time data from shop floor equipment into business events, aggregating these events with context data acquired from ERP systems, and then generating relevant KPIs. A cornerstone of the system is hierarchical drill-down capability, which enables corporate-level managers to investigate otherwise superficial plant KPI components – disaggregate performance metrics down to problematic machine shifts to outline possible root causes. Use cases include TPM (i.e. OEE), as well as live production line status dashboards to improve incident response delays. The Oracle MOC offering is Oracle BI Enterprise Edition (OBIEE). Future work includes adding other important metrics such as work in progress (WIP) and manufacturing lead times.
3.2.4 An expert system to help prioritize work orders
Saha et al. (2016) endeavor developing an End-to-End (E2E) Customer Order Management System (COMS) composed of three integrated tools and a real-time dashboard. The problem researchers mean to tackle is quantification of strategic and operational impacts of expert system assisted order prioritization decisions. Authors wish to assist the prioritization decisions, but also track order progression and late delivery risk.
The methodological approach employed by Saha et al. starts by a characterization of the system for which a COMS will be developed, and performing a diagnosis of areas where decision support is most needed. A set of assumptions is derived from the supply chain assessment, and the three-module decision support system is designed. The order prioritization tool relies on the Technique for Order of Preference by Similarity to Ideal Solution (TOPSIS) as a multi-criteria decision-making model. Then, an order fulfillment progress projection tool (OFPPT) is developed. It utilizes a Mamdani Style Fuzzy Inference System (MSFIS) to simulate subject matter expert (SME) judgement. Finally, a risk mitigation tool (RMT) is developed to draw a risk criticality matrix by aggregation of order parameters and context into the Integrated Risk Likelihood (IRL) and Total Impact (TI) variables. Interactions between these systems and work in progress (WIP) are represented in Figure 3.7.
27
Evaluation of the system is possible with an application at a server manufacturer in combination with criterions derived from Hommes and Van Reijswoud (2000): expressiveness, effectiveness, suitability, comprehensibility, coherence, completeness, and efficiency. An order management dashboard is implemented. The system performs well with regard to the evaluation criterions (Saha et al., 2016). The RMT could be improved by incorporating very low likelihood yet massive impact risks like terrorism.
3.2.5 Dashboards to help solving departmental KPI conflicts
Urabe et al. (2016) wish to address the problem where some departments will jeopardize other departments KPI to maximize their own. Low synergy and chronic finger-pointing are ultimately detrimental to the company’s bottom line. The authors wish to develop a strategy to better manage this issue, and then implement it through an automated tool.
From a methodological standpoint, authors start by highlighting the issues with traditional methods for supply-demand planning. KPI conflict patterns are outlined. Then, a visualization system is developed to provide a communication-based solution.
In their diagnostic, authors emphasize a recurring KPI conflict pattern: if sales focus on fast-selling products to catch up on their KPI goals rather than to try fast-selling overstocked items, not only will the overstock be detrimental to supply chain management (SCM), which is penalized by excess inventory, but the sales surge will also force the production department to utilize more resources than initially allocated to maintain on-time delivery rates. This is the production sales and inventory (PSI) problem. A communication-based strategy is then prescribed to help overcome the issue. It integrates the three departments affected by the diagnosed pattern: production, sales, and SCM. Where PSI problem-solving used to be done by individual departments – often neglecting the systemic perspective –, it should now be accomplished through inter-departmental cooperation. To implement a PSI-Cockpit supporting this strategy, two main features are selected: drill-down and alert. Drill-down enables involved departments to quickly identify item-level parameters which cause KPI
conflicts, modify these in a tabular interface, all the while simulating the impact on KPIs real-time. The alert feature displays a notification when a departmental KPI reaches a critical threshold. Problem solving following an alert is performed through what-if analysis with the simulation feature (see Figure 3.8). The simulation feature can be seen as a digital twin, as changes made are only theoretical until those have been applied. Future research will evaluate the impact of this tool on the manufacturing ecosystem.
Figure 3.8 BPMN for Urabe et al. (2016) PSI problem solving
3.2.6 Producing and presenting information systems research
Dresch et al. (2015) perceive a lack of systematization and consolidation of the concepts of DSR in current literature, particularly for application in management and engineering. To address this, authors wish to contextualize the foundations of Design Science, DSR, and synthetize a method for DSR.
The authors build upon pioneering work from Peffers et al. (2006) for DSR adapted to IS. Peffers et al. addressed a shortcoming in DSR (Dresch et al., 2015) methodological guidelines as to application to information systems research. Although DSR had existed for over a decade, very little research had been published following this method which effectively bridges the gap between rigorous research and prescriptive applications. Indeed, action research and case studies seldom focus on rigorous science fundamentals such as experimental repeatability and hypothesis falsifiability. Emphasis is put on designing
29
artifacts which are consistent with current literature, and building upon those to expand the body of knowledge. The process is iterative in its nature, as initial requirements only lead to a proposal for a solution and the formalization of construction heuristics. It is through iterative simulation and evaluation that construction and contingency heuristics can be refined to clearly define a satisfactory artifact and its limitations.
Design Science research in IS involves (Peffers et al., 2006):
Identifying the problem and the research motivation, and defining objectives for a solution;
Designing and developing an artifact;
Demonstrating effectiveness of the artifact in problem-solving along with thorough evaluation, documenting lessons learned from the demonstration, and
Communicating results.
As the development of DSR guidelines was done following the DSR methodology, the author’s recommendations will be validated by upcoming Design Science Research papers which are successful with application of the methodology.
3.3 Methodology
The design science research methodology is selected for this research. As summarized in the literature review, this methodology structures rigorous practical research. The methodology is a good fit for information systems design, where it has been successfully applied (G. Meyer et al., 2014). DSR aims to design and recommend, while the general scope of pure case studies and action research would be to explore, describe, explain, and predict (Dresch et al., 2015). The key steps are literature review, artifact design, artifact development, artifact evaluation, clarification of learning achieved, generalization to a class of problems, and conclusion.
A systematic literature review was conducted. This literature review is then leveraged for design of the artifact, which in this case is an implementation methodology for SSBA. It is the step where construction heuristics are defined. While the artifact design itself is a largely abductive process, as it stems from creativity guided by state-of-the-art practices, the subsequent steps add scientific value to it – application makes it possible to gather empirical evidence. Artifact development is the phase where the construction heuristics are applied. In this research, it is the phase where the SSBA is implemented in an industrial setting.
This development is then documented, and empirically evaluated. In this research, empirical evaluation is achieved through a survey disseminated in both the sales and production departments. The survey is distributed electronically with Google Forms. It is based on the evaluation criterions used by Saha et al. (2016), originally developed by Hommes and Van Reijswoud (2000): expressiveness, effectiveness, suitability, comprehensibility, coherence, completeness, and efficiency. For combined departments, an average score of 4 out of a maximum of 5 for those criterions is set as the threshold for satisfactory implementation. An opportunity is also given for anonymous commentaries through the survey form. Field observations of the impacts of the tool on the manufacturing ecosystem are also reported.
The next step is outlining lessons learned. This clarifies the learning achieved in the artifact development and validation steps. In this phase, the goal is to reflect on the strengths and weaknesses of the artifact in its current state. It makes a feedback loop possible towards the artifact design stage. Lessons can be learned from the industrial implementation case documented through the steps of the designed implementation methodology. The dual purposes for studying the case are thus to evaluate the construction heuristics used to develop the SSBA tool, and also evaluate the fitness for use of the tool itself. The goal of this research is to develop a prescriptive framework applicable to the SSBA implementation class of organizational problems. Recommendations are to be formulated for conducting the identified key steps of the implementation: IS assessment, process mapping, software selection, change management, SSBA deployment and continuous improvement.
31
From the scope of the artifact development, it is then possible to generalize the methodological artifact improved by the lessons learned to a class of problems, which is the goal of this research.
3.4 Design of the artifact
Key SSBA architecture findings can be summarized:
The Hierarchical drill-down capability can facilitate PSI problem investigations, S&OP, and helps scalability;
An alert feature can be integrated in order to notify stakeholders that a problem is to be addressed, especially in cases where timely action is needed;
Simulation can improve the decision-making process. Predictive analytics leveraging statistics or machine learning can ultimately help modulate KPI outcomes with improved operational decision-making;
Tracked KPIs must be chosen carefully, as people will attempt to improve those if they are compensated to do so, even if the outcome is unproductive.
Implementation methodology has additionally been reviewed. Assuming sufficient stakeholder strategic involvement, best practices are split between the phases of planning and execution in the MIT LESAT. Best practice highlights as to planning are the following:
Assess available information systems, data accessibility;
Determine areas of possible improvement in current processes, preferably with a structured approach such as process mapping. Establish current versus desired; Evaluate data quality, for instance the standard times used to estimate production
throughput;
Adapt to corporate culture factors such as openness to change and inter-departmental power dynamics.
The mental model presented in Figure 3.9 integrates these literature review findings into a high-level implementation workflow – the first iteration of the artifact. The SSBA
implementation framework presented at Figure 3.10 is the second iteration of this artifact; it integrates lessons learned throughout SSBA implementation at the case company.
3.5 Case study of the artifact development 3.5.1 Assess available information systems
Assessment of the available information systems with the partner company was not a structured process. No need for a standardized assessment such as object-oriented analysis with data flow diagram (Repa, 2013) was established, since it was clear which program fulfilled the role of MES and which one fulfilled the role of ERP. The MES database structure could be understood by inspection with the database management program bundled with it, and a connection was established. Stakeholder support was required to acquire a connection file for the ERP SQL database.
3.5.2 Map current versus desired processes
By walking the process through a “Gemba walk” (Camuffo & Gerli, 2018), an understanding of the general workflow was developed. The standardized notation of BPMN was then used to represent the different steps of the process. This mapping was then validated with the people involved in the process.
33
Figure 3.9 Lean manufacturing SSBA implementation workflow (Lizotte-Latendresse & Beauregard, 2018)