HAL Id: hal-00728567
https://hal.archives-ouvertes.fr/hal-00728567
Submitted on 30 Aug 2012
HAL is a multi-disciplinary open access
archive for the deposit and dissemination of
sci-entific research documents, whether they are
pub-lished or not. The documents may come from
teaching and research institutions in France or
abroad, or from public or private research centers.
L’archive ouverte pluridisciplinaire HAL, est
destinée au dépôt et à la diffusion de documents
scientifiques de niveau recherche, publiés ou non,
émanant des établissements d’enseignement et de
recherche français ou étrangers, des laboratoires
publics ou privés.
FROM VALUE CHAINS TO VALUE NETWORKS:
MODELING AND SIMULATION
Joanna Daaboul, Pierre Castagna, Alain Bernard
To cite this version:
Joanna Daaboul, Pierre Castagna, Alain Bernard. FROM VALUE CHAINS TO VALUE
NET-WORKS: MODELING AND SIMULATION. 9th International Conference on Modeling, Optimization
& SIMulation, Jun 2012, Bordeaux, France. �hal-00728567�
“Performance, interoperability and safety for sustainable development”
FROM VALUE CHAINS TO VALUE NETWORKS: MODELING AND
SIMULATION
J. DAABOUL, P. Castagna IRCCyN / Ecole Centrale Nantes
1, rue de la Noë, B.P. 92101 44321 Nantes Cedex 3 - France joanna.daaboul@irccyn.ec-nantes.fr,
Pierre.Castagna@Univ-Nantes.fr
A. Bernard
IRCCyN / Ecole Centrale Nantes 1, rue de la Noë, B.P. 92101 44321 Nantes Cedex 3 - France alain.bernard@ irccyn.ec-nantes.fr
ABSTRACT: The competition today is between networks of interconnected organizations. Enterprises need tools and
methods to model and analyse these networks in order to aid them in strategic decision making. And current existing models such as the value chain are not sufficient to interpret a network. In this article we propose a method and a tool to model simulate and analyse a value network as a decision aid system. Our method is based on the SimulValor approach and we use a discrete event simulation tool “Rockwell-ARENA”. We also present in this article a case study in the shoemaking industry in order to validate our approach.
KEYWORDS: Value Network, Value, Enterprise Modeling, Performance, Strategic decision
1 INTRODUCTION
The competition today is not between individual compa-nies but between networks of interconnected organiza-tions (Peppard & Rylander, 2006). The performance of one enterprise is influenced by the performance and be-havior of all its partners (suppliers, stakeholders, distrib-utors, retailers, and customers). Thus nowadays the man-agement of one enterprise and the decision making should be done by taking into consideration all these partners.
The model of value chain that consists of all the value-generating activities (Porter, 1985) is not enough today to aid in the decision making in an extended enterprise, whereas the model of value network does. A value net-work is a set of partners collaborating together to create value (Elhamdi, 2005). It is a model of transformation of values within an enterprise. These generated values re-late to the company itself but also to other partners (Elhamdi, 2005). The network model is based on the value while the chain model is based on the activity (Elhamdi, 2005).
The value chain model has several limitations. First, the notion of value is limited to the financial dimension where business value is equal to the turnover of which the costs of activities are deducted. Second, the activities of the value chain are structured sequentially and order-ly. This structure, according to (Galanos, 1998), is due to the general economic model of reference of the value chain. Finally, interactions between different activities and the effect of these interactions on the value generat-ed are not considergenerat-ed because of the unidirectional linear
approach of the value chain. Moreover, this linear ap-proach does not incorporate feedback that results from the interaction of the value chain with external parties (Elhamdi, 2005).
(Peppard & Rylander, 2006) explain that the concept of a value chain was the dominant concept in the analysis of strategic industries. However, the value chain is based on a particular logic of value creation. Adopting a network model offers a different perspective which is more adapted to the new organizations.
As products and services became dematerialized and as the value chain itself has not necessarily a physical di-mension, the concept of value chain is an inappropriate tool to analyze many industries today and discover the value sources (Normann & Ramirez, 1994; Parolini, 1999; Tapscott et al. 2000; Hakansson & Snehota, 1989; Campbell & Wilson, 1996). This is also true since busi-ness connections play an important role in the strategic performance (Madhavan et al., 1998).
By adopting a network approach, organizations do not focus on one company, but on the system of value crea-tion in which different economic actors (suppliers, part-ners, customers ...) are working together to co-produce value. Nevertheless, new tools and methods are needed to model and analyze a value network. In this article we propose a modeling tool to analyze the performance of a value network in order to aid a company make strategic decisions. In the first section we review related works in modeling languages. In the second section we describe our approach and the modeling and simulation tool. Fi-nally in the fourth section we present a case study in the shoemaking industry.
MOSIM’12 - June 06-08, 2012 - Bordeaux - France
2 RELATED WORKS: VALUE NETWORKS MODELS
Several modeling approaches focusing on the value net-work have been proposed, such as the e3-value modeling framework, the c3-value modeling framework, the Allee’ modeling framework, and SimulValor. In the following, we describe each of these approaches.
2.1 e3-value modeling
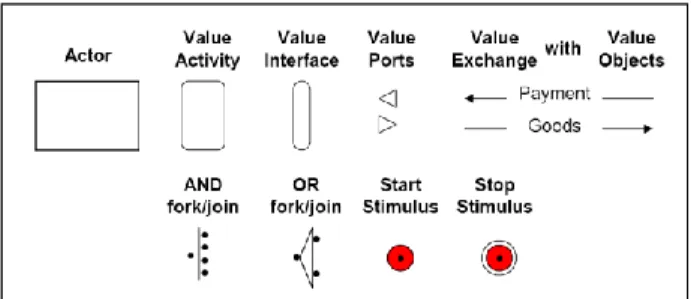
The e3-Value main focus is on identifying and analyzing how value is created, exchanged and consumed within a multi-actor network (Gordijn and Akkermans, 2003). The e3-value core elements which are presented in figure 1 are the following:
An Actor is an economically independent entity rep-resenting a company, an organization, or a customer.
A Value object represents what is being exchanged between actors.
A Value Port is the medium allowing the exchange; it is a connection point between the Actor and the out-side word. It could be a service, good or money that has an economic value to at least one the Actor.
A Value Interface is a group of value ports.
A value activity is performed by an actor motivated by a potential profit.
A Market Segment is a clustering of actors that as-sign economic value to object equally (Gordijn et al., 2000).
Figure : Elements of e3-value (Huemer et al., 2008) 2.2 c3-value modeling framework
The c3-value modeling scheme is an extension of the e3-value model developed to cope with its limitations (Weigand et al., 2007). Geared towards strategic analysis, it focuses on three dimensions: competition analysis, customer analysis and capability analysis (Weigand et al., 2007).
2.3 Allee’s modeling framework
This framework considers a value network as a continu-ously changing system that reproduces itself (Allee, 2002). The entities of Allee’ model are:
Participant representing an individual or group of people.
Transactions referring to a transfer of a deliverable from one participant to another. Transactions are con-sidered unidirectional
Exchange which is a bi-directional transaction. Ex-changes are drivers of value.
Deliverables that can be tangible such as good, ser-vices, and revenue, or intangible such as knowledge and benefit.
2.4 SimulValor
SimulValor is a value network modeling approach for strategic decision making which is based on system dy-namics (SD) (Elhamdi, 2005). It focuses on the generat-ed value and on the influences of the performance of the different partners on this value. Thus it manipulates quantitative and qualitative variables through their influ-ence on the performance of a certain activity. It measures the impact of a strategic alternative decision on the en-terprise’s generated value. In addition, the causal/effects relationships between variables are also influenced by certain delays of the influence of one variable on another or on an activity.
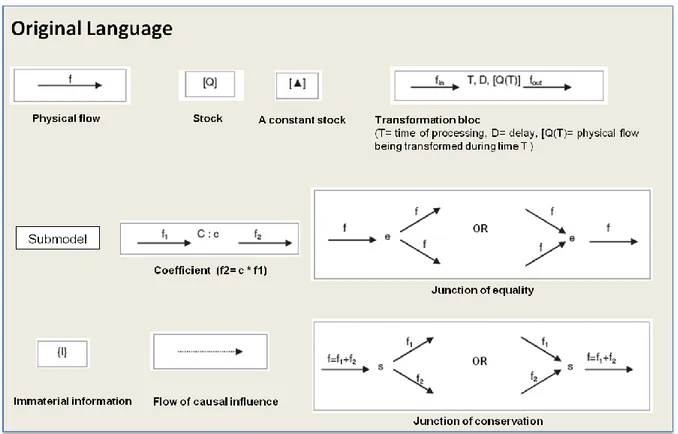
SimulValor allows the modeling of physical and infor-mation flows in one graph. Nevertheless there are no negative flows, meaning that there is one direction of material transformation. A flow’s value can be either positive or zero if the stock of which it is generated is empty. Also, it allows a hierarchal modeling by the pos-sibility of using submodels. Figure 2 presents the SimulValor modeling language which includes the fol-lowing:
Physical flow which designates the circulation of en-tities of type material (material, orders, time, costs ...).
Stock that represents an accumulation of a number of entities of type material.
Transformation block which represents an activity
Coefficient that represents a relation between the val-ues of two flows
Junction of equality which imposes the value of an input flow to a set of outflows, or the value of an out-flow to a set of input out-flows
Junction of conservation which imposes a relation-ship of equality between the value of an incoming flow and the sum of values of a set of outgoing flows, or between the value of an outgoing flow and the sum of values of a set of incoming flows
Flow of causal influence that indicates a direct causal influence between two variables
Immaterial information which intervenes in the causal structure of the industrial system modeled but does not necessarily concern a specific stock: the im-age of the company for example.
Figure : Elements of the SimulValor language (Adopted from Daaboul et al., 2010) 2.5 Discussion
We are interested in modelling a value network to aid a company in strategic decision making. The e3-value approach focuses on business model (in the e-business sense of the word), it describes the “what” of the business model, but not the “why” (strategic rationale) (Weigand et al., 2007), and it also lacks a clear strategic focus which weakens its ability for prescriptive strategic insights and makes it less adopted for our needs. The c3-value modeling framework focuses on the direct competitor and the direct customer and thereby neglects the inter-dependencies inherent in the current global economy and the potential given by the network perspective (Biem and Caswell, 2008). In our approach we focus on the entire network to gain a competitive edge.
Allee’s modeling framework: Due to its assumption on the unmanageability of the network added to its focusing on exchanges without assigning a purpose to the net-work, this model has limited potential for strategic anal-ysis thus is not adopted to our needs.
Simulvalor on the other hand is a simple language ena-bling its user to model a complex value network and include all variables of the network influencing the gen-erated value. Its aim is to support strategic decision mak-ing. It also permits the modeling of qualitative variables via influence maps. Moreover it doesn’t focus only on the economic aspect of value but includes all different
types of value such as the subjective value perceived by the customer. All this makes Simulvalor the most adapted language to our needs.
3 OUR PROPOSAL: VALUE NETWORK MODELING & SIMULATION FOR STRATEGIC DECISION MAKING 3.1 Modifications on SimulValor
Even though SimulValor was the most appropriate lan-guage and methods to model a value network for strate-gic analysis, some modifications were necessary. These are the following:
1. All flows in SimulValor are represented with the physical flow. However, an activity can be triggered by an informational flow, and then it transforms a physical flow. Hence the need to distinguish between different flows. Therefore we distinguished between physical, informational and financial flow.
2. SimulValor models resources as informational varia-bles. We prefer to plot the resource by adding the sym-bol [R]. This allows us to manage the problem of re-source allocation.
3. Changing the representation of an activity or trans-formation block, adding the partners responsible of the execution of this activity. This is a cosmetic modifica-tion.
MOSIM’12 - June 06-08, 2012 - Bordeaux - France
4. Modeling functions of products that are presented as information related to the product or physical flow. This was necessary for modeling the perceived quality of the product which depends on its functions.
5. Distinction between execution and decision activity by adding a new transformation block. Decisions such as procurement influence the performance of the value net-work. Thus it was necessary to integrate these decisions in the analysis, thus in the modeling of a value network. 3.2 Approach for Value Network Modeling and
Simulation
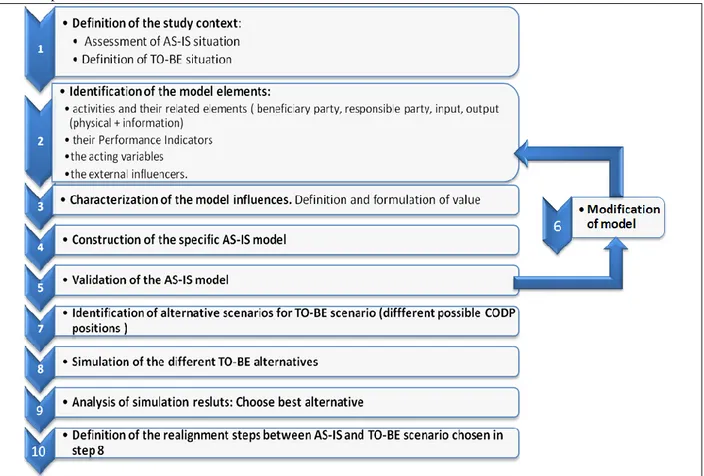
The different steps for our proposed approach are pre-sented in figure 4.
The first step consists of describing the study context and to determine the TO-BE scenarios. It defines the strategic decision to be analyzed. In this step we gather information about the current state of the value network. The second step consists of data collection. This is achieved via filling predefined excel sheets. In this step, all needed data concerning the model elements are gath-ered. These elements are
the partners of the value network
the activities and the related parameters (cost, re-sources, execution times, setup times, etc.)
the physical and informational flows that are input and output of the activities
the acting variables
the performance indicators of importance to the stra-tegic decision analysed.
The third step is about value modeling. In this step the different values (based on different beneficiary partner) are modeled and their criteria are determined. In this article we focus on the language and the simulation tool and do not explain the value modeling. In the forth step, the modeling and simulation tool that we developed in the ARENA Rockwel discrete simulation software is used to model the AS-IS value network. Then, and in the fifth step, this model is validated by comparing its behavior with that of the real value network. If not, some modifications on the model are necessary. These are achieved in step six. Once the model is validated, the TO-BE scenarios are defined in step seven and then simulated in step eight. The TO-BE scenarios defer based on the strategic decision analysed. They can dif-fer based on difdif-ferent partners (such as difdif-ferent suppli-ers), different activities, different physical flows (new products, or different poduct designs), etc. After simu-lating the TO-BE scenarios, the simulation results are analyzed in step nine. For this, a multicriteria analysis is conducted via the use of the Analytical Hierarchy Process (AHP) method to analyse the different resulting measures of generated values in the network. Finally, a conclusion and summary of results and their analysis re provided.
3.3 Value Network Modeling & Simulation tool We developed a value network library within the soft-ware ARENA of Rockwell. Arena is a discrete event simulation software developed by Systems Modeling in the 80s. It is a flow-oriented simulator. In Arena, the user builds a model by placing modules that represent processes or logic in the user interface. Connector lines are used to join these modules together and specify the flow of entities. These flows of entities allow to model both physical and information flows. Arena allows the user to develop his own modules. The ARENA tool is often used to study supply chain management (SCM) (Kleijnen, 2005). Ruibi et al. (2010) propose to use Are-na simulation to study the bullwhip effect in a supply chain. Arena allows interfacing with different program-ming languages such as C, C++, VBA, Java, etc., with data bases and with spreadsheets. Vanaman et al. (2004) propose to combine ARENA and CPLEX to study inven-tory/logistics related problems. Blanc (2006) combines an Arena simulation model and a Multi Agent System to control a manufacturing system.
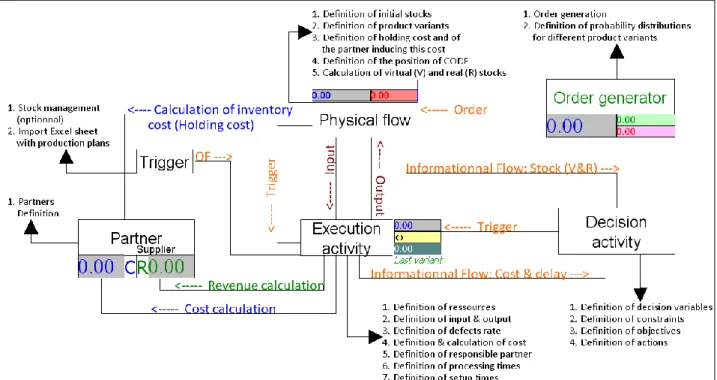
The developed library is formed of 7 modules presented in figure 5. The module “Partner” is used to model the different partners of the network. The module “Physical Flow” is used to model the different physical flows of the network including the initial stocks, the different variants of the physical flow, the characteristics of the flow (such as color, design, material, size, volume, etc.), the stocking cost, and the partner inducing this cost. The module “Execution Activity” allows the modeling of all execution activities of the network via defining the dif-ferent activity duration parameter, the needed resources, the inputs and outputs of the activity (physical flows), the costs, the partner inducing the cost, and if any, the partner collecting the revenue,. The module “Decision Activity” permits the modeling of different decisions by defining the decision variables, the constraints, and the actions to be taken. The module “Trigger” is used to stimulate the execution activities by importing an excel sheet. The “Order Generator” module is used to random-ly generate orders. Finalrandom-ly the “Variant” module is used to define the characteristics defining the variants of the different physical flows. The interactions between these modules are presented in figure 6 which shows the calcu-lations realized and what is defined in each module. The interactions are presented in the figure as lines, whereas the parameters and elements defined are presented via arrows.
Figure : Modules of the value network library This library fits exactly the conceptual model of SimulValor language. This conceptual model was the base for the development of the library as well as the entire methodology. We find in the library the same
ele-ments as in the Simulvalor language. We find partners, transformation blocs representing an execution and a decision activity, and a physical flow. Informational flow is inserted in the logic of the library and is thus not directly visible to the user, except for orders and activity triggers. Orders are modeled via the order generator module and all stimulators of an execution activity are modeled via the trigger module. Value, as well as all variables of the network and their influence relationships is modeled via the module variables of the basic process library of Arena. A stock is modeled also via the physi-cal flow module. A submodel is modeled via the submodel module of ARENA.
The library is generic, and can be used to model and simulate any value network. The model is created simply by placing the modules in the user interface and filling their different parameters. The user does not have to create any simulation logic (meaning the interactions and links between different modules). The simulation logic is embedded in the library. This facilitates the use of the library and do not require high skills in the use of the Arena software. Moreover, any change in the library is easily modeled by adding a new module or retrieving one, since no links are directly made in the interface by the user.
4 CASE STUDY: SHOE INDUSTRY
Our modeling and simulation approach was validated in a shoemaking industry case study at Alpina. The strategic decision concerned changing the value network structure of the Binom line of products from made-to-stock (MTS) to made-to-order (MTO) or assemble-to-order (ATO) in assemble-to-order to offer more product variety and customizable shoes. Alpina ‘value network presented in Figure 7 included the following:
20 partners (Alpina, Customer, Shop, distribution company, and 16 suppliers)
88 physical flows
100 execution activities
30 decision activities
Alpina provided all the necessary data for modelling its value network but due to confidentiality constraints we cannot share these data. Also an analytical analysis was conducted to model the value perceived by the customer. We based the orders on the forecasting based on sales history provided by Alpina. The production plan was provided by Alpina, as well as the different parameters of decisions in the network. Contracts were the base for modeling the different partners (cost, delays, penalties, etc.).
After validation of the AS-IS model by Alpina, four different alternative TO-BE scenarios were identified:
Alternative 1: a mix between MTS and MTO
Alternative 2: a second mix between MTS and MTO
Alternative 3: ATO
MOSIM’12 - June 06-08, 2012 - Bordeaux - France
Figure : Logic and relations between the value network library modules
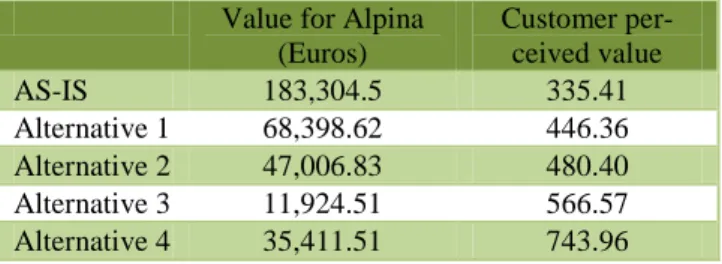
Value for two main partners in the network were ana-lysed, value for the customer and value for the shoemak-ing company (Alpina). Customer value was calculated by dividing perceived quality on price, while value for Alpina represents its profit. In the profit calculation, the fixed costs are not included. In this article we do elabo-rate on the value model.
The simulations results were the following: Value for Alpina
(Euros) Customer per-ceived value AS-IS 183,304.5 335.41 Alternative 1 68,398.62 446.36 Alternative 2 47,006.83 480.40 Alternative 3 11,924.51 566.57 Alternative 4 35,411.51 743.96
Table : Simulation results
From the simulation results we see that the customer value increases when we move to an ATO or MTO structure, for the product variety and the degree of free-dom of choice increase as well. Nevertheless, with its current relationships with the network partners and spe-cifically its suppliers, it is not profitable to move to an ATO or MTO structure. Contracts will have to be rene-gotiated especially for defining delivery lead time and the min quantity to order from supplier. If no changes in the partners’ relationships occur, it is best for Alpina to keep its MTS structure.
5 DISCUSSION
The case study allowed us to analyse the methodology proposed as well as its different steps. From the case study and the evaluation of Alpina, we concluded the following:
The hardest step to be executed is step 2. The data was not always available, or we didn’t know who had this data. Moreover, sometimes data was provided but was different than what was needed. Also, we had many times to change the data format to include it in the database.
Once the data was collected and treated, the model was easily created. No specific skills in simulation were required. The user had only to place the different modules in the interface and set its parameters.
Since, few hypotheses were made and all the data used was real, the model was validated rapidly since its behaviour was similar with the real network with a max of 5% error.
Step 3 requires an analysis of the customer perceived value. We based this analysis on the results of European
projects focusing on shoe industry; Euroshoe and DOROTHY.
The different alternatives were also easily created. 6 CONCLUSION
In this article we have presented a method for value net-work modeling and simulation as a support for strategic decision making. Our approach is based on the SimulValor language to which we added few modifica-tions. Moreover we have developed a value network library in the discrete simulation software Arena of Rockwell.
Future work would be to include the analysis of risks to the evaluation of the performance of a value network.
REFERENCES
Alain Biem, A., and Caswell, N., 2008. A value network model for strategic analysis. 41st Hawaii International Conference on System Sciences.
Allee, V., 2002. The Future of Knowledge: Increasing
Prosperity through Value Networks, Boston: Butterworth- Heinemann.
Blanc P., 2006. Pilotage par approche holonique d’un
système de production de vitres de sécurité feuilletées.
Thèse de Doctorat, École Centrale de Nantes et Université de Nantes.
Campbell, A., and Wilson, D., 1996. Managed networks: creating strategic advantage. In D. Iacobucci (Ed.),
Networks in Marketing (p. 125–143), London: Sage
Publishing.
Daaboul, J., Bernard, A., and Laroche, F., 2010. Extended value network modeling and simulation for mass customization implementation. Journal of
Intelligent Manufacturing, DOI:
10.1007/s10845-010-0493-1.
Daaboul, J., DaCunha, C., Bernard, A., and Laroche, F., 2011. Value of personalized products: modeling the customer perception. The 2011 World Conference on
Mass Customization, Personalization, and Co-Creation (MCPC 2011), Berkely, California, United
States, November 17-19, 2011.
Doumeingts, G., 1984. Méthode GRAI : méthode de
conception des systèmes en productique. Mémoire de
Thèse, Université de Bordeaux I, France.
Elhamdi, G., 2005. Modelisation et simulation de
chaines de valeurs en entreprise : Une approche dynamique des systemes et aide à la décision :
MOSIM’12 - June 06-08, 2012 - Bordeaux - France
SimulValor. Thèse de Doctorat, Ecole Centrale Paris,
France.
Galanos, J., 1998. Quel type de valeur choisir en qualité totale pour maîtriser le progrès continu dans les processus ? Marketing, Stratégie et Organisation.
Actes des XIVèmes Journées des I.A.E, Nantes, p.
331- 348.
Gordijn, J., Akkermans J.M., and Vliet J.C. Van, 2000. Business Modeling is not Process Modeling.
Conceptual Modeling for E-Business and the Web,
LNCS 1921, Springer-Verlag, p. 40-51.
Gordijn, J., and Akkermans, H., 2003. Value based requirements engineering: Exploring in-novative e-commerce idea. Requirements Engineering Journal, 8(2), p. 114-134.
Hakansson, H., and Snehota, I., 1989. No business is an island: the network concept of business strategy.
Scandinavian Journal of Management, 5(3), p.
187-200.
Jack, P., and Kleijnen, C., 2005. Supply chain simulation tools and techniques: a survey. International Journal
of Simulation & Process Modeling, 1 (1/2), p. 82-89.
Labrousse, M., 2004. Proposition d’un modèle
conceptuel unifié pour la gestion dynamique des connaissances d’entreprise. Thèse de Doctorat, Ecole
Centrale de Nantes, France.
Madhavan, R., Koka, B., and Prescott, J., 1998. Networks in transition: how industry events (re)shape interfirm relationships. Strategic Management Journal, 19, p. 439–459.
Mauchand, M., 2007. Modélisation pour la simulation
de chaines de production de valeur en entreprise industrielle comme outil d'aide à la décision en phase
de conception / industrialisation. Thèse de Doctorat,
Ecole Centrale Nantes, France.
Normann, R., and Ramirez, R., 1994. Designing
Interactive Strategy: From the Value Chain to the Value Constellation, Chichester: John Wiley & Sons.
Parolini, C., 1999. The Value Net: A Tool for
Competitive Strategy, Chichester: John Wiley &
Sons.
Peppard, J., and Rylander, A., 2006. From Value Chain to Value Network: Insights for Mobile Operators.
European Management Journal , 24 (2–3), p. 128–
141.
Porter, M. E., 1985. Competitive Advantage: Creating
and Sustaining Superior Performance, First Free
Press Edition.
Rouibi, S., Burlat, P., Frein, Y., and Ouzrout, Y., 2010. La modélisation Arena comme outil d’étude de l’influence du VMI sur les niveaux de stocks des chaines Logistiques. 8e Conférence Internationale de
MOdélisation et SIMulation - MOSIM’10.
Tapscott, D., Ticoll, D., and Lowy, A., 2000. Digital
Capital:Harnessing the Power of Business Webs,
Boston: Harvard Business School Press.
Vamanan, M., Wang, Q., Batta, R., and Szczerba, R.J., 2004. Integration of COTS software products ARENA & CPLEX for an inventory/logistics problem.
Computers & Operations Research, 31, p. 533–547.
Weigand, H., Johannesson, P., Andersson, B., Bergholtz, M., Edirisuriya, A., and Ilayperuma, T., 2007. Strategic Analysis Using Value Modeling-The c3-Value Approach. 40th Annual Hawaii International
