HAL Id: tel-01983191
https://tel.archives-ouvertes.fr/tel-01983191
Submitted on 16 Jan 2019HAL is a multi-disciplinary open access archive for the deposit and dissemination of sci-entific research documents, whether they are pub-lished or not. The documents may come from teaching and research institutions in France or abroad, or from public or private research centers.
L’archive ouverte pluridisciplinaire HAL, est destinée au dépôt et à la diffusion de documents scientifiques de niveau recherche, publiés ou non, émanant des établissements d’enseignement et de recherche français ou étrangers, des laboratoires publics ou privés.
Analysis of user popularity pattern and engagement
prediction in online social networks
Samin Mohammadi
To cite this version:
Samin Mohammadi. Analysis of user popularity pattern and engagement prediction in online social networks. Networking and Internet Architecture [cs.NI]. Institut National des Télécommunications, 2018. English. �NNT : 2018TELE0019�. �tel-01983191�
Doctor of Philosophy (PhD) Thesis
Sorbonne Universit´
e and T´
el´
ecom SudParis
Specialization
C
omputerS
cience- A
rtificialI
ntelligenceNational Thesis Number (NNT)
2018TELE0019
presented by
Samin Mohammadi
Analysis of User Popularity Pattern and
Engagement Prediction in Online Social Networks
4th December 2018
Committee:
Markus Fiedler Reviewer Professor, Blekinge Tekniska Hogskola University - Sweden Agata Filipowska Reviewer Assistant Professor, Poznan University of Economics - Poland Ioan Marius Bilasco Examiner Associate Professor, Universit´e Lille 1, France
Marie-Jeanne Lesot Examiner Associate Professor, Sorbonne Universit´e - France Yacine Ghamri-Doudane Examiner Professor, Universit´e de La Rochelle - France Daqing Zhang Examiner Professor, Institut T´el´ecom SudParis - France Patrick Constant Examiner CEO of Pertimm, Pertimm - France
Noel Crespi Supervisor Professor, Institut T´el´ecom SudParis - France
Th`
ese de Doctorat (PhD) de
Sorbonne Universit´
e et Institut T´
el´
ecom SudParis
Sp´ecialit´e
Informatique
Num´ero National de Th´ese (NNT)
2018TELE0019
pr´esent´ee par
Samin MOHAMMADI
Analyse du mod´
ele de popularit´
e de l’utilisateur et
de la pr´
ediction d’engagement en les r´
eseaux sociaux en ligne
4th Decembre 2018
Jury compos´e de :
Markus Fiedler Rapporteur Professeur, Blekinge Tekniska Hogskola University - Sweden Agata Filipowska Rapporteur Professeur Assistant, Poznan University of Economics - Poland Ioan Marius Bilasco Examinateur Maitre de Conf´erence, Universit´e Lille 1, France
Marie-Jeanne Lesot Examinateur Maitre de Conf´erence, Sorbonne Universit´e- France Yacine Ghamri-Doudane Examinateur Professeur, Universit´e de La Rochelle - France Daqing Zhang Examinateur Professeur, Institut T´el´ecom SudParis - France
Patrick Constant Examinateur Pr´esident directeur g´en´eral de Pertimm, Pertimm - France Noel Crespi Directeur Professeur, Institut T´el´ecom SudParis - France
Acknowledgements
I would like to express my sincere thanks to Professor Noel CRESPI, my thesis super-visor at Institut T´el´ecom SudParis, who guided my researches and answered my questions. I would like to thank him for all his help, it was absolutely invaluable.
More thanks go to my thesis reviewers for all their invaluable comments and guidance, Professor Markus Fiedler and Professor Agata Filipowska.
I would especially like to thank my thesis committee members composed of Dr. Ioan Ma-rius BILASCO, Dr. Marie-Jeanne LESOT, Professor Daqing ZHANG, Professor Yacine GHAMRI-DOUDANE, and Dr. Patrick CONSTANT.
I would also like to thank my co-supervisor, all my friends and colleagues who helped me during my PhD.
Above all, many thanks to all my family for their understanding and the love, support, and constant encouragement I have gotten over the years.
Finally, I would like to thank and dedicate this thesis to my father. It was you who always encouraged me for science. Although it has been two years since you have passed, I still take your lessons with me, every day.
Samin MOHAMMADI 04th Dec 2018
Abstract
Nowadays, social media has widely affected every aspect of human life. The most signif-icant change in people’s behavior after emerging Online Social Networks (OSNs) is their communication method and its range. Having more connections on OSNs brings more attention and visibility to people, where it is called popularity on social media. Depending on the type of social network, popularity is measured by the number of followers, friends, retweets, likes, and all those other metrics that is used to calculate engagement. Studying the popularity behavior of users and published contents on social media and predicting its future status are the important research directions which benefit different applications such as recommender systems, content delivery networks, advertising campaign, election results prediction and so on. This thesis addresses the analysis of popularity behavior of OSN users and their published posts in order to first, identify the popularity trends of users and posts and second, predict their future popularity and engagement level for published posts by users.
To this end, i) the popularity evolution of ONS users is studied using a dataset of 8K Face-book professional users collected by an advanced crawler. The collected dataset includes around 38 million snapshots of users’ popularity values and 64 million published posts over a period of 4 years. Clustering temporal sequences of users’ popularity values led to iden-tifying different and interesting popularity evolution patterns. The identified clusters are characterized by analyzing the users’ business sector, called category, their activity level, and also the effect of external events.
Then ii) the thesis focuses on the prediction of user engagement on the posts published by users on OSNs. A novel prediction model is proposed which takes advantage of Point-wise Mutual Information (PMI) and predicts users’ future reaction to newly published posts. Finally, iii) the proposed model is extended to get benefits of representation learning and predict users’ future engagement on each other’s posts. The proposed prediction approach extracts user embedding from their reaction history instead of using conventional feature extraction methods. The performance of the proposed model proves that it outperforms conventional learning methods available in the literature.
The models proposed in this thesis, not only improves the reaction prediction models to exploit representation learning features instead of hand-crafted features but also could help news agencies, advertising campaigns, content providers in CDNs, and recommender sys-tems to take advantage of more accurate prediction results in order to improve their user services.
Keywords
Online Social Networks, Machine Learning, Prediction, Popularity, Representation Learn-ing, Data Mining
R ´esum ´e
De nos jours, les m´edias sociaux ont largement affect´e tous les aspects de la vie humaine. Le changement le plus significatif dans le comportement des gens apr`es l’´emergence des r´eseaux sociaux en ligne (OSNs) est leur m´ethode de communication et sa port´ee. Avoir plus de connexions sur les OSNs apporte plus d’attention et de visibilit´e aux gens, o`u cela s’appelle la popularit´e sur les m´edias sociaux. Selon le type de r´eseau social, la popularit´e se mesure par le nombre d’adeptes, d’amis, de retweets, de goˆuts et toutes les autres mesures qui servaient `a calculer l’engagement.
L’´etude du comportement de popularit´e des utilisateurs et des contenus publi´es sur les m´edias sociaux et la pr´ediction de leur statut futur sont des axes de recherche importants qui b´en´eficient `a diff´erentes applications telles que les syst`emes de recommandation, les r´eseaux de diffusion de contenu, les campagnes publicitaires, la pr´evision des r´esultats des ´
elections, etc. Cette th`ese porte sur l’analyse du comportement de popularit´e des utili-sateurs d’OSN et de leurs messages publi´es afin, d’une part, d’identifier les tendances de popularit´e des utilisateurs et des messages et, d’autre part, de pr´evoir leur popularit´e future et leur niveau d’engagement pour les messages publi´es par les utilisateurs.
A cette fin, i) l’´evolution de la popularit´e des utilisateurs de l’ONS est ´etudi´ee `a l’aide d’un ensemble de donn´ees d’utilisateurs professionnels 8K Facebook collect´ees par un crawler avanc´e. L’ensemble de donn´ees collect´ees comprend environ 38 millions d’instantan´es des valeurs de popularit´e des utilisateurs et 64 millions de messages publi´es sur une p´eriode de 4 ans. Le regroupement des s´equences temporelles des valeurs de popularit´e des utilisateurs a permis d’identifier des mod`eles d’´evolution de popularit´e diff´erents et int´eressants. Les grappes identifi´ees sont caract´eris´ees par l’analyse du secteur d’activit´e des utilisateurs, appel´e cat´egorie, leur niveau d’activit´e, ainsi que l’effet des ´ev´enements externes.
Ensuite ii) la th`ese porte sur la pr´ediction de l’engagement des utilisateurs sur les messages publi´es par les utilisateurs sur les OSNs. Un nouveau mod`ele de pr´ediction est propos´e qui tire parti de l’information mutuelle par points (PMI) et pr´edit la r´eaction future des utilisateurs aux messages nouvellement publi´es. Enfin, iii) le mod`ele propos´e est ´elargi pour tirer profit de l’apprentissage de la repr´esentation et pr´evoir l’engagement futur des utilisa-teurs sur leurs postes respectifs. L’approche de pr´ediction propos´ee extrait l’int´egration de l’utilisateur de son historique de r´eaction au lieu d’utiliser les m´ethodes conventionnelles d’extraction de caract´eristiques. La performance du mod`ele propos´e prouve qu’il surpasse les m´ethodes d’apprentissage conventionnelles disponibles dans la litt´erature.
Les mod`eles propos´es dans cette th`ese, non seulement d´eplacent les mod`eles de pr´ediction de r´eaction vers le haut pour exploiter les fonctions d’apprentissage de la repr´esentation au lieu de celles qui sont faites `a la main, mais pourraient ´egalement aider les nouvelles agences, les campagnes publicitaires, les fournisseurs de contenu dans les CDN et les syst`emes de recommandation `a tirer parti de r´esultats de pr´ediction plus pr´ecis afin d’am´eliorer leurs services aux utilisateurs.
10
Mots-cl´es
R´eseaux sociaux en ligne, apprentissage machine, pr´ediction, popularit´e, apprentissage de la repr´esentation, exploration de donn´ees
Table of contents
1 Introduction 17 1.1 User Popularity . . . 17 1.2 Content Popularity . . . 18 2 Related Works 21 2.1 Introduction . . . 22 2.2 User Popularity . . . 22 2.3 Content Popularity . . . 232.4 Latent Representation on OSNs . . . 25
2.4.1 Pointwise Mutual Information on OSNs . . . 25
2.4.2 Word2vec . . . 25
I User Popularity on Social Media 27 3 Popularity Evolution of Professional Users 29 A — Identifying User’s Popularity Behavior on Facebook 31 3.1 Abstract . . . 33
3.2 Introduction . . . 33
3.3 Data Collection and Dataset . . . 34
3.4 Evolution of Popularity . . . 35
3.4.1 Popularity Analysis - In Overall . . . 35
3.4.2 Popularity Analysis - Category Wise . . . 36
3.5 Users’ Clustering . . . 37
3.5.1 Feature Vector and Clusters . . . 38
3.5.2 Popularity Distribution in each Cluster . . . 40
3.5.3 Category Analysis . . . 41
3.5.4 Activity Analysis . . . 43
12 TABLE OF CONTENTS
B — Long-Term Evolution of User’s Popularity 45
3.7 Abstract . . . 47
3.8 Introduction . . . 47
3.9 Data Collection and Dataset . . . 47
3.10 Evolution of Popularity . . . 49
3.10.1 Global Page . . . 49
3.10.2 Popularity Analysis - Genral . . . 50
3.10.3 Popularity Analysis - Category Wise . . . 52
3.10.4 Popularity Analysis - Activity Wise . . . 53
3.11 Users Clustering Evolution and Comparison . . . 54
3.11.1 Extended Feature Vector and Clustering . . . 55
3.11.2 Popularity Distribution of Clusters . . . 57
3.11.3 Users’ Long-term Popularty Behavior Variation . . . 58
3.11.4 Category Analysis . . . 59
3.11.5 Activity Analysis . . . 63
3.12 Influential Factors on Popularity Trends . . . 64
3.12.1 Impact of Activity . . . 65
3.12.2 Impact of External Events . . . 67
3.12.3 Other Influential Factors . . . 69
3.13 Conclusion . . . 69
II Engagement Prediction on Social Media 71 4 Who Will Like the Post? Predicting Likers on Flickr 73 4.1 Abstract . . . 74
4.2 Introduction . . . 74
4.3 Prediction Methodology . . . 75
4.3.1 Users Similarity . . . 76
4.3.2 Prediction Model . . . 77
4.4 Evaluation and Results . . . 78
4.4.1 Dataset Description . . . 78
4.4.2 Future Likers Prediction . . . 79
Photo Precision . . . 79
Likers Precision . . . 81
4.4.3 Publishers as Predictors . . . 82
4.5 Publishers Analysis . . . 83
4.6 Conclusion . . . 86
5 User Reactions Prediction Using Embedding Features 89 5.1 Abstract . . . 90
5.2 Introduction . . . 90
5.3 Methodology . . . 91
TABLE OF CONTENTS 13
5.3.2 Future Reactions Prediction . . . 93
5.4 Evaluation . . . 94
5.4.1 Dataset Description . . . 94
5.4.2 Likers Prediction Experiments . . . 95
Model Configuration . . . 95
Baseline Methods . . . 96
Experimental Results . . . 96
5.5 Conclusion . . . 98
List of Figures
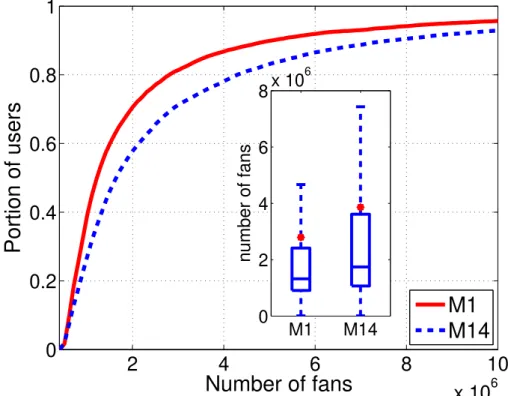
2.1 The Skip-gram model architecture for predicting surrounding words given the current word w(t) [1]. . . 26 3.1 CDF (and boxplot with red dot representing the Mean value) of the Nf of
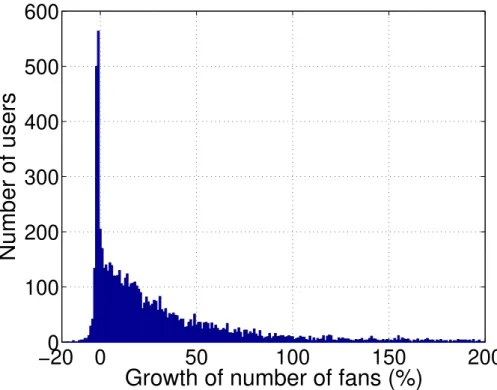
users in M1 and M14 . . . 36 3.2 Distribution of users based on the percentage of their Nf growth, during 14
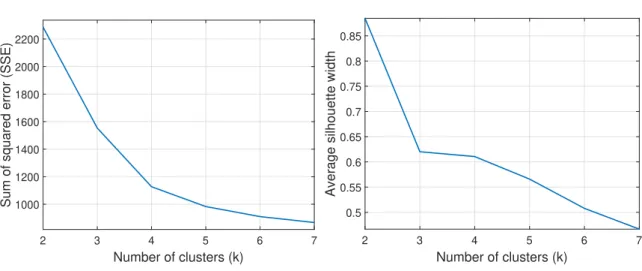
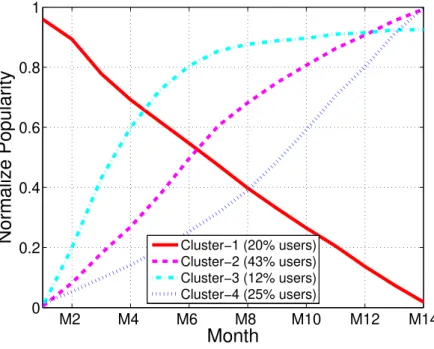
months (from M1 to M14) . . . 37 3.3 SSE and Silhouette width test to find the proper k value for the dataset . . 39 3.4 Normalized popularity trends of four clusters . . . 40 3.5 CDF (and boxplot) of the distribution of users Nf in four identified clusters.
(the red dot inside boxplot represents the Mean value of the distribution). . 41 3.6 Distribution of predefined Facebook categories in each identified cluster . . 42 3.7 CDF (and BoxPlot) of number of published posts per user in the first (M1)
and last (M14) months of the dataset (red dot in boxplot represents the Mean value of the distribution). . . 44 3.8 users’ CDF with the box-plots of #fans (Nf) distributions including two
phases of M1 and M14. Red dots represent the mean values of Nf in
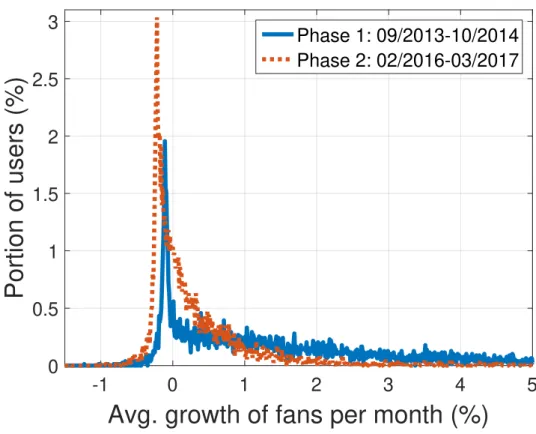
partic-ular month. . . 51 3.9 Distribution of users’ Nf growth rate in three time spans. . . 52
3.10 CDF of the number of posts published by users in the first and last months of phase1 and phase2. Red dots represent the mean values. . . 54 3.11 SSE test to find the appropriate k value for our database . . . 55 3.12 Popularity trends in two phases . . . 56 3.13 CDF (and boxplot) of the distribution of users’ Nf at phase1 & phase2. Red
dots represent the mean values. . . 58 3.14 Cluster group percentage from phase1 changing to phase2 . . . 59 3.15 Predefined Facebook categories distribution in each identified cluster. . . 60 3.16 The combination of phase1 cluster group in phase2 cluster in predefined
Facebook categories distribution. . . 61 3.17 CDF (and BoxPlot) of published posts number for first and last months per
16 LIST OF FIGURES
3.18 CDF of number of published post for users in cluster-5 . . . 64 3.19 The monthly average growing rate for two phases . . . 66 3.20 Normalized popularity trends of Allen Iverson and Aamir Khan. The red
and blue dashed lines show how the growth rate of their page’s popularity has changed over time. . . 68 4.1 Co-occurrences are computed for each user in the like sequences with her surrounded
users, placed in a window of size w from two directions. . . 76 4.2 The portion of photos with at least one correct prediction in their future
likers for different k numbers of early likers. Choosing likers from friendships improves the prediction results. . . 80 4.3 Distribution of #correctly-predicted-likers of photos with different values of
early likers (k). (Red dots show the mean values). . . 81 4.4 Distribution of predicted photos (Y-axis) over the different ranges of precisionp
which is computed per photo separately in k = 1. (the portion of each bar is from the percentages shown in the legend) . . . 84 4.5 Four-dimensional representation of publishers consisting avg. potential
#Likers-to-Predict (X-axis), Avg. #correctly-predicted-likers (Y-axis), actual #predicted-photos (shown by the size of circles), and predict-frac (shown by color). The bigger size of circles shows the higher number of predicated photos and vice versa. . . 85 4.6 Comparison of high-predictable and low-predictable publishers in terms of
their average values of #followers, #engagements, #activities (published-photos), and #followings. . . 86 5.1 Co-occurrences are computed for each user in the reaction sequences with
her surrounded users, placed in a window of size w from two directions, are fed to the Word2vec model. the Word2vec Model supplies user embeddings. 92 5.2 One-hidden layer neural network with softmax function in the final layer to
predict the target user’s reaction probability. . . 93 5.3 The power-law distribution of users in reaction sequences. . . 94
Chapter
1
Introduction
Nowadays, every aspect of human life has been widely affected by social media. An enor-mous amount of data is uploaded to Online Social Networks (OSNs) every day which is analyzed and employed to improve the user services provided by those networks. OSNs are used by professional users, who get benefits of social media to promote their business, products, company, and etc, and also used by individual users, who take advantage of social media for the personal purposes such as sharing the details of their daily life by posting photos, writing statuses, sharing visited location, and so on. Both of those users try to attract as much as users they can in order to bring more visibility to their page and their published posts. By increasing the number of followers and friends, the visibility of the posts and consequently user engagement increase. More user engagement on the posts leads to more popular posts. Popularity on social media is usually measured by the number of followers and friends for users, and the number of likes, comments, shares, tweets, and etc for posts.
1.1
User Popularity
Popularity is very important for users on social networks especially for professional users who are following more serious goals of increasing visibility, turnover, sells, and so on. Reaching those goals through social media can be directly affected by the number of fol-lowers. While the number of followers for regular users is not as much crucial as for professional users. Many of professional users are willing to spend a considerable amount of money to increase the popularity value, even through unusual ways such as buying likes from like farms [2] [3]. The number of followers of a page has been found to be one of the most positive correlated features linking candidates’ fan pages to the number of their votes in elections [4] [5]. OSNs offer a huge platform for professional users (i.e. companies, politicians, celebrities, etc.) to increasingly attract followers and promote their goals as much as possible [6].
18 1.2. CONTENT POPULARITY
defines a specific type of account for professional users, called FanPages1. This type of account has several features that distinguishes it from regular accounts. If a user likes a page, it will be added to the interest list of the user’s profile. Professional users from various categories can create FanPages on Facebook to interact with their fans and customers. Apart from the general static attributes such as the page description and category selected by the page owner, the main dynamic attribute for each page is the number of fans (Nf)
who have liked the page. This metric is publicly available for each FanPage and considered as the main metric that shows the popularity of a FanPage [7]. Even in major political events such as US presidential election, the popularity metric in different social media is the main metric to compare different candidate success in their campaign.
Understanding the popularity evolution and identifying the most influential factors on its variation will help professional users to take significant decisions about their attitude and behavior on different social media. In the present thesis, popularity evolution of professional users is elaborately investigated in order to model the variation patterns of their popularity trends. Additionally, the influential factors, including the activity volume and external events, on popularity evolution are also comprehensively studied. The main contributions of user popularity section are:
i. Proposing a methodology of monitoring the popularity evolution of professional users on Facebook in a noticeably micro level which not only is novel but also applicable to different types of OSNs.
ii. Identifying two main groups of users including fan-attractors who grew their Nf by
different patterns, and fan-losers, users with a noticeable drop in their popularity trend.
iii. Finding several influential factors on popularity trend of users when the activity level of users or being celebrity are positively correlated to the trend of the number of fans.
1.2
Content Popularity
Users are the main actors on social media whom engagement and reactions to the published posts play a substantial role in information propagation and popularity of the post [8] [9]. The total number of engagements on a post shows the number of reactors (who reacted to the post), also known as the popularity number. Predicting this value and its involved reactors are two significant prediction tasks, which supply valuable information for many applications such as providing better solutions for content placement in networks, more efficient advertisement campaigns, and providing accurate recommendations.
The first task, predicting popularity size, has been inspected by many researchers using structural, profile, network, and content features [10] and recently some temporal informa-tion about early reactors [11] [12]. However, it is not the focus of the present thesis. Our focus in this study is to predict future reactors who are going to react to recently published posts, which is the second mentioned task. There is a big number of studies that have
1
CHAPTER 1. INTRODUCTION 19
investigated the prediction of future reactors using a combination of social and content features as well as temporal features [13] [14]. These models have to define features and extract the most suitable and efficient ones manually. Where feature extraction is a very difficult and frustrating task. Instead, we avoid this task in our study by taking advantage of feature embeddings.
Feature embeddings are basically anything that can act as a hidden representation for a given object. Embedding means converting data to a feature representation where certain properties can be represented by notions of distance. It is essentially projecting the data to a high dimensional feature space, so that the features that are more or less alike have a small distance between them in the embedded space. We propose a model to derive user embeddings and use them to predict future reactors. Therefore, the model will not need feature selection step any more. The prediction is done using two proposed prediction methodology. First, a method based on Point-wise Mutual Information (PMI) inspired by the W ord2vec language model [1]. And second, a model based on user embedding features derived from the Word2vec model. Both of the models take users’ reaction history as input. The main contributions of reactors prediction section are:
i. The proposed models do not need to manually select and manage features to predict future reactors, which is the novelty of the study.
ii. Our model requires minimum data for prediction as input, which is users’ reaction history, in compare to similar models that required hand-crafted features.
iii. The models proposed in this study are general and can be applied to any social networks data.
Thesis Structure
The remainder of the thesis is organized as follows: The second chapter presents the background related to the user and content popularity prediction models on social me-dia and discusses the latent representation learning methods. In the first section of the third chapter, we will present our study of popularity evolution on Facebook professional users. First, we discuss popularity analysis from different perspectives and then present the classification model and evaluation results. Finally, we conclude our study and discuss the potential future works. The second section of Chapter three extends the first section’s study by expanding the behavior analysis to a long-term evolution of user popularity. Indeed, this section focuses on the popularity variation of the same users in a longer period and presents the influential factors and the impact of external events on the user’s popularity pattern.
In Chapter four, we present our study on future likers prediction. We first discuss our methodology and prediction model. Then, we explain the evaluation of the proposed method and analyze the results. Chapter five presents the reactions prediction model using embedding features. After presenting the proposed method, it explains the dataset used to evaluate the model. Then, we discuss the results and the performance of the model in compare to some baseline methods. The final section concludes the thesis by summarizing our main proposals and contributions and presents some perspectives of our work.
Chapter
2
Related Works
Contents 2.1 Introduction . . . 22 2.2 User Popularity . . . 22 2.3 Content Popularity . . . 23 2.4 Latent Representation on OSNs . . . 25 2.4.1 Pointwise Mutual Information on OSNs . . . 25 2.4.2 Word2vec . . . 2522 2.1. INTRODUCTION
2.1
Introduction
Popularity is one of the most well-studied aspects on social media [15] [16] where it has become one of the main utilities that is used in advertisements, marketing, and predictions [2]. The term ’popularity’ refers to different metrics such as the number of likes, views, or votes that a page or a content receives [15] [17]. Studying the popularity pattern and prediction of its future behavior are interesting research topics which can be investigated about both users [18] and contents [19].
2.2
User Popularity
Popularity of users on social media is measured by the number of their followers and friends, as well as the number of user engagement on their published posts. The variation of populairty and consequently its behavior is used as a criterion to make a policy in order to succeed in attracting as many followers as possible. Barclay et al. [4] investigated the correlation between political opinions on Facebook and Twitter in the US presidential elections of 2012. They showed that the number of fans and the sentiment of comments are the most-correlated features to the candidates final votes. In another similar work, Barclay et al. [20] demonstrated the number of likes of the Facebook FanPages of the parties as a predictor of election outcomes with 86.6% accuracy.
Meanwhile, a number of studies have focused on identifying the influential factors on at-tracting new fans and increasing user engagement level [21] [22]. Authors in [23] performed an empirical study on a sample of posts created by different brands on their Facebook FanPages. The work consists in conducting a content analysis in order to relate the char-acteristics of the posts to users’ engagement. They investigated the impact of some factors such as emotion and testimonial presence. Pronschinske et al. [24] studied the relationship between the attributes of Facebook pages and the number of page likes, where the number of page likes is the page’s popularity. They showed that being authentic by indicating a page as an official page and linking a website to a Facebook page as well as having more engagement in the posts of a page will attract more fans.
With assumption of the positive influence of popular reviewers on the final popularity of a product, authors in [25] made a model using machine learning techniques to classify reviewers into high/low popularity based on their profile characteristics. Based on this work, businesses can identify potentially influential reviewers to request them for reviews in order to increase the popularity of product. Ferrara et al. [26] measured the total number of likes and comments received by a user’s media in order to investigate the popularity of users. The study also accounts for the total number of times a user likes or comments someone else media, namely the number of social actions that this user performs. Comparing social actions users popularity distributions shows that the social actions distribution is broad but with a steeper slope than users popularity. This implies that there exist relatively less users (with respect to the popularity distribution) who produce many likes or comments to others’ media.
CHAPTER 2. RELATED WORKS 23
considered as experts in a given field in order to promote the growth of the number of fol-lowers of other users is the aim of authors in [27]. Their result proves that it is not easy to determine the factors that allow a Twitter user to get more followers. They also observed that users tend to keep steady, and it is not very frequent that a user changes linguistic cat-egory. It is worth mentioning that several companies monitor Facebook FanPages activities and provide reports, by charging their customers, with general analysis for their clients. One of them that provides aggregated popularity results for single users, is SocialBakers. They claim that their services allow brands to measure, compare, and contrast the success of their social media campaigns with competitive intelligence.
In summary, although few studies have looked to the different aspects of Facebook FanPages, but their focus were mostly for a small group of users. To the best of the authors knowledge, our study is the first one that has specifically investigated the evolution of popularity in a large scale and for a long period. The study looks to this aspect in detail for a list of 8K popular FanPages and also investigates the influential factors to the popularity evolution trends.
2.3
Content Popularity
From the content perspective, once a content is published on a social network, it attracts different amount of users interactions depending on its interestingness, topic, publisher’s reputation, published time and etc. [28] [29]. Meanwhile, some contents succeed to attract more user engagements and become popular [30]. Popularity of a content usually assesses by different cascading metrics such as number of likes, shares, views, etc.
Simultaneously, many studies have tried to model and forecast popularity of content on social media [15]. Bandari et al. utilized article features like source, category, and subjectivity to predict the popularity of an article on Twitter with 84% accuracy. Lerman et al. used a stochastic model to predict how popular a newly posted story will be based on the early reactions of Digg users [31]. In [32] and [33] researchers used temporal content features to predict the popularity of content by exploiting time series clustering techniques and linear regression methods. Different categories of features have been examined to predict the popularity of content [10] and in [11] temporal features are illustrated as the best predictors.
Cvijikj et al. [17] analyzed the effects of content characteristics on user engagement on Facebook FanPages. They found that providing informative and entertaining content significantly increases the user’s engagement level. To enhance the number of likes and comments of a post, Vries et al. [16] found that highly vivid and interactive posts like videos and questions can attract more likes and comments than other kinds of post. To predict a concise popularity score of social images, visual sentiment features are used together with context features [34]. Experiments on large scale datasets show the benefits of proposed features on the performance of image popularity prediction. Moreover, their qualitative analysis shows that sentiments seem to be related to good or poor popularity. In another research [35], authors study the effects of visual, textual, and social factors on popularity in a large real-world network focused on fashion. They found significant statistical evidence
24 2.3. CONTENT POPULARITY
that social factors dominate the in-network scenario, but that combinations of content and social factors can be helpful for predicting popularity outside of the network. Their in depth study of image popularity suggests that social factors should be carefully considered for research involving social network photos.
Swani et al. [36] investigate the key factors that contribute to Facebook brand con-tent popularity metrics (i.e., number of likes and comments) for Fortune 500 companies’ brand posts in business-to-business (B2B) versus business-to-consumer (B2C) markets. The results indicate that the inclusion of corporate brand names, functional and emotional ap-peals, and information search cues increases the popularity of B2B messages compared with B2C messages. Moreover, viewers of B2B content demonstrate a higher message liking rate but a lower message commenting rate than viewers of B2C content. Predicting the trend of popularity for a content (which can be a text, video, or image) and more importantly iden-tifying the users who are going to react to that content are very valuable information for different entities such as service providers to rank the content better [37], to early discover trending posts, to improve recommendations and even to improve their content delivery networks and user experiences [38]. This kind of prediction tasks are mainly based on the features of contents and early adapters. Depending on the social network’s type, adapters can be interpreted as either likers, resharers, viewers, or so on. In [39], popularity of a content is predicted using the structural diversity of early adapters. In other studies, tem-poral features of early adopters are realized as the most predictive features among different features of content, user and network [10] [11] [40].
Looking at the models that have been developed on different content popularity pre-diction tasks on OSNs shows that most of them focused on predicting the popularity size of contents in future. There are very rare researches on identifying the users who are going to react to the contents published on OSN in future [41]. Although, interactors predic-tion on OSNs is somehow similar to well-studied rate predicpredic-tion on recommender systems (RS), but there is a main differece which makes RS models improper to apply directly on interactors prediction on OSNs. Rate prediction models on RS are mainly based on interest, whereas OSNs models are primarily based the mixture of friendship and interest. Petrovic et al. [42] tried to predict interactors using a machine learning method based on the passive-aggressive algorithm.
Authors in [13] have proposed a tree-structured Long Short-Term Memory (LSTM) network to learn and predict the entire diffusion path of an image in a social network. By combining user social features and image features, and encoding the diffusion path taken thus far with an explicit memory cell, the model predicts the diffusion path of an image. In [14], authors investigate the sequential prediction of popularity by proposing a prediction framework, by incorporating temporal context and temporal attention into account. Our study is different from the mentioned and other similar studies [43] [44] because of focusing on only users latent likelihood extracted from their reaction history.
CHAPTER 2. RELATED WORKS 25
2.4
Latent Representation on OSNs
In previous studies, different learning methods have been used to model social networks prediction tasks [19]. Recently, deep learning methods attract attention of researchers in variety of studies including the prediction tasks through OSNs. These methods have achieved more vivid and appreciated results in comparison to the conventional learning methods [45] [46] [47]. One of the successful deep learning architectures is word2vec model to capture word embeddings in natural language processing applications [1]. It extracts words semantic similarity using a simple architecture.
2.4.1 Pointwise Mutual Information on OSNs
Point-wise mutual information (PMI) is a measure to model the dependency of two in-stances of random variables used widely in information theory, Natural Language Process-ing (NLP), Recommender Systems (RS) and OSNs. NLP models use PMI to find the strength of association between words [48] [49] [50]. In [51], PMI is used to compute se-mantic similarity and relatedness of words where it achieves outperforming results. RS also take advantage of PMI as one of the measures which used to find users and items similarities [52] [53]. Kaminskas et al. used PMI between items to measure surprise in RS and compared its results with a content-based surprise measurement [54]. In [55], authors get profit of PMI between different recipes’ ingredients and predict recipe ratings given by web users. Spertus et al. compared different similarity metrics including PMI to compute similarity of Orkut communities in order to find users’ interesting communities and exploit them in a recommendation task [56].
Social networks applications also benefit from PMI and use it for two primarily objec-tives, first word and consequently content similarity, and second user similarity. Different problems have been studied on OSNs using words’ PMI metric such as content sentiment analysis, topic detection, content classification and so on [57] [58], but our focus in this study will be on users similarity. Authors in [59] exploited PMI to measure the network similarity of users based on their mutual friends on social networks. Following the aim of this study, we use PMI between users to find their interaction similarities. Our proposed model is inspired by Word2vec language model [45] to compute users co-occurrences. Akin to Wodr2vec which extracts word-context pairs from sentences considering a window of size w, our model will also employ the idea of window and consider each user to be paired with w users before and after that user in the like streams. More detail will be provided in Section 4.3.1.
2.4.2 Word2vec
Authors in [1] have proposed two architectures as two new neural word embeddings struc-tures. The first is Continuous Bag-of-Words (CBOW), which predicts the current word based on the context, and the second approach is Skip-gram which predicts surrounding words given the current word. Skip-gram with negative sampling (SGNS), also known as Word2vec (a sample is shown in Figure 2.1) is an efficient method for learning high-quality
26 2.4. LATENT REPRESENTATION ON OSNS
Figure 2.1 – The Skip-gram model architecture for predicting surrounding words given the current word w(t) [1].
word representation that captures the semantic relation of a word with its surrounding words in a corpus [45].
The Skip-gram approach trains high quality word vectors using a simple architecture. As shown in Figure 2.1, the model predicts the surrounding words (w(t − 2), w(t − 1), w(t + 1), w(t+2)) given the current word w(t). The goal is to find word vector representations that help to predict the nearby words. More formally, given a sequence of words w1, w2, ..., wk,
where wi ∈ W (the vocabulary), the goal is to maximize:
1/k k X i=1 X −c≤j≤c,j6=0 log p(wi+j | wi)
Noticeably improved results from using Word2vec can be seen not only in Natural Language Processing (NLP) [1], but also in other research domains such as social networks [60] [61]. In a method inspired by Word2vec [61], authors exploit the same framework of neural word embedding and produce embeddings for items in an item-based collaborative filtering. DeepWalk [60] uses random walks like the sequences of words in Word2vec to learn the latent representations of users to use on multi-label network classification tasks. Node2vec [47] is a successful method to extract user embeddings where it maximizes the likelihood of preserving network neighborhoods of nodes. As words in sentences and users in random walks correspond to users in interaction sequences, it allows us to utilize a similar method to derive users’ reactions likelihood from their interaction sequences. We explain next how this adaptation has been done in this study.
Part I
Chapter
3
Popularity Evolution of
Professional Users
Contents 3.1 Abstract . . . 33 3.2 Introduction . . . 33 3.3 Data Collection and Dataset . . . 34 3.4 Evolution of Popularity . . . 35 3.4.1 Popularity Analysis - In Overall . . . 35 3.4.2 Popularity Analysis - Category Wise . . . 36 3.5 Users’ Clustering . . . 37 3.5.1 Feature Vector and Clusters . . . 38 3.5.2 Popularity Distribution in each Cluster . . . 40 3.5.3 Category Analysis . . . 41 3.5.4 Activity Analysis . . . 43 3.6 Conclusion . . . 43 3.7 Abstract . . . 47 3.8 Introduction . . . 47 3.9 Data Collection and Dataset . . . 47 3.10 Evolution of Popularity . . . 49 3.10.1 Global Page . . . 49 3.10.2 Popularity Analysis - Genral . . . 50 3.10.3 Popularity Analysis - Category Wise . . . 52 3.10.4 Popularity Analysis - Activity Wise . . . 53 3.11 Users Clustering Evolution and Comparison . . . 54 3.11.1 Extended Feature Vector and Clustering . . . 5530
3.11.2 Popularity Distribution of Clusters . . . 57 3.11.3 Users’ Long-term Popularty Behavior Variation . . . 58 3.11.4 Category Analysis . . . 59 3.11.5 Activity Analysis . . . 63 3.12 Influential Factors on Popularity Trends . . . 64 3.12.1 Impact of Activity . . . 65 3.12.2 Impact of External Events . . . 67 3.12.3 Other Influential Factors . . . 69 3.13 Conclusion . . . 69
Subpart A
Identifying User’s Popularity
Behav-ior on Facebook
CHAPTER 3. POPULARITY EVOLUTION OF PROFESSIONAL USERS 33
3.1
Abstract
Popularity in social media is an important objective for professional users (e.g. companies, celebrities, and public figures, etc). A simple yet prominent metric utilized to measure the popularity of a user is the number of fans or followers she succees to attract to her page. Popularity is influenced by several factors which identifying them is an interesting research topic. This study aims to understand this phenomenon in social media by exploring the popularity evolution for professional users in Facebook. To this end, we implemented a crawler and monitor the popularity evolution trend of 8k the most popular professional users on Facebook over a period of 14 months. The collected dataset includes around 20 million popularity values and 43 million posts. We characterized different popularity evolution patterns by clustering the users’ temporal number of fans and study them from various perspectives including their categories and level of activities. Our observations show that being active and celebrity correlate positively with the popularity trend.
3.2
Introduction
In the fast-paced digital world, Online Social Networks (OSNs) have experienced a mas-sive growth in their variety and usage over the past decade. These systems offer a huge opportunity for professional users (i.e. companies, politicians, celebrities, etc.) who aim to both attract new followers and interact better with them [6]. Facebook as the most popular OSN with more than one billion subscribers defines a specific type of account for professional users, called FanPages1. This type of account has several features that dis-tinguish it from regular accounts. If a user likes a page, it will be added to the interest list of the user’s profile. Professional users from various categories can create FanPages on Facebook as a means of interacting with their fans and customers. Apart from the general static attributes such as the page description and category selected by the page owner, the main dynamic attribute for each page is the number of fans (Nf) who have liked the
page. This metric is publicly available for each FanPage and considered as the main metric that shows the popularity of a FanPage [7]. Even in major political events such as US presidential election, the popularity metric in different social media is the main metric to compare different candidate success in their campaign.
Several studies have emphasized the role of Nf as a comparative and competitive metric
for professional users. Many of professional users are willing to spend a considerable amount of money to increase this value, even through unusual ways such as buying likes from like farms [2] [3]. The number of likes of a page has been found to be one of the most positive correlated features linking candidates’ fan pages to the number of their votes in elections [4] [5]. Attracting Facebook fans is also used as a marketing strategy [62] and provides a metric to measure the return on social media investment [63]. We will use the term popularity to refer to the number of likes of a page. To the best of authors’ knowledge, even though a number of papers have studied the popularity trends of content
1
34 3.3. DATA COLLECTION AND DATASET
and posts [16] [64], there is no study on evaluating the popularity evolution of users, especially by the focus on professional users.
This section of research studies the temporal popularity evolution of professional users through their FanPages on Facebook and attempts to identify the factors that influence the popularity trends. The objectives pursued here are designed to answer the following research questions:
i. How does the temporal popularity of users vary overall and in accordance with users’ business sector (Facebook pre-defined categories)?
ii. What temporal patterns can be identified from the time-series Nf of pages?
(iii) What are the factors influencing the popularity trends?
To answer the stated questions, an extensive list of the most popular professional users in terms of Nf was selected and the required data collected by implementing advanced
data collection tools. Our dataset includes 8K of FanPages that have the highest number of fans validated by a third-party portal Social Bakers2.
The main contributions of this section are:
i. The proposed methodology of monitoring the popularity evolution of professional users on Facebook in very micro level is novel which is applicable to different types of OSNs.
ii. Following the methodology, we classified the users in two main groups: First, fan-attractors who grew their Nf by different patterns, and second, fan-losers, users with
a noticeable drop in their popularity trend.
iii. We found several influential factors on the popularity trend of users. The activity level of users or being celebrity are positively correlated to the trend of the number of fans.
The rest of this section is organized as follows: We present related work in Section 2 followed by Section 3.9 describing the methodology and the dataset. Section 3.10 represents a general overview of the popularity and its evolution. The model and results are discussed in Section 3.11 and finally Section 3.6 concludes this study.
3.3
Data Collection and Dataset
The objective of this study is to explore how the popularity of top professional Facebook FanPages evolves. To this end, we first selected 8K of the top Facebook FanPages based on their Nf from the previously mentioned third-party application Social Bakers which ranks
users based on the number of fans.
In order to monitor the popularity evolution of the selected users and generate a time-series of their Nf and of their activities; we implemented three crawlers as follows: Firstly,
2
CHAPTER 3. POPULARITY EVOLUTION OF PROFESSIONAL USERS 35
Table 3.1 – Dataset Characteristic
Attribute Value
Duration 14 months
Crawling Period Sep’13 - Oct’14 #Sample per day 6 snapshots (Q4h) #Users (#FanPages) 7,875 Total #Samples in dataset 20M samples Avg(#Sample) per user 1,298 samples Median(#Sample) per user 1,297 samples Total #Post in dataset 43M posts Avg(#User Post) per month 107 posts Median(#User Post) per month 24 posts
we implemented a data collection tool that queries FB public API to collect the number of fans. The data collection is performed for the selected 8K users over a period of 14 months from September 2013 to October 2014. To have enough detail, the value of Nf is recorded,
every 4 hours (6 times per day). The second crawler collects the general information of users from their profile which includes detailed information such as their pre-defined categories, description of the page, and etc. The third crawler collects the activity (published posts) of users and its associated attributes on the period of our study. A summary of dataset’s main characteristics is presented in Table 3.1.
3.4
Evolution of Popularity
Before clustering, we go through the analyzing aggregated popularity evolution of users to provide an insightful vision of the dataset. During the initial analysis, a group of users is identified who have a sudden and large peak in their Nf in a very short period of time.
By looking carefully to their data, we found that this peak reflects the impact of a newly announced service by Facebook, named GlobalPage [65]. Facebook GlobalPage is a new page structure for big brands which are active across globe and have several separate pages with the same name but active in different languages and different locations. These pages which formed almost 10% of the dataset, were excluded from it because their trend are not aligned with the aim of this study which is to identify real popularity trends and their effective factors.
3.4.1 Popularity Analysis - In Overall
Monthly popularity value is defined indicating the average value of user’s Nf in each month.
Since our dataset covers 14 months, each user has a 14-entries vector representing her popularity trend in the period of the dataset.
By considering the overall changes in Nf from M1 to M14 for each user, despite the
probable peaks and drops, 80% (5798 out of 7216) of the users attracted new fans and on the other hand 20% (1418 out of 7216) lost fans during this 14-month period. Figure 3.1 shows the distribution of users’ popularity from the first month (M1) to the last (M14). The median values for M1 and M14 distributions are 1.3 and 1.7 Millions respectively,
36 3.4. EVOLUTION OF POPULARITY
2
4
6
8
10
x 10
60
0.2
0.4
0.6
0.8
1
Number of fans
Portion of users
M1
M14
M1 M14 0 2 4 6 8x 10 6 number of fansFigure 3.1 – CDF (and boxplot with red dot representing the Mean value) of the Nf of
users in M1 and M14
which this median value increased from M1 to M14 by 30% (and 38% increment for mean value).
Figure 3.2 represents the distribution of users based on the percentage of their Nf
growth during the period of this study. As shown in the figure, the growth rate of the number of fans for pages who lost fans is not less than -20% and the major range of fans lost are between -5% and 0%. On the other hand, most of the fan-attractor pages are in the range of 10% to 30% growth and the distribution continues in a long-tailed pattern.
3.4.2 Popularity Analysis - Category Wise
Each page is assigned to a business sector by the page owner in the time of subscribing called category. To investigate the users’ distribution and overall popularity evolution inside the categories, we chose 17 (out of 158) categories those that include more than 1% of the total pages in the dataset separately and more than 75% in sum shown in Table 3.2 The main observations from Table 3.2 are as follow:
i. Musician Band is the most populated category in our dataset which shows users in this category are the most popular ones in the dataset.
ii. The percentage of average growth in the fifth column refers to the average Nf growth
CHAPTER 3. POPULARITY EVOLUTION OF PROFESSIONAL USERS 37
−20
0
0
50
100
150
200
100
200
300
400
500
600
Growth of number of fans (%)
Number of users
Figure 3.2 – Distribution of users based on the percentage of their Nf growth, during 14
months (from M1 to M14)
Actor Director, and Sports Team categories have the highest percentage of growth, and on the contrary Community has the lowest. This indicates that users in the three mentioned categories are successful in attracting new fans on average, whereas Community category users show a negative growth.
iii. The last column of the table shows the users’ median value of the Nf growth in each
category. A negative value here shows users of that category are loosing fans which means people unfollow the pages by unliking. Community is the only category which has negative median growth. This means that most of the users in this category have lost some of their fans.
3.5
Users’ Clustering
This section aims to analyse the popularity in the user level and try to identify different clusters of users with similar patterns in their popularity trends. To this end, the evolution of Nf is modeled by exploiting different clustering techniques and investigating different
characteristics (popularity range, category and activity distributions) in each identified cluster.
38 3.5. USERS’ CLUSTERING
Table 3.2 – Populated categories distribution in the dataset. Fifth and sixth columns indicate the growth rate of average and the median of Nf over 14 months respectively.
# FB Category #Pages %Pages %Avg.
growth %Median growth 1 Musician Band 1231 17 47 32 2 Community 986 13.7 2.1 -1.5 3 Tv Show 477 6.6 53 15 4 Movie 413 5.7 28 18 5 Food Beverages 302 4.2 19 11 6 Product Service 267 3.7 24 15 7 Public figure 246 3.4 64 33 8 Company 188 2.6 23 15 9 Athlete 188 2.6 101 65 10 Actor Director 179 2.5 97 50 11 Entertainment 166 2.3 26 4 12 App page 143 2.0 17 8 13 Clothing 139 1.9 29 19 14 Media News 134 1.8 76 42 15 Sports Team 125 1.7 92 60 16 Games Toys 109 1.5 13 6 17 Health Beauty 85 1.2 17 7
3.5.1 Feature Vector and Clusters
To cluster users based on the popularity attributes, a 14-entry monthly popularity vector for each user is used as a feature vector in the clustering method. The entries represent the monthly Nf of users that have values over the range of one hundred thousand to one
hundred million. The goal is to group the users with similar popularity evolution into a cluster, regardless of the value of Nf. To clarify this point, consider two FanPages from
quite different ranges of popularity, which both have 50% growth of Nf with the same
trend over the same time period. They should be assigned to a same cluster because their popularity trend are similar. To this end, we used the Min-Max normalization method which scales every feature vector into [0, 1] by obtaining the values 0 and 1 at the minimum and maximum points, respectively. The feature vectors thus represent the time-series popularity trends of users.
Next we applied several clustering algorithms including K-means [66], KSC [67] and K-shape [68] and as the outcome of all of them were similar, we consider the K-means clustering algorithm to the above-mentioned feature vectors. K-means requires the number of clusters (k) as the input parameter. There are different approaches to detect the optimal number of clusters. In this study, we used the elbow method [69], which considers the within-cluster sum of the squared errors (SSE) to find the proper k for our dataset. Figure 3.3a shows the SSE results for different k numbers applied to the dataset
CHAPTER 3. POPULARITY EVOLUTION OF PROFESSIONAL USERS 39 2 3 4 5 6 7 Number of clusters (k) 1000 1200 1400 1600 1800 2000 2200
Sum of squared error (SSE)
(a) SSE for different cluster numbers
2 3 4 5 6 7 Number of clusters (k) 0.5 0.55 0.6 0.65 0.7 0.75 0.8 0.85
Average silhouette width
(b) Silhouette width for different cluster numbers
Figure 3.3 – SSE and Silhouette width test to find the proper k value for the dataset
k to the value of 4. Then it descends slowly to 5 and continues with slower decrement. It seems that the diagram reaches an elbow at k = 4. However to be more assured of an appropriate k value, the Silhouette width [70] of different k values is also computed. The concept of silhouette width involves the difference between the within-cluster tightness and the separation from the rest of clusters.
Figure 3.3b shows the average Silhouette width for different numbers of cluster. The average Silhouette width is almost constant with k increasing from 3 to 4. This means that with k equals to 4, users are located in as right cluster as with 3. But as the SSE in Figure 3.3a has an impressive decrease with 3 clusters, we chose 4 as the proper number of clusters.
Figure 3.4 represents the normalized popularity trends for the clusters. Each plot shows the average value of the normalized Nf belonging to the users in one of the cluster. In
general, three of the identified popularity patterns are ascending by means of different behaviors, and one of them is descending. In summary we can observe the following points: i. Users are continuously losing their fans in the first cluster (Cluster-1) which includes
20% of our dataset population.
ii. The most populated cluster is the Cluster-2 by 43% of the users. It shows an ascend-ing popularity growth behavior in average. This means that the popularity of the users in this cluster is constantly increasing due to attracting new fans.
iii. Cluster-3 has 13% of the dataset population and users in this cluster show a sudden growth (around 80%) in the first half of the time and then their growth is stopped and somehow saturated in the second half.
iv. Cluster-4, with 25% of the users, shows an opposite behavior to Cluster-3. Its users show near to 30% growth in the first 7 months and then 70% during the last 7 months.
40 3.5. USERS’ CLUSTERING M2 M4 M6 M8 M10 M12 M14 0 0.2 0.4 0.6 0.8 1
Month
Normalize Popularity
Cluster−1 (20% users)Cluster−2 (43% users) Cluster−3 (12% users) Cluster−4 (25% users)
Figure 3.4 – Normalized popularity trends of four clusters
Next we characterize the identified clusters from three perspectives, their popularity, category and activity.
3.5.2 Popularity Distribution in each Cluster
This section analyzes the clustering results with respect to the users’ popularity distribu-tion. The aim is to identify how the normalized popularity trend can be affected by the absolute value of Nf. First we look to the distribution of popularity in the clusters.
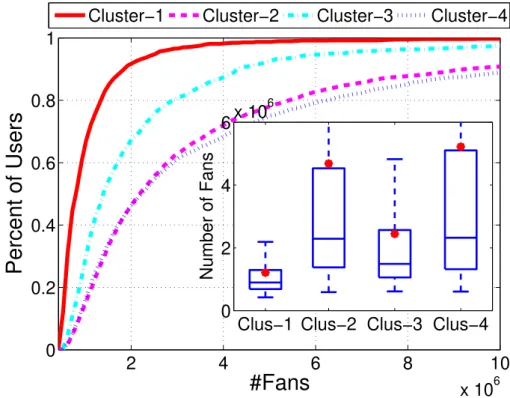
Fig-ure 3.5 shows the CDF plots of the last month (M14) users’ popularity in four identified clusters. The first interesting point in this figure is the popularity distribution of users in Cluster-1. As we saw earlier in Figure 3.4, users in this cluster are gradually losing their fans. Figure 3.5 shows most of these users are less popular than the users in other clusters. Almost 65% of them have less than 1M fans, and the number of users which have more than 2M fans does not exceed 10%.
According to this plot, three other clusters include users with much higher values of Nf. It can be observed that users in two of the most fan-attractor clusters (Cluster-2 and
Cluster-4) are more popular and have high Nf in compare to users in the other two clusters.
The median values of popularity in these two clusters are almost 2M fans. While only 30% and 10% of users in Clusters 3 and 1 have more than 2M fans.
Thus, the most popular users belong to Cluster-2 and Cluster-4, which both represent exclusively fan-attractor behaviour. In contrary, most of the less popular users are in Cluster-1 and Cluster-3, where their popularity pattern show a fan losing behavior or of being almost saturated. To conclude this section, in general more popular users show very
CHAPTER 3. POPULARITY EVOLUTION OF PROFESSIONAL USERS 41 2 4 6 8 10 x 106 0 0.2 0.4 0.6 0.8 1
#Fans
Percent of Users
Cluster−1 Cluster−2 Cluster−3 Cluster−4
Clus−1 Clus−2 Clus−3 Clus−4 0 2 4 6x 10 6 Number of Fans
Figure 3.5 – CDF (and boxplot) of the distribution of users Nf in four identified clusters.
(the red dot inside boxplot represents the Mean value of the distribution).
sharp fan attracting trends while less popular ones show fan losing or saturating trends.
3.5.3 Category Analysis
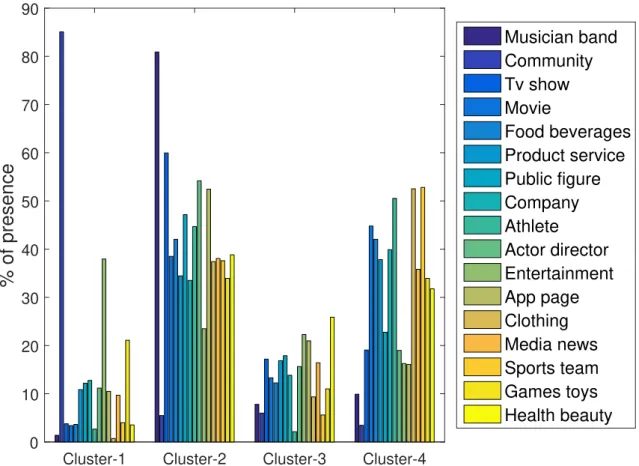
In this part we investigate the distribution of categories inside the identified clusters to understand if there are categories with a dominant population in a specific cluster. Figure 3.6 shows the distribution of the 17 most populated categories, mentioned earlier in Table 3.2, across the identified clusters.
An interesting observation from the category distribution is the high presence of the Community and Entertainment categories in Cluster-1, with around 85% and 40% portion of presence, respectively. Given that the users in this cluster are losing their fans, and the Community category is the second most populated category with 13.7% of the users in the dataset, it can be concluded that it is also the biggest set of fan-loser users. According to the Facebook3, “a Community Page is a page about an organization, celebrity or topic that it does not officially represent. It links to the official page about that topic.” Our observations show that a Community page is a place that Facebook users gather to share their ideas, images, posts around a specific topic, company, or celebrity and cannot remain attractive to users over time. One of the reason we found is the new feature of Facebook “Verified” which provide the possibility for verifying popular pages which Facebook started
3
42 3.5. USERS’ CLUSTERING
Cluster-1 Cluster-2 Cluster-3 Cluster-4
0 10 20 30 40 50 60 70 80 90
% of presence
Musician band Community Tv show Movie Food beverages Product service Public figure Company Athlete Actor director Entertainment App page Clothing Media news Sports team Games toys Health beautyFigure 3.6 – Distribution of predefined Facebook categories in each identified cluster
in May 2013. After verification, people are more likely following the verified pages instead of the community pages.
In summary, according to the popularity trend of other three clusters and category distributions of Cluster-1, we can say more than 80% of users from all categories except Community and Entertainment categories are attracting new fans.
Cluster-2, which shows a fixed rate of popularity growth, includes a high presence of Musician band and TV show categories, which are two of the three most-populated cate-gories with 17% and 6.6% of the users in the dataset. These two catecate-gories, accompanied by Actor director, contain most of the celebrities’ pages in our dataset. On the other hand, as Cluster-2 shows the most successful fan-attracting trend, we can indicate that the pages of celebrities are always interesting for people to follow. Around 30% to 50% of other cate-gories’ users also show similar pattern of attracting new fans. The distribution of categories in Cluster-3 shows almost an equal presence of all categories without any dominant one, except a minimum presence of Athlete categories. The trend of this cluster could have different explanations like fan-saturation, reduction of the activity or external events which have the same side effect on users in different categories. In the next section, we look for the effect of activity volume on users’ fan-trends as a probable influential factor.
CHAPTER 3. POPULARITY EVOLUTION OF PROFESSIONAL USERS 43
Cluster-4, which includes 25% of our users, has a variety of categories distribution. Three categories, Athlete, Clothing, and Sport team have more than 50% of their population in this cluster. According to the popularity pattern of this cluster, most of the users experienced more than 70% of their popularity growth in the second half of the study period. Some famous celebrities such as Neymar (Football player), Real Madrid C.F. (Sport team) are in this cluster. For users such as those related to football, the most probable reason of significant Nf growth may be the main events of European leagues
which are overlapped with the second half of our dataset period.
As a summary of this part, we saw that Community is characterized as the most fan-losing category with a major presence in Cluster-1. The categories containing more celebrities are the most fan-attracting ones, with a significant presence in the two most fan-attractor clusters, Cluster-2 and Cluster-4.
3.5.4 Activity Analysis
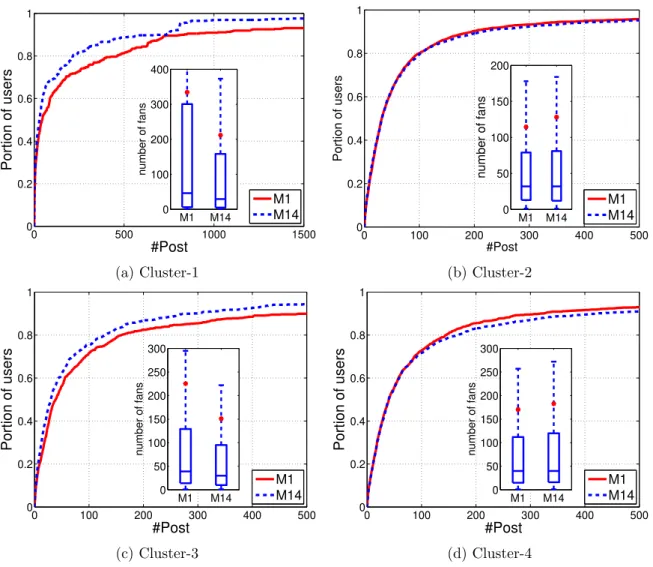
Being active in Facebook by continuously publishing new posts, can ensure professional users to stay in touch with their followers and attract new ones as well [21]. To understand the impact of activity on popularity, Figure 3.7 shows the CDF plots of the number of published posts by users in four clusters for M1 and M14. It illustrates that the published posts of the users in Cluster-1, who lost their fans, declined from M1 to M14. This can be observed for the distribution of users in Cluster-3 as well (Figure 3.7c). As discussed before, the Nf of users in this cluster is almost constant for the second half of the study
period. It can be concluded that the reduced number of activity in these two clusters is an important factor for the lost of fans in Cluster-1 and the failure to attract new ones in Cluster-3.
In contrast, the activity level of users have not changed substantially in the two most fan-attracting clusters, Cluster-2 and Cluster-4. Even we can see a small increment in the activity curve of Cluster-4; the number of users who published more than 150 posts in the last month is greater than the number of users who posted that much in the first month. Considering their popularity trends which show a continuous growth, it can be deducted that being constantly active effect the process of attracting new fans.
In a nutshell, we observe that staying active in terms of publishing posts can help to attract new fans and followers whereas reducing the activity level can lead to stagnant number of followers, and even losing fans.
3.6
Conclusion
This research studied the users popularity evolution in online social networks with a focus on professional users such as companies, celebrities, brands, and etc. To this end, the number of fans of almost 8K of the most popular professional users was collected in six daily snapshots, over a period of 14 months. The users’ published posts were also collected in the same time period, which eventually provided around 20 million snapshots of popularity values. The experiments conducted on this data reveal interesting results. Users were categorized into two main groups fan-losers and fan-attractors, and four different patterns of popularity
44 3.6. CONCLUSION 0 500 1000 1500 0 0.2 0.4 0.6 0.8 1 #Post Portion of users M1 M14 M1 M14 0 100 200 300 400 number of fans (a) Cluster-1 0 100 200 300 400 500 0 0.2 0.4 0.6 0.8 1 #Post Portion of users M1 M14 M1 M14 0 50 100 150 200 number of fans (b) Cluster-2 0 100 200 300 400 500 0 0.2 0.4 0.6 0.8 1 #Post Portion of users M1 M14 M1 M14 0 50 100 150 200 250 300 number of fans (c) Cluster-3 0 100 200 300 400 500 0 0.2 0.4 0.6 0.8 1 #Post Portion of users M1 M14 M1 M14 0 50 100 150 200 250 300 number of fans (d) Cluster-4
Figure 3.7 – CDF (and BoxPlot) of number of published posts per user in the first (M1) and last (M14) months of the dataset (red dot in boxplot represents the Mean value of the distribution).
evolution were identified. Several factors are identified that influence the popularity trend of users, such as the social position like celebrities, external events associated to the owner of the page, and the level of activity. The findings from this study provide a comprehensive view on professional users’ popularity evolution, and reveal the impact of different factors on it.
This study only analyzed professional Facebook users. The analysis of cross-popularity of these users on other major social networks, e.g. Twitter, Instagram, etc., can be consid-ered as a future work. Beside the activity and external events, it could be very interesting to look on other potential influential factors such as specific strategies that users are fol-lowing in social media. Providing a comprehensive list of suggestions for users to enhance their success in social media can also be an extension of this work.
![Figure 2.1 – The Skip-gram model architecture for predicting surrounding words given the current word w(t) [1].](https://thumb-eu.123doks.com/thumbv2/123doknet/11409162.288199/27.892.209.640.209.402/figure-skip-model-architecture-predicting-surrounding-words-current.webp)