HAL Id: hal-00295822
https://hal.archives-ouvertes.fr/hal-00295822
Submitted on 20 Jan 2006
HAL is a multi-disciplinary open access
archive for the deposit and dissemination of
sci-entific research documents, whether they are
pub-lished or not. The documents may come from
teaching and research institutions in France or
abroad, or from public or private research centers.
L’archive ouverte pluridisciplinaire HAL, est
destinée au dépôt et à la diffusion de documents
scientifiques de niveau recherche, publiés ou non,
émanant des établissements d’enseignement et de
recherche français ou étrangers, des laboratoires
publics ou privés.
transfer models used for the interpretation of
ground-based zenith-sky and multi-axis DOAS
observations
F. Hendrick, M. van Roozendael, A. Kylling, A. Petritoli, A. Rozanov, S.
Sanghavi, R. Schofield, C. von Friedeburg, T. Wagner, F. Wittrock, et al.
To cite this version:
F. Hendrick, M. van Roozendael, A. Kylling, A. Petritoli, A. Rozanov, et al.. Intercomparison exercise
between different radiative transfer models used for the interpretation of ground-based zenith-sky and
multi-axis DOAS observations. Atmospheric Chemistry and Physics, European Geosciences Union,
2006, 6 (1), pp.93-108. �hal-00295822�
SRef-ID: 1680-7324/acp/2006-6-93 European Geosciences Union
Chemistry
and Physics
Intercomparison exercise between different radiative transfer
models used for the interpretation of ground-based zenith-sky and
multi-axis DOAS observations
F. Hendrick1, M. Van Roozendael1, A. Kylling2,*, A. Petritoli3, A. Rozanov4, S. Sanghavi5, R. Schofield6,**, C. von Friedeburg5, T. Wagner5, F. Wittrock4, D. Fonteyn1, and M. De Mazi`ere1
1Institut d’A´eronomie Spatiale de Belgique, Brussels, Belgium 2Norwegian Institute for Air Research, Kjeller, Norway 3Institute of Atmospheric Science and Climate, Bologna, Italy
4Institute of Environmental Physics, University of Bremen, Bremen, Germany 5Institute of Environmental Physics, University of Heidelberg, Heidelberg, Germany
6National Institute of Water and Atmospheric Research, Omakau, Central Otago, New Zealand *now at: St. Olavs University Hospital, Trondheim, Norway
**now at: NOAA Aeronomy Laboratory, Boulder, Colorado, USA
Received: 30 June 2005 – Published in Atmos. Chem. Phys. Discuss.: 2 September 2005 Revised: 29 November 2005 – Accepted: 13 December 2005 – Published: 20 January 2006
Abstract. We present the results of an intercomparison exer-cise between six different radiative transfer (RT) models car-ried out in the framework of QUILT, an EU funded project based on the exploitation of the Network for the Detection of Stratospheric Change (NDSC). RT modelling is an important step in the interpretation of Differential Optical Absorption Spectroscopy (DOAS) observations. It allows the conversion of slant column densities (SCDs) into vertical column densi-ties (VCDs) using calculated air mass factors (AMFs). The originality of our study resides in comparing SCD simula-tions in multi-axis (MAX) geometry (trace gases: NO2and HCHO) and in taking into account photochemical enhance-ment for calculating SCDs of rapidly photolysing species (BrO, NO2, and OClO) in zenith-sky geometry. Concerning the zenith-sky simulations, the different models agree gener-ally well, especigener-ally below 90◦SZA. At higher SZA, larger discrepancies are obtained with relative differences ranging between 2% and 14% in some cases. In MAX geometry, good agreement is found between the models with the calcu-lated NO2and HCHO SCDs differing by no more than 5% in the elevation and solar zenith angle (SZA) ranges inves-tigated (5◦–20◦and 35◦–85◦, respectively). The impacts of aerosol scattering, ground albedo, and relative azimuth on MAX simulations have also been tested. Significant discrep-ancies appear for the aerosol effect, suggesting differences between models in the treatment of aerosol scattering. A bet-Correspondence to: F. Hendrick
ter agreement is found in case of the ground albedo and rel-ative azimuth effects. The complete set of initialization data and results have been made publicly available through the QUILT project web site (http://nadir.nilu.no/quilt/), enabling the testing of other RT codes designed for the calculation of SCDs/AMFs.
1 Introduction
Since the middle of the 1970s, stratospheric ozone and sev-eral trace gases directly or indirectly involved in the ozone depletion like NO2, BrO, and OClO have been monitored from the ground using the Differential Optical Absorption Spectroscopy (DOAS)-technique (Platt, 1994). A significant part of this monitoring effort has been carried out through the framework of the Network for the Detection of Strato-spheric Change (NDSC). The NDSC consists of about 75 globally distributed stations combining various observation techniques. The network operation started in January 1991 and has been providing a consistent, standardised set of long-term measurements of stratospheric and, more recently, tro-pospheric trace gases, particles, and physical parameters for detecting atmospheric change, validating space-borne sen-sors, and testing and improving multidimensional models of both the stratosphere and troposphere (further information at http://www.ndsc.ncep.noaa.gov/). Concerning the scattered sunlight DOAS instruments, they operated until recently
almost only in zenith-sky geometry, thus probing mainly the altitude region corresponding to the stratosphere, especially at large solar zenith angles (SZAs). Over the last decade, new instruments pointing not only at zenith but also towards the horizon (off-axis geometry) have been developed (e.g., Heckel et al., 2005; H¨onninger et al., 2004; Wagner et al., 2004; Wittrock et al., 2004). Pointing at an elevation angle close to the horizon provides enhanced sensitivity to the tro-posphere compared to zenith-sky observations. The Multi-AXis (MAX-) DOAS technique combines different elevation angles. Owing to the variation of the light paths in the tro-posphere with the elevation angle, the different viewing di-rections have maximum sensitivity at different altitudes, thus providing some information on the vertical distribution of the absorber.
An important step in the interpretation of DOAS observa-tions is the conversion of the slant column densities (SCDs) – which are the direct product of the DOAS analysis – into vertical column densities (VCDs) using calculated air mass factors (AMFs). The AMF represents the ratio of the effec-tive optical path through the atmosphere to the vertical opti-cal path and is given by the ratio SCD/VCD (Noxon et al., 1979; Solomon et al., 1987). In practice, AMFs are calcu-lated using a radiative transfer (RT) model. In case of short lived species such as BrO, OClO, and NO2, the calculation of SCDs and therefore AMFs is complicated by the varia-tion of the concentravaria-tion of these species along a given light path due to the fast diurnal variation of these radicals cou-pled to the local SZA variation along the light path (Fish et al., 1995). This so-called photochemical enhancement effect is taken into account by initializing RT models with a table containing the concentrations of the absorber for different al-titudes and SZAs. This table is then interpolated to determine the trace gas concentrations at the altitudes and local SZAs of the different scatter points considered along a given sun ray path. Such a concentration table is usually generated by run-ning a stacked box photochemical model initialized with the output of a 3-D chemical transport model (CTM) correspond-ing to the day and location of interest. SCDs calculated by coupling a 3-D CTM to a photochemical box-/RT model in-terface can also be directly compared to observed SCDs. For example, Sinnhuber et al. (2002) compared ground-based zenith-sky UV-visible observations of BrO obtained at 11 sites with simulations from the 3-D CTM SLIMCAT (Chip-perfield, 1999). The RT model used was based on the sin-gle scattering ray tracing scheme of Solomon et al. (1987). Recently, several groups have initiated AMF calculations in order to interpret MAX-DOAS measurements. H¨onninger et al. (2004) have studied the behaviour of AMFs as a func-tion of the solar zenith, elevafunc-tion, and relative azimuth an-gles, ground albedo, and aerosol loading for several ideal-ized trace gas profiles. For this purpose, they have used the RT model TRACY based on a Monte Carlo approach (von Friedeburg, 2003). This model has been also used by Wagner et al. (2004) to perform RT modelling for MAX-DOAS O4
observations at different aerosol conditions. Sensitivity tests on O4AMFs were carried out by Wittrock et al. (2004) with SCIATRAN, a RT code based on a combined differential-integral approach involving the Picard iterative approxima-tion (CDIPI) (Rozanov et al., 2000, 2001, 2005) and, as a first application, NO2profile information were derived from MAX-DOAS observations. It should be noted that an accu-rate RT model as forward model is essential in the retrieval of tropospheric trace gas profiles using MAX-DOAS mea-surements (e.g., Bruns et al., 2004). In Heckel et al. (2005), the SCIATRAN model also generated appropriate AMFs for the conversion of MAX-DOAS measurements of HCHO into VCDs. These examples show that RT modelling plays a cen-tral role in the interpretation of ground-based DOAS obser-vations and that different RT computation schemes are avail-able for this purpose.
The QUILT (Quantification and Interpretation of Long-Term UV-Vis Observations of the Stratosphere) project is an EU funded project based on the exploitation of the NDSC and aimed at quantifying ozone loss and investigating its re-lation to active halogen and nitrogen species using the ex-isting ground-based, satellite and balloon borne UV-visible data as well as 3-D atmospheric modelling tools. One of the tasks of this project has been to test the consistency be-tween the different RT models existing within the consortium and used to interpret the ground-based and satellite DOAS data. This objective has been achieved through several SCD simulations comparison tests performed using identical set-tings for all the models. Both ground-based zenith-sky (trace gases: BrO, NO2, and OClO) and MAX geometries (trace gases: NO2and HCHO) have been considered for these tests, with photochemical enhancement being taken into account only in zenith-sky geometry.
Here we report on the results of this intercomparison ex-ercise. It should be noted that our study does not address the issue of the absolute accuracy of the SCD calculations, the consistency between simulated and measured SCDs hav-ing already been tested in several papers (e.g., Sinnhuber et al., 2002; Tørnkvist et al., 2002). It can be considered to a certain extent as the continuation of Sarkissian et al. (1995) who calculated O3and NO2AMFs with different RT mod-els in zenith-sky geometry but without taking into account the photochemical enhancement effect (use of a single pro-file for the initialization of the models). Our paper is divided into five parts. In Sect. 2, we describe the different RT mod-els involved in the intercomparison exercise. The compari-son tests in zenith-sky and MAX geometries are described in Sects. 3 and 4, respectively, and their corresponding results are discussed therein. Sects. 5 and 6 are dedicated to the impact of aerosols and ground albedo on MAX simulations, respectively.
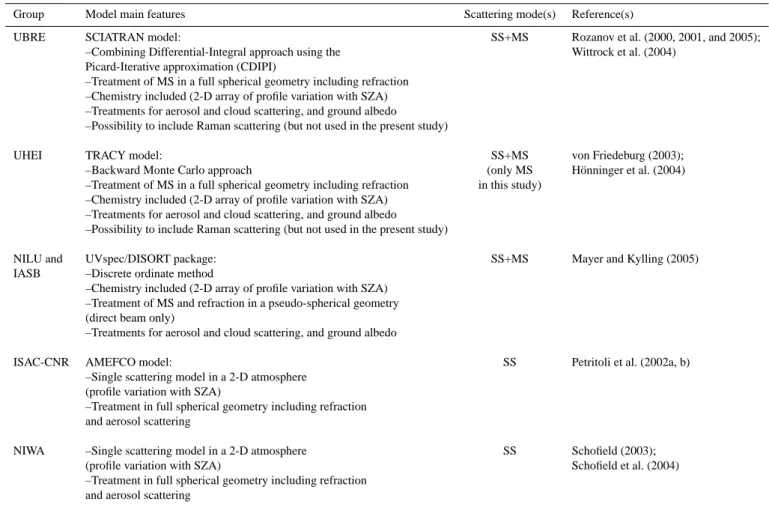
Table 1. Short description of the RT models involved in the intercomparison exercise. Note that both IASB and NILU models are based on the UVspec/DISORT package. However, they are not strictly identical since they have been adapted separately by each group in order to allow SCD/AMF calculations taking into account photochemical enhancement.
Group Model main features Scattering mode(s) Reference(s)
UBRE SCIATRAN model: SS+MS Rozanov et al. (2000, 2001, and 2005); –Combining Differential-Integral approach using the Wittrock et al. (2004)
Picard-Iterative approximation (CDIPI)
–Treatment of MS in a full spherical geometry including refraction –Chemistry included (2-D array of profile variation with SZA) –Treatments for aerosol and cloud scattering, and ground albedo
–Possibility to include Raman scattering (but not used in the present study)
UHEI TRACY model: SS+MS von Friedeburg (2003); –Backward Monte Carlo approach (only MS H¨onninger et al. (2004) –Treatment of MS in a full spherical geometry including refraction in this study)
–Chemistry included (2-D array of profile variation with SZA) –Treatments for aerosol and cloud scattering, and ground albedo
–Possibility to include Raman scattering (but not used in the present study)
NILU and UVspec/DISORT package: SS+MS Mayer and Kylling (2005) IASB –Discrete ordinate method
–Chemistry included (2-D array of profile variation with SZA) –Treatment of MS and refraction in a pseudo-spherical geometry (direct beam only)
–Treatments for aerosol and cloud scattering, and ground albedo
ISAC-CNR AMEFCO model: SS Petritoli et al. (2002a, b) –Single scattering model in a 2-D atmosphere
(profile variation with SZA)
–Treatment in full spherical geometry including refraction and aerosol scattering
NIWA –Single scattering model in a 2-D atmosphere SS Schofield (2003); (profile variation with SZA) Schofield et al. (2004) –Treatment in full spherical geometry including refraction
and aerosol scattering
2 Description of the RT models
The groups contributing RT calculations to the intercompari-son exercise were the remote sensing groups at the Universi-ties of Bremen (UBRE) and Heidelberg (UHEI), the Norwe-gian Institute for Air Research (NILU), the Institute of At-mospheric Science and Climate (ISAC-CNR), the National Institute of Water and Atmospheric Research (NIWA), and the Institut d’A´eronomie Spatiale de Belgique (IASB). A summary of the characteristics of the models used by these groups is given in Table 1. From now on, each model will be referred to by the acronym of its corresponding group (in brackets here above). All models include the possibility of taking into account photochemical enhancement. The solu-tion approaches to the RT equasolu-tion (RTE) used in the differ-ent RT codes are as follows:
• The Combined Differential-Integral (CDI) approach (UBRE model): is based on the solution of the integral
RT equation using the characteristics method (Currant and Hilbert, 1962). The source function is integrated along the line of sight intersecting a spherical atmo-sphere. The single scattering part of the source function is calculated truly spherical and the multiple scattering part is initialized by the output of the pseudo-spherical model (Rozanov et al., 2000 and 2001).
• The Discrete Ordinate method (NILU and IASB mod-els): the azimuth dependence of the radiation field is expressed as a Fourier cosine series in azimuth. The solution of the Fourier components is obtained using a numerical quadrature scheme, allowing to replace the integrals by sums and thus reducing the RTE to the so-lution of a set of coupled linear first-order differential equations (Lenoble, 1985; Stamnes et al., 1988; Spurr, 2001).
• The backward Monte Carlo method (UHEI model): a photon emerges from a detector in an arbitrary line of
Fig. 1. Contour plot of the BrO profiles table used to initialize the models in the comparison test in zenith-sky geometry. The variation of the BrO profiles as a function of the SZA has been calculated for Harestua (60◦N, Norway) at sunset under chlorine activated condi-tions.
Fig. 2. Contour plot of the OClO profiles table used to initialize the models in the comparison test in zenith-sky geometry. The varia-tion of the OClO profiles as a funcvaria-tion of the SZA has been calcu-lated for Harestua (60◦N, Norway) at sunset under chlorine acti-vated conditions.
sight direction and is followed in the backward direction along the path towards the sun. The various events which may happen to the photon at various altitudes in the atmosphere are defined by suitable probability dis-tributions. Random numbers decide on the occurrence of events. At the location of the last scattering event prior to leaving the atmosphere, the impinging radiance
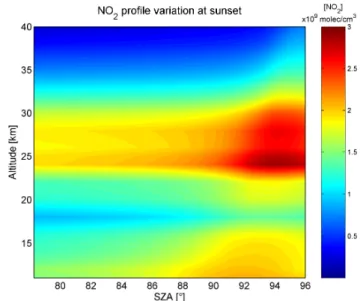
Fig. 3. Contour plot of the NO2profiles table used to initialize the models in the comparison test in zenith-sky geometry. The variation of the NO2profiles as a function of the SZA has been calculated for Harestua (60◦N, Norway) at sunset in summer.
is calculated and weighted with the value of the scatter-ing phase function and with the attenuation of the com-plete path. A large number of such random photon paths will reproduce the light contributing to the simulated measurement (von Friedeburg, 2003; Lenoble, 1985).
• Single scattering ray tracing method (ISAC-CNR and NIWA models): in zenith-sky geometry, it consists of computing the attenuation from the sun through discrete spherical atmospheric shells to “points” where the light beams are scattered into the detector (Solomon et al., 1987).
3 Zenith-sky simulations of BrO, NO2, and OClO SCDs
including photochemical enhancement 3.1 Comparison test description
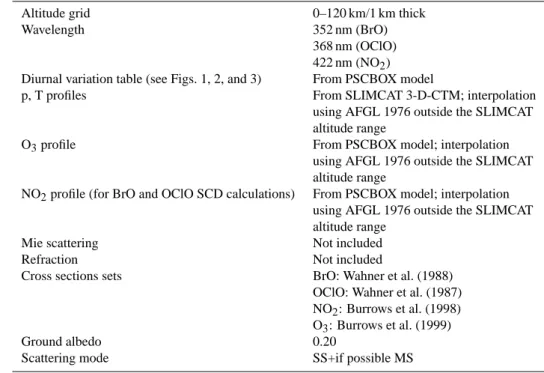
In this test, BrO, OClO, and NO2 SCDs have been calcu-lated in zenith-sky geometry in single scattering (SS) and, when possible, in multiple scattering (MS) modes, taking into account photochemical enhancement effect. The set-tings imposed for all models are summarized in Table 2. Contour plots of the diurnal variation tables (concentration of BrO, OClO, and NO2as a function of altitude and SZA) are shown in Figs. 1, 2, and 3, respectively. They are the output of the stacked box photochemical model PSCBOX (Errera and Fonteyn, 2001; Hendrick et al., 2000 and 2004) initialized with the 3-D-CTM SLIMCAT chemical and me-teorological fields. Two scenarios have been considered: Harestua (60◦N, Norway) at sunset in summer for NO2SCD
Table 2. Model settings for the comparison test in zenith-sky geometry. All the initialization data are available on the QUILT web site (http://nadir.nilu.no/quilt/).
Altitude grid 0–120 km/1 km thick
Wavelength 352 nm (BrO)
368 nm (OClO) 422 nm (NO2) Diurnal variation table (see Figs. 1, 2, and 3) From PSCBOX model
p, T profiles From SLIMCAT 3-D-CTM; interpolation
using AFGL 1976 outside the SLIMCAT altitude range
O3profile From PSCBOX model; interpolation
using AFGL 1976 outside the SLIMCAT altitude range
NO2profile (for BrO and OClO SCD calculations) From PSCBOX model; interpolation using AFGL 1976 outside the SLIMCAT altitude range
Mie scattering Not included
Refraction Not included
Cross sections sets BrO: Wahner et al. (1988)
OClO: Wahner et al. (1987) NO2: Burrows et al. (1998) O3: Burrows et al. (1999)
Ground albedo 0.20
Scattering mode SS+if possible MS
calculations and Harestua at sunset under chlorine activated conditions for BrO and OClO. All calculations included ab-sorption by O3and, in case of BrO and OClO, also absorp-tion by NO2.
3.2 Results
The results of the zenith-sky simulations of BrO, NO2, and OClO SCDs are presented in Fig. 4. We first concentrate on the general behaviour of the simulated SCDs. Figure 4 shows that the impact of MS is more important for BrO than for NO2, and for OClO, it is mostly significant at large SZA (>92◦). The different behaviours of BrO and NO2 re-garding MS effects can be mainly attributed to the different wavelengths used for both calculations (352 nm for BrO and 422 nm for NO2). In case of OClO, the large impact of MS at SZAs larger than ∼92◦is related to the photochemistry of this species combined with geometrical considerations. Fig-ure 2 shows that OClO is situated in the ∼17–22 km altitude range and only appears at SZAs>92◦. At these SZAs, the
absorption due to OClO along a given line of sight occurs where the local SZA is largest, i.e. near the vertical above the observing point. Thus, a significant part of the OClO layer is likely to be in the Earth’s shadow region where mul-tiply scattered light has a stronger relative impact. This ex-plains why the OClO SCDs are so sensitive to MS in these conditions. The differences between the photochemical be-haviours of BrO, NO2, and OClO are also manifest from
Fig. 4. BrO SCDs show a sharp decrease above ∼92◦SZA (see Fig. 1), consistent with the rapid conversion of BrO into its night-time reservoirs (mostly BrCl in the present case) in the absence of sunlight. In contrast, the concentrations of OClO and NO2 increase with SZA (see Figs. 2 and 3, re-spectively), which explains the persistence of relatively large SCD values at corresponding SZAs, especially in MS mode. However, OClO and NO2SCDs also decrease at very high SZAs. This decrease happens when the mean scattering al-titude moves above the trace gas layer. The SZA where the maximum SCD is reached is thus determined by a combi-nation of photochemistry and altitude range of the trace gas layer.
Concerning the comparison of simulated SCDs, the rel-ative differences between the results of the different mod-els and those of IASB arbitrarily taken as reference, ap-pear in the lower plots of Fig. 4 and a summary of the maximum differences found is presented in Table 3. In SS mode, good agreement is obtained below 90◦SZA between
the NIWA, IASB, NILU, and UBRE models: for the three species, the relative difference between the NIWA, NILU, and UBRE models and the IASB one (reference model) is smaller than 1%. However, the SCDs simulated by the ISAC-CNR model are systematically larger and the relative dif-ferences rise up to 4% for BrO, 5% for NO2 and 7.5% for OClO. Above 90◦SZA, the agreement between the NIWA, IASB, UBRE, and NILU models is still very good with rel-ative differences smaller than 1.8% for BrO, 1.3% for NO2,
NO
2OClO
BrO
74 78 82 86 90 94 −10 −5 0 5 10 15 SZA [°] 74 78 82 86 90 94 0 2 4 6 8 10 12 SZA [°] NO 2 SCD [x10 16 molec/cm 2] Harestua − 19/06/99 − PM IASB SS IASB MS NILU SS NILU MS NIWA SS ISAC SS UBRE SS UBRE MS UHEI MS 74 78 82 86 90 94 0 0.5 1 1.5 2 2.5 3 3.5 4 SZA [°] OClO SCD [x10 14 molec/cm 2] Harestua − 28/01/00 − PM 74 78 82 86 90 94 0 0.5 1 1.5 2 2.5 3 3.5 4 SZA [°] BrO SCD [x10 14 molec/cm 2] Harestua − 28/01/00 − PM 74 78 82 86 90 94 −10 −5 0 5 10 15 SZA [°] Relative difference [%] 74 78 82 86 90 94 −10 −5 0 5 10 15 SZA [°] NILU SS−IASB SS NIWA SS−IASB SS ISAC SS−IASB SS UBRE SS−IASB SS NILU MS−IASB MS UBRE MS−IASB MS UHEI MS−IASB MSFig. 4. Sunset BrO, NO2, and OClO SCDs calculated in the comparison test in zenith-sky geometry. The upper plots correspond to the SCDs and the lower plots to the relative differences between the results from the different models and those from the IASB model arbitrarily chosen as reference. Solid and dashed lines correspond to calculations in SS and MS modes, respectively. Note that the UHEI OClO data are missing (see Sect. 3.2) and in the upper plots, the blue, red, and cyan solid lines corresponding to, respectively, the IASB, NILU, and NIWA SCD calculations in SS mode are almost superimposed.
Table 3. Maximum relative differences obtained between the dif-ferent RT models and the IASB one – arbitrarily taken as reference – for the comparison test in zenith-sky geometry. Note that the SS and MS models have been compared to the IASB model in SS and MS modes, respectively. BrO [%] NO2[%] OClO [%] NILU SS +1.0 +0.5 +2.1 ISAC SS +4.1 +7.1 +14.3 NIWA SS +1.5 +0.7 +1.6 UBRE SS +1.8 +1.3 −1.4 NILU MS +5.8 +2.7 +6.6 UHEI MS −5.0 +5.5 – UBRE MS −1.0 −0.6 −4.2
and 2.1% for OClO. A maximum spread between models of about 2% is a better agreement than obtained by Sarkissian et al. (1995) without taking into account photochemical en-hancement (from Sarkissian et al. (1995), the maximum spread values rise up to 13% for O3 and 8% for NO2 at 94◦SZA). Concerning the ISAC-CNR simulations above 90◦ SZA, the discrepancies with the IASB model are larger than for the NIWA and NILU models: the relative differences are smaller than 4% for BrO and rise up to 7.1% for NO2, and 14.3% for OClO. Although these maximum relative differ-ences are consistent with those of Sarkissian et al. (1995), they suggest that the ISAC-CNR model differs from the other models in the way the optical thickness of each atmospheric shell is calculated. Sarkissian et al. (1995) investigated the influence of the different methods used to interpolate the con-centration and to calculate the geometrical path in individ-ual shells. They found that the impact of these parameters
increases with increasing SZA and can reach 4% above 90◦
SZA. Since photochemical enhancement is included in the present test, we cannot neglect the impact of differences in interpolating the tables of photochemical species concentra-tions. This effect is consistent with the increase in the relative differences between the models with increasing SZA since the step between the SZA values corresponding to the con-centration tables is increasing at large SZAs, due to the fact that the stacked box photochemical model PSCBOX pro-vides output with a constant time step. Concerning the cal-culations in MS mode, the agreement below 90◦ SZA be-tween the NILU, IASB, UBRE, and UHEI models is good since the relative differences with the IASB model results are smaller than 4.4%. Above 90◦SZA, slightly larger dis-crepancies are generally found, as in SS mode, and the max-imum relative differences with the IASB model results rise up to 6.6% for the NILU model (obtained for OClO SCD calculations), 5.5% for the UHEI model (obtained for NO2 SCD calculations), and 4.2% for the UBRE model (obtained for OClO SCD calculations). It should be noted that UHEI OClO data are absent from the comparison. This is caused by the fact that too many photons (around 105) would have been required to calculate each SCD with sufficient accuracy and precision. In contrast to the NO2or BrO profile, strato-spheric OClO is usually confined to a layer of only a few kilometres thickness, and the concentration gradient is very high at its lower and upper ends (see Fig. 2). The Monte Carlo nature of the UHEI model causes statistical fluctua-tions (from photon path to photon path) of the altitude of the first scattering event the photon encounters after atmosphere entry. If this event occurs above the OClO layer, then the path through this layer is short. If the event occurs within the OClO layer, the light path through this layer is long. If the event occurs below the OClO layer, then the path through the layer has also been long, though shorter than in the second case. Accordingly, small variations in the altitude of the first scattering event, arising from statistical fluctuations, lead to large variations in path length and hence to large fluctuations in the simulated SCD. This noise can only be reduced with a very large number of modelled photons, which causes the UHEI model to be inefficient for this specific kind of sce-nario. With the expected increase in computational power, this disadvantage is likely to become less significant in the near future.
4 Multi-axis simulations of NO2and HCHO SCDs 4.1 Comparison test description
In contrast to the zenith-sky simulations, photochemical en-hancement has not been taken into account in the MAX sim-ulations. The reason is that this effect becomes significant only during twilight, i.e. above 85◦SZA, and we have limited our comparison to the 38◦–85◦SZA range because the
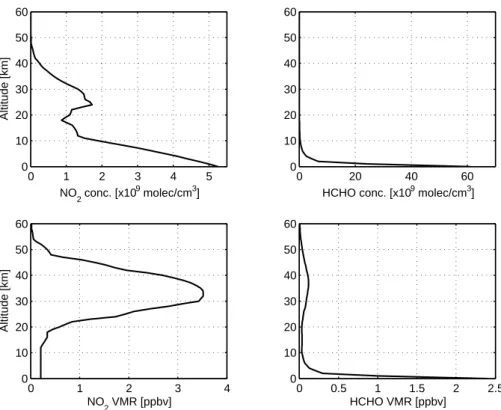
sen-sitivity of the MAX-DOAS observations to the troposphere is largest during daytime, i.e. at small SZA. The NO2 and HCHO profiles used for the initialization of the models are shown in Fig. 5. All calculations included absorption by O3 and in case of HCHO, also absorption by NO2. SCD simu-lations have been performed for 5◦, 10◦, and 20◦elevation above the horizon. For each elevation angle, four values of the azimuth angle of line of sight (AzLOS) have been con-sidered: 30◦, 60◦, 90◦, and 120◦. The AzLOS is the relative azimuth angle between the pointing direction of the instru-ment and the sun azimuth. The other settings are shown in Table 4. Concerning the HCHO SCD calculations, the layer thickness in the altitude range where the concentration of this species changes rapidly with altitude (0–3 km) has been fixed to 0.2 km instead of the 1 km thickness used in case of NO2, reducing interpolation effects. Only models enabling cal-culations in MS mode have been involved in this test since MS is the only acceptable scattering mode in MAX geome-try (Wittrock et al., 2004). These models are: IASB, NILU, UBRE and UHEI.
4.2 Results
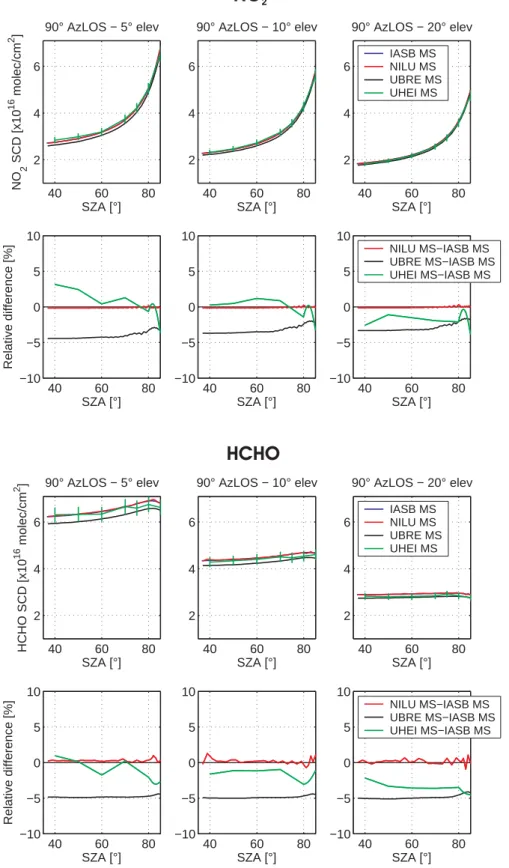
Figure 6 shows the results of the NO2and HCHO SCD sim-ulations for 5◦, 10◦, and 20◦ elevation and 90◦ AzLOS. A summary of the maximum differences between the different models and the IASB one (again taken arbitrarily as refer-ence model) is also presented in Table 5. The agreement between IASB, NILU, UBRE and UHEI is good: when com-paring the results for both species over the whole SZA range and for all the elevation angles, the relative differences be-tween the NILU, UBRE, and UHEI models and the IASB one are smaller than 5.1%. Concerning the UBRE model, it underestimates the IASB model results by at most 4.5% for NO2 and 5.1% for HCHO. Furthermore, the relative differ-ences are also almost constant over the whole SZA range. This is in contrast to the relative differences between the UHEI and IASB models which show a SZA dependence, especially at low elevation angles: e.g., for NO2 at 5◦ ele-vation, the UHEI model results overestimate the IASB ones by 3% at 40◦SZA and underestimate them by 3.6% at 85◦ SZA. However, with maximum relative differences of 3.8% for NO2and 4.5% for HCHO (see Table 5), the agreement between both models is good. As expected since they are both based on the UVspec/DISORT package, the NILU and the IASB models agree very well: for both NO2and HCHO, the relative difference between the results of both models is smaller than 1.3% over the entire SZA range and for all ele-vation angles.
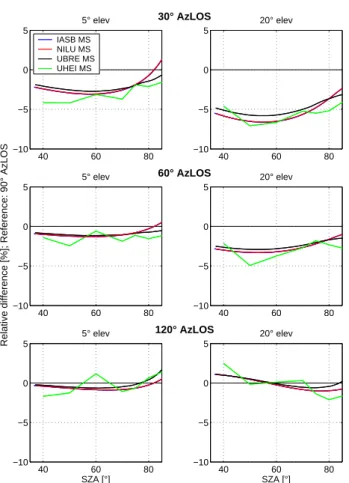
The impact of the relative azimuth has been tested by cal-culating NO2and HCHO SCDs for different AzLOS values (30◦, 60◦, 90◦, and 120◦). The AzLOS effect on NO2SCDs is illustrated in Fig. 7 where the relative differences between the NO2SCDs at 30◦, 60◦, and 120◦AzLOS and the SCD at 90◦AzLOS (reference) are plotted as a function of SZA
0 1 2 3 4 5 0 10 20 30 40 50 60 NO 2 conc. [x10 9 molec/cm3] Altitude [km] 0 20 40 60 0 10 20 30 40 50 60
HCHO conc. [x109 molec/cm3]
0 1 2 3 4 0 10 20 30 40 50 60 NO 2 VMR [ppbv] Altitude [km] 0 0.5 1 1.5 2 2.5 0 10 20 30 40 50 60 HCHO VMR [ppbv]
Fig. 5. NO2(left) and HCHO (right) profiles in concentration (upper plots) and VMR (lower plots) used to initialize the RT models in the comparison tests in MAX geometry.
Table 4. Model settings for the comparison test in MAX geometry. It should be noted that the same settings are used for the tests on aerosols effect (except Mie scattering is then included; see Sect. 5) and ground albedo effect (with the ground albedo value then fixed to 0 and 0.9 instead of 0.2; see Sect. 6). All the initialization data are available on the QUILT web site (http://nadir.nilu.no/quilt/).
Altitude grid NO2: 0–120 km/1 km thick
HCHO: 0–120 km/0.2 km thick between 0 and 3 km and 1 km thick above 3 km
Wavelength 356 nm (HCHO)
422 nm (NO2)
p, T profiles From SLIMCAT 3-D-CTM; interpolation using AFGL 1976 outside the SLIMCAT altitude range
O3profile From PSCBOX model; interpolation using
AFGL 1976 outside the SLIMCAT altitude range NO2profile (for HCHO SCD calculations) From PSCBOX model; interpolation using
AFGL 1976 outside the SLIMCAT altitude range HCHO and NO2profiles (see Fig. 5) HCHO: Barbe et al. (1979);
Ehhalt and T¨onnißen (1979) NO2: from PSCBOX model
Mie scattering Not included
Refraction Not included
Cross sections sets HCHO: Cantrell et al. (1990) NO2: Burrows et al. (1998) O3: Burrows et al. (1999)
Ground albedo 0.20
Elevation angle 5◦, 10◦, and 20◦ Azimuth angle of line of sight 30◦, 60◦, 90◦, and 120◦
NO
2HCHO
40 60 80 2 4 6 SZA [°] NO 2 SCD [x10 16 molec/cm 2 ] 90° AzLOS − 5° elev 40 60 80 2 4 6 SZA [°] 90° AzLOS − 10° elev 40 60 80 2 4 6 SZA [°] 90° AzLOS − 20° elev IASB MS NILU MS UBRE MS UHEI MS 40 60 80 −10 −5 0 5 10 SZA [°] Relative difference [%] 40 60 80 −10 −5 0 5 10 SZA [°] 40 60 80 −10 −5 0 5 10 SZA [°] NILU MS−IASB MS UBRE MS−IASB MS UHEI MS−IASB MS 40 60 80 2 4 6 SZA [°] HCHO SCD [x10 16 molec/cm 2 ] 90° AzLOS − 5° elev 40 60 80 2 4 6 SZA [°] 90° AzLOS − 10° elev 40 60 80 2 4 6 SZA [°] 90° AzLOS − 20° elev IASB MS NILU MS UBRE MS UHEI MS 40 60 80 −10 −5 0 5 10 SZA [°] Relative difference [%] 40 60 80 −10 −5 0 5 10 SZA [°] 40 60 80 −10 −5 0 5 10 SZA [°] NILU MS−IASB MS UBRE MS−IASB MS UHEI MS−IASB MSFig. 6. NO2and HCHO SCDs calculated in MS mode in the comparison test in MAX geometry. For each species, the upper plots correspond to the SCDs and the lower plots to the relative differences between the different models and the IASB one arbitrarily chosen as reference. Results for 90◦AzLOS and for 5◦, 10◦, and 20◦elevation are plotted here.
Table 5. Maximum relative differences obtained between the different RT models and the IASB one – arbitrarily taken as reference – for the comparison test in MAX geometry.
5◦elevation [%] 10◦elevation [%] 20◦elevation [%]
NILU MS NO2 −0.2 +0.2 +0.3 HCHO +1.0 +1.3 +1.1 UHEI MS NO2 −3.6 −3.2 −3.8 HCHO −3.0 −3.0 −4.5 UBRE MS NO2 −4.5 −3.7 −3.3 HCHO −5.0 −5.0 −5.1 40 60 80 −10 −5 0 5 5° elev 30° AzLOS IASB MS NILU MS UBRE MS UHEI MS 40 60 80 −10 −5 0 5 20° elev 40 60 80 −10 −5 0 5
Relative difference [%]; Reference: 90° AzLOS
5° elev 60° AzLOS 40 60 80 −10 −5 0 5 20° elev 40 60 80 −10 −5 0 5 SZA [°] 5° elev 120° AzLOS 40 60 80 −10 −5 0 5 SZA [°] 20° elev
Fig. 7. Impact of the relative azimuth on the NO2SCDs calculated in MAX geometry. The relative differences between the NO2SCDs calculated at 30◦(upper plots), 60◦(middle plots), and 120◦(lower plots) AzLOS and those calculated at 90◦AzLOS (reference case) are plotted here. Left and right plots correspond to results for 5◦ and 20◦elevation, respectively. Note that the IASB blue lines are superimposed to the NILU red lines.
for 5◦and 20◦elevation. The largest AzLOS impact on NO2 SCDs (7%) occurs at 50◦SZA for 30◦AzLOS and 20◦ ele-vation, i.e. at small AzLOS and high elevation angle. In case of HCHO (not shown here), the AzLOS effect is smaller by 1–2% compared to NO2. It should be noted that a larger
rel-ative azimuth effect is expected in presence of aerosols, due to the strong preference of forward scattering by particles, whereas the Rayleigh phase function is symmetric in for-ward and backfor-ward directions. Concerning the consistency between the IASB, NILU, UBRE, and UHEI models with respect to the impact of the AzLOS, Fig. 7 shows that they agree reasonably well.
5 Impact of aerosol scattering on multi-axis simulations of NO2and HCHO SCDs
Aerosols have a strong impact on MAX-DOAS observations (Wagner et al., 2004; Wittrock et al., 2004; and Heckel et al., 2005). The most important effect of the aerosol extinction is a reduction of the visibility of the atmosphere and thus a limitation by scattering of the light path of the lowest viewing directions, reducing the difference in tropospheric absorption path between the viewing directions. It has been shown by Wagner et al. (2004) that the impact of aerosols on O4SCDs can provide a new method to derive information on atmo-spheric aerosols.
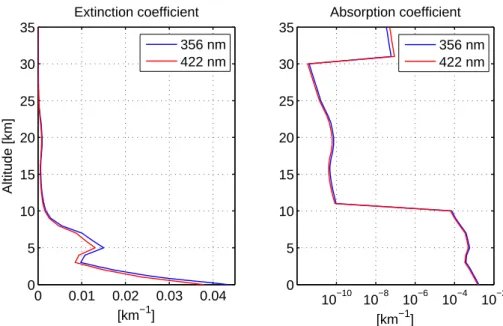
In the present study, MAX NO2 and HCHO SCDs have been simulated with and without aerosol scattering in order to test the consistency between the different RT models re-garding the impact of aerosols in this geometry. The aerosol settings are shown in Fig. 8 (profiles of the extinction and ab-sorption coefficients) and Table 6 (asymmetry factor). They have been constructed from the aerosol model of Shettle (1989) included in the IASB and NILU RT models using a surface visibility of 100 km. The settings in the boundary layer and troposphere correspond to mixture of water solu-ble and dust-like aerosols representative of a rural environ-ment (low aerosol content). In the stratosphere, sulphuric acid aerosol settings corresponding to summer background conditions have been used. The other initialization parame-ters are the same as described in Sect. 4.1, except that HCHO and NO2SCDs have been calculated only for 90◦AzLOS.
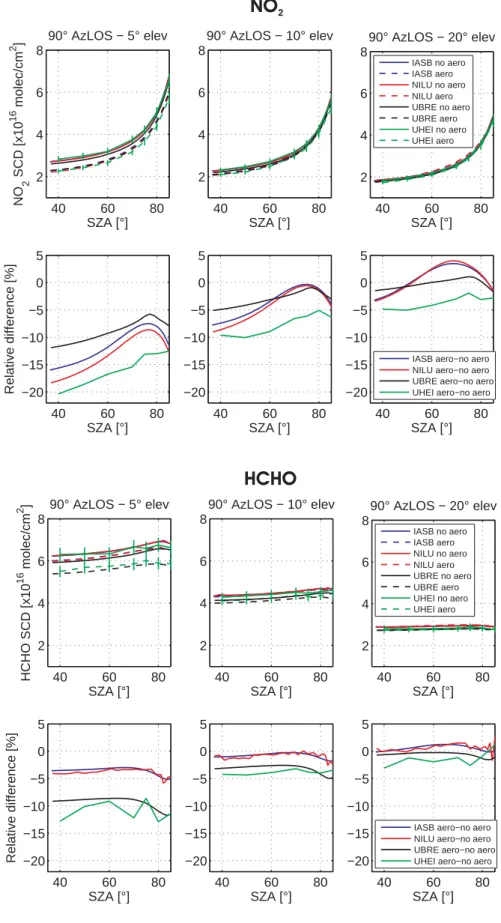
Figure 9 shows MAX NO2 and HCHO SCDs simulated with and without aerosol scattering. Qualitatively, the im-pact of aerosols is the same for all models: a decrease of NO2 and HCHO SCDs occurs when aerosol scattering is included
0 0.01 0.02 0.03 0.04 0 5 10 15 20 25 30 35 [km−1] Altitude [km] Extinction coefficient 356 nm 422 nm 10−10 10−8 10−6 10−4 10−2 0 5 10 15 20 25 30 35 [km−1] Absorption coefficient 356 nm 422 nm
Fig. 8. Profiles of the aerosol extinction (left) and absorption (right) coefficients used for testing the impact of aerosols on MAX simulations of HCHO (356 nm) and NO2(422 nm) SCDs, respectively.
in the calculations. The presence of aerosols leads to a re-duction of the direct light path, especially in the lowest lay-ers, and therefore the absorption by NO2 and HCHO is re-duced (Wagner et al., 2004). The impact of aerosol scattering also decreases at higher elevation angles, due to the fact that, as the elevation angle increases, the mean scattering height increases and therefore the MAX SCD simulations become less sensitive to the lowest layers where the aerosol effect is largest.
When SCDs calculated with aerosols are compared, the different models agree reasonably well: they differ by 9% at most, which is of the same order of magnitude as the dif-ferences found for calculations without aerosols (5%, see Sect. 4.2). However, regarding the quantitative impact of the aerosol scattering, expressed in Fig. 9 by the relative differ-ences between simulations with and without aerosol scatter-ing, the models differ significantly. For example, in HCHO SCD simulations at 5◦elevation, an aerosol impact of about 10% is found with the UHEI and UBRE models, which is twice as much as the impact obtained with the NILU and IASB models. In case of NO2, such a difference is found between the UBRE and UHEI model results (see results for 5◦elevation in Fig. 9). Figure 9 also shows that the impact
of aerosol scattering is larger on NO2than on HCHO SCDs: the relative differences between calculations with and with-out aerosol scattering range for all models, elevation angles, and SZAs between −21% and +4% for NO2 and between
−13% and +1.5% for HCHO. These discrepancies obtained between the different models could not be resolved satisfac-torily so far. It may be related to the different approximations used in the models for resolving the RT equation. For
exam-Table 6. Profiles of asymmetry factor used for testing the im-pact of aerosols on MAX simulations of HCHO (356 nm) and NO2 (422 nm) SCDs.
Asymmetry factor Asymmetry factor
356 nm 422 nm
0–10 km 0.661 0.652
11–30 km 0.698 0.693
>30 km 0.701 0.698
ple, the UBRE and UHEI models are spherical whereas the NILU and IASB models use the pseudo-spherical approxi-mation. A Fourier expansion is also applied in the NILU and IASB models, which could lead to a lose of angular in-formation if too few Fourier terms are considered. In or-der to progress further in our unor-derstanding of the persistent discrepancies regarding the aerosol impact, a thorough exam-ination of individual aerosol routines and additional compar-ison tests appear to be needed, which is beyond the scope of the present intercomparison exercise. This issue, and more generally the impact of aerosol scattering on MAX DOAS AMF simulations, is addressed more thoroughly as part of a new exercise, currently led by the University of Heidel-berg in the framework of the European Network of Excel-lence on Atmospheric Composition Change ACCENT. More details on this new exercise as well as preliminary results can be found on the following web page: http://satellite.iup. uni-heidelberg.de/index.php/RTM Workshop/149/0/.
HCHO
40 60 80 2 4 6 8 SZA [°] NO 2 SCD [x10 16 molec/cm 2 ] 90° AzLOS − 5° elev 40 60 80 2 4 6 8 SZA [°] 90° AzLOS − 10° elev 40 60 80 2 4 6 8 SZA [°] 90° AzLOS − 20° elev IASB no aero IASB aero NILU no aero NILU aero UBRE no aero UBRE aero UHEI no aero UHEI aero 40 60 80 −20 −15 −10 −5 0 5 SZA [°] Relative difference [%] 40 60 80 −20 −15 −10 −5 0 5 SZA [°] 40 60 80 −20 −15 −10 −5 0 5 SZA [°] IASB aero−no aero NILU aero−no aero UBRE aero−no aero UHEI aero−no aero40 60 80 2 4 6 8 SZA [°] HCHO SCD [x10 16 molec/cm 2 ] 90° AzLOS − 5° elev 40 60 80 2 4 6 8 SZA [°] 90° AzLOS − 10° elev 40 60 80 2 4 6 8 SZA [°] 90° AzLOS − 20° elev IASB no aero IASB aero NILU no aero NILU aero UBRE no aero UBRE aero UHEI no aero UHEI aero 40 60 80 −20 −15 −10 −5 0 5 SZA [°] Relative difference [%] 40 60 80 −20 −15 −10 −5 0 5 SZA [°] 40 60 80 −20 −15 −10 −5 0 5 SZA [°] IASB aero−no aero NILU aero−no aero UBRE aero−no aero UHEI aero−no aero
Fig. 9. Impact of aerosol scattering on simulated MAX NO2and HCHO SCDs. For each species, the upper plots correspond to the SCDs and the lower plots to the relative differences between SCDs calculated with and without aerosol scattering (reference: without aerosol scattering). Results for 90◦AzLOS and for 5◦, 10◦, and 20◦elevation are plotted here.
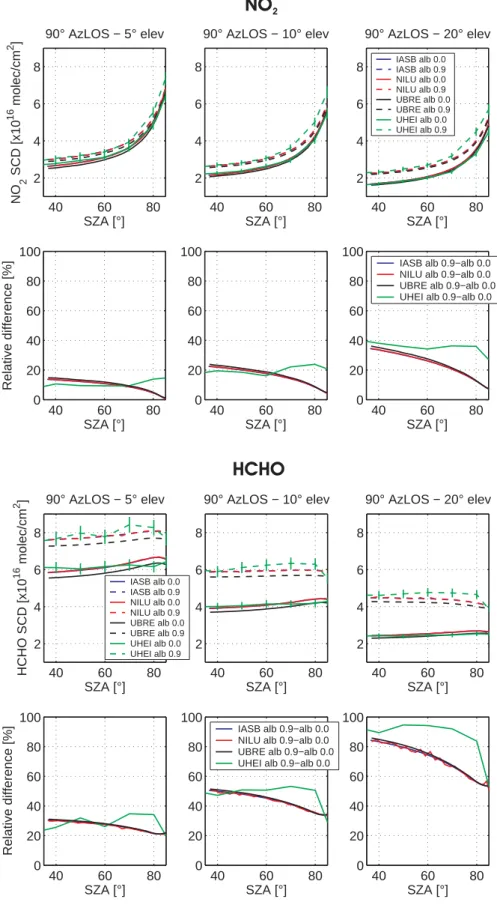
6 Impact of ground albedo on multi-axis simulations of NO2and HCHO SCDs
Ground albedo has a significant impact on the radiative trans-fer close to the ground (H¨onninger et al., 2004; Wittrock et al., 2004). It is particularly important to properly estimate this parameter for observational sites displaying large albedo changes depending on the season or viewing direction. The main effect of an increase of the albedo is an increase of the number of scattering events in the layers close to the sur-face, resulting in longer absorption paths at these altitudes and therefore in higher absolute AMFs. However, the differ-ence in AMF between off-axis and zenith-sky viewing direc-tions is reduced, owing to the fact that the enhancement of the optical path with increasing albedo is largest for zenith-sky observations (Wittrock et al., 2004).
In order to test the consistency between the different RT models regarding the impact of the ground albedo in MAX geometry, NO2and HCHO SCDs have been simulated with ground albedo values fixed to 0 and 0.9. The other model settings are the same as those described in Sect. 4.1. As for the test on the impact of aerosol scattering, simulations have been performed only for 90◦AzLOS.
Figure 10 illustrates the ground albedo effect on simulated MAX HCHO and NO2SCDs. The UBRE, NILU, and IASB models show excellent consistency with similar HCHO and NO2 SCD increases being obtained with the three models. An increase in surface albedo value from 0.0 to 0.9 leads to an increase of the HCHO SCD of about 20% and 55% at 80◦SZA for 5◦and 20◦elevation, respectively, whereas the NO2SCD increases by 5% and 12% under the same condi-tions. The fact that the HCHO SCDs is more sensitive to the ground albedo is expected since for the present simulations, HCHO, in contrast to NO2, is mostly located in the lower part of the troposphere (between 0 and 5 km). In case of the UHEI model, the SCDs simulated for a surface albedo value of 0.0 agree reasonably well with the results from the other models. This agreement is similar to the one obtained for medium (0.2) surface albedo conditions (see Sect. 4). For very high surface albedo (0.9), the UHEI model gives gener-ally larger SCD values, especigener-ally above 70◦SZA. However, in case of HCHO SCDs, the differences between the UHEI model results and the analytical models results are similar to the differences found between the SCDs calculated by the three analytical models. Due to the larger SCD values ob-tained when surface albedo is fixed to 0.9, the UHEI model gives a significantly larger relative increase in SCDs com-pared to the other models: when the surface albedo increases from 0.0 to 0.9, the SCD increases at 80◦SZA for 5◦and 20◦ elevation reach 32% and 84% for HCHO, and 12% and 35% for NO2. This behaviour could be related to the fact that the modelling of the absolute radiance still poses a challenge to backward Monte Carlo approaches, which is also under in-vestigation by other groups. At high albedo, light reflected off the ground is unattenuated and increases the signal of
ab-sorbers near the ground, so the absolute radiance begins to play a significant role in the SCD calculations. The present intercomparison exercise was aimed at detecting those subtle effects, and the results will help to optimize the modelling. So will comparison with measurements, e.g., as performed in Weidner et al. (2005).
7 Conclusions
In the present intercomparison exercise, we have tested the consistency between six RT models used for interpreting ground-based zenith-sky and MAX-DOAS observations in the QUILT EU project. In the context of this project based on the exploitation of the NDSC, the comparison and optimiza-tion of these RT models is of central importance in order to provide accurate time-series of ground-based DOAS obser-vations. This study represents a step forward with respect to previously published work in that it compares RT mod-els in MAX geometry and takes into account photochemi-cal enhancement effect for photochemi-calculating SCDs of rapidly pho-tolysing species in zenith-sky geometry.
Comparisons of NO2 and HCHO SCDs in MAX geom-etry and multiple scattering mode without aerosol scatter-ing show good agreement between all involved models: the calculated NO2 and HCHO SCDs differ generally by no more than 5% in the SZA and elevation angle ranges inves-tigated (35◦–85◦and 5◦–20◦, respectively). The impacts of the relative azimuth, aerosol scattering, and ground albedo on NO2and HCHO SCDs have been also quantitatively de-termined. The azimuth effect is found to be the largest at small AzLOS and high elevation angles. The maximum differences relative to 90◦ AzLOS in the 30◦–120◦ AzLOS
range and for 20◦ elevation rising up to 7% and 5% for NO2and HCHO SCDs, respectively. The models have also shown reasonably good consistency concerning this effect. This is in contrast to the aerosol scattering effect for which significant discrepancies still persist. Since all codes have been initialized identically, this result suggests that signifi-cant differences exist between the models regarding the treat-ment of aerosol scattering, may be related to the different approximations used for resolving the RT equation. This issue, and more generally the impact of aerosol scattering on the MAX DOAS AMF simulations, is addressed more thoroughly as part of a new intercomparison exercise, cur-rently led by the University of Heidelberg in the framework of the European Network of Excellence ACCENT. More details on this new exercise as well as preliminary results can be found on the following web page: http://satellite.iup. uni-heidelberg.de/index.php/RTM Workshop/149/0/. In the test on the impact of the ground albedo, very good agreement has been achieved between the IASB, NILU, and UBRE models whereas the albedo effect is significantly larger using the UHEI model, which is based on a Monte Carlo approach. It should be noted that the conclusions drawn here on the
HCHO
40 60 80 2 4 6 8 SZA [°] NO 2 SCD [x10 16 molec/cm 2 ] 90° AzLOS − 5° elev 40 60 80 2 4 6 8 SZA [°] 90° AzLOS − 10° elev 40 60 80 2 4 6 8 SZA [°] 90° AzLOS − 20° elev IASB alb 0.0 IASB alb 0.9 NILU alb 0.0 NILU alb 0.9 UBRE alb 0.0 UBRE alb 0.9 UHEI alb 0.0 UHEI alb 0.9 40 60 80 0 20 40 60 80 100 SZA [°] Relative difference [%] 40 60 80 0 20 40 60 80 100 SZA [°] 40 60 80 0 20 40 60 80 100 SZA [°] IASB alb 0.9−alb 0.0 NILU alb 0.9−alb 0.0 UBRE alb 0.9−alb 0.0 UHEI alb 0.9−alb 0.040 60 80 2 4 6 8 SZA [°] HCHO SCD [x10 16 molec/cm 2 ] 90° AzLOS − 5° elev IASB alb 0.0 IASB alb 0.9 NILU alb 0.0 NILU alb 0.9 UBRE alb 0.0 UBRE alb 0.9 UHEI alb 0.0 UHEI alb 0.9 40 60 80 2 4 6 8 SZA [°] 90° AzLOS − 10° elev 40 60 80 2 4 6 8 SZA [°] 90° AzLOS − 20° elev 40 60 80 0 20 40 60 80 100 SZA [°] Relative difference [%] 40 60 80 0 20 40 60 80 100 SZA [°] IASB alb 0.9−alb 0.0 NILU alb 0.9−alb 0.0 UBRE alb 0.9−alb 0.0 UHEI alb 0.9−alb 0.0
40 60 80 0 20 40 60 80 100 SZA [°]
Fig. 10. Impact of the ground albedo on simulated MAX NO2and HCHO SCDs. For each species, the upper plots correspond to the SCDs and the lower plots to the relative differences between SCDs calculated with ground albedo values of 0.9 and 0.0 (reference: albedo=0.0). Results for 5◦, 10◦, and 20◦elevation and 90◦AzLOS are plotted here.
levels of agreement between models in the different compar-ison tests depend on the assumptions made for the vertical profiles. In case of NO2and HCHO, very different vertical profiles are indeed possible and could lead to different levels of agreement.
The comparisons of zenith-sky BrO, NO2, and OClO SCDs calculated in both single and multiple scattering modes show good overall agreement to a level that is consistent and in some cases better than in the Sarkissian et al. (1995) work. In single scattering mode, the relative difference between the models is smaller than 1% below 90◦ SZA, except for the ISAC-CNR model,for which relative differences rising up to 7.5% have been found in this SZA range. Above 90◦SZA, the agreement between the IASB, NILU, UBRE, and NIWA models is still very good with a maximum spread of about 2%. Larger discrepancies have been obtained with the ISAC-CNR model, especially in the OClO SCD calculations (rela-tive difference with the IASB model up to 14%). These dis-crepancies could be partly due to differences in calculating the density in individual atmospheric shells. In multiple scat-tering mode, the differences between the NILU, UHEI, and UBRE models and the IASB one are smaller than 4.4% be-low 90◦SZA for the three species. Above 90◦SZA, slightly larger discrepancies have been obtained with a maximum rel-ative difference with the IASB model of about 6.5%. As in MAX geometry, the assumptions made on the vertical pro-files used for the zenith-sky simulations can have an impact on the agreement found between the models. This is particu-larly true for OClO, for which a small change in the vertical profiles could change the behaviour of the different models.
The complete set of initialization data (profiles and cross sections sets) and results of this intercomparison exercise have been gathered in a “RT model validation package” en-abling the testing of other RT codes aiming to the calcu-lation of SCDs/AMFs. This validation package has been made publicly available through the QUILT project web site (http://nadir.nilu.no/quilt/).
Acknowledgements. This research was financially supported by
the European Commission (contract QUILT, EVK2-2000-00545) and the Belgian Federal Science Policy Office (contracts ESAC II EV/35/3A and MO/35/006 & 012). M. P. Chipperfield (University of Leeds) is acknowledged for providing us with the SLIMCAT data. We would like also to thank the coordinators of the QUILT EC project, B. Arlander and G. O. Braathen (NILU).
Edited by: U. P¨oschl
References
Barbe, A., March´e, P., Secroun, C., and Jouve, P.: Measurements of tropospheric and stratospheric H2CO by an infrared high resolu-tion technique, Geophys. Res. Lett., 6(6), 463–465, 1979. Bruns, M., Buehler, S. A., Burrows, J. P., Heue, K.-P., Platt, U.,
Pundt, I., Richter, A., Rozanov, A., Wagner, T., and Wang, P.:
Retrieval of profile information from airborne multiaxis UV-visible skylight absorption measurements, Appl. Opt., 43(22), 2004.
Burrows, J. P., Dehn, A., Deters, B., Himmelmann, S., Richter, A., Voigt, S., and Orphal, J.: Atmospheric remote-sensing ref-erence data from GOME: Part 1. Temperature dependent absorp-tion cross secabsorp-tions of NO2in the 231–794 nm range, J. Quant. Spectrosc. Radiat. Transfer, 60, 1025–1031, 1998.
Burrows, J. P., Richter, A., Dehn, A., Deters, B., Himmelmann, S., Voigt, S., and Orphal, J.: Atmospheric remote-sensing refer-ence data from GOME: Part 2. Temperature dependent absorp-tion cross secabsorp-tions of O3 in the 231–794 nm range, J. Quant. Spectrosc. Radiat. Transfer, 61, 509-517, 1999.
Cantrell, C. A., Davidson, J. A., McDaniel, A. H., Shetter, R. E., and Calvert, J. G.: Temperature-dependent formaldehyde cross sections in the near-ultraviolet region, J. Phys. Chem., 94, 3902– 3908, 1990.
Chipperfield, M. P.: Multiannual simulations with a three-dimensional chemical transport model, J. Geophys. Res., 104(D1), 1781–1805, 1999.
Currant, R. and Hilbert, D.: Methods of Mathematical Physics, vol. 2, Interscience, New York, 1962.
Errera, Q. and Fonteyn, D.: Four-dimensional variational chemi-cal assimilation of CRISTA stratospheric measurements, J. Geo-phys. Res., 106(D11), 12 253–12 265, 2001.
Ehhalt, D. H. and T¨onnißen, A.: Hydrogen and carbon compounds in the stratosphere, Proceedings of the NATO Advanced Study Institute on Atmospheric Ozone: Its Variation and Human Influ-ences, edited by: Aikin, A. C., Report No. FAA-EE-80-20, U.S. Federal Aviation Administration, 1979.
Fish, D. J., Jones, R. L., and Strong, E. K.: Midlatitude observations of the diurnal variation of stratospheric BrO, J. Geophys. Res., 100(D9), 18 863–18 871, 1995.
Hendrick, F., Mueller, R., Sinnhuber, B.-M., Bruns, M., Burrows, J. P., Chipperfield, M. P., Fonteyn, D., Richter, A., Van Roozendael, M., and Wittrock, F.: Simulation of BrO Diurnal Variation and BrO Slant Columns: Intercomparison Exercise Between Three Model Packages, Proceedings of the 5th European Workshop on Stratospheric Ozone, Saint Jean de Luz, France, 27 Sept.– 1 Oct. 1999, Air Pollution Research Report no. 73, European Commission – DG XII, Brussels, 2000.
Hendrick, F., Barret, B., Van Roozendael, M., Boesch, H., Butz, A., De Mazi`ere, M., Goutail, F., Hermans, C., Lambert, J.-C., Pfeilsticker, K., and Pommereau, J.-P.: Retrieval of nitrogen dioxide stratospheric profiles from ground-based zenith-sky UV-visible observations: validation of the technique through correl-ative comparisons, Atmos. Chem. Phys., 4, 2091–2106, 2004, SRef-ID: 1680-7324/acp/2004-4-2091.
Heckel, A., Richter, A., Tarsu, T., Wittrock, F., Hak, C., Pundt, I., Junkermann, W., and Burrows, J. P.: MAX-DOAS measurements of formaldehyde in the Po-Valley, Atmos. Chem. Phys., 5, 909– 918, 2005,
SRef-ID: 1680-7324/acp/2005-5-909.
H¨onninger, G., Friedeburg, C. V., and Platt, U.: Multi Axis Differ-ential Optical Absorption Spectroscopy (MAX-DOAS), Atmos. Chem. Phys., 4, 231–254, 2004,
Lenoble, J.: Radiative Transfer in Scattering and Absorbing Atmo-spheres: Standard computational procedures, A. Deepak Pub-lishing, Hampton, Virginia USA, 1985.
Mayer, B. and Kylling, A.: Technical note: The libRadtran software package for radiative transfer calculations – description and ex-amples of use, Atmos. Chem. Phys., 5, 1855–1877, 2005, SRef-ID: 1680-7324/acp/2005-5-1855.
Noxon, J. F., Whipple, E. C., and Hyde, R. S.: Stratospheric NO2. 1. Observational method and behaviour at midlatitudes, J. Geophys. Res., 84, 5047–5076, 1979.
Petritoli, A., Ravegnani, F., Giovanelli, G., Bortoli, D., Bonaf`e, U., Kostadinov, I., and Oulanovsky, A.: Off-axis measurements of atmospheric trace gases by use of an airborne ultraviolet-visible spectrometer, Appl. Opt., 41(27), 5593–5599, 2002a.
Petritoli, A., Giovanelli, G., Kostadinov, I., Ravegnani, F., Bortoli, D., Bonasoni, P., Evangelisti, F., Bonaf`e, U., and Calzolari, F.: Tropospheric and stratospheric NO2 amount deduced by slant column measurements at Mt. Cimone station, Adv. Space Res., 29(11), 1691–1695, 2002b.
Platt, U: Differential optical absorption spectroscopy (DOAS), in: Air Monitoring by Spectroscopic Techniques, Chem. Anal. Ser., edited by: Sigrist, M. W., John Wiley, New York, 127, 27–84, 1994.
Rozanov, A., Rozanov, V.-V., and Burrows, J.-P.: Combined differential-integral approach for the radiation field computation in a spherical shell atmosphere: Nonlimb geometry, J. Geophys. Res., 105, D18, 22 937, 2000.
Rozanov, A., Rozanov, V.-V., and Burrows J.-P.: A numerical ra-diative transfer model for a spherical planetary atmosphere: com-bined differential-integral approach involving the Picard iterative approximation, J. Quant. Spectrosc. Radiat. Transfer, 69, 491, 2001.
Rozanov, A., Rozanov, V., Buchwitz, M., Kokhanovsky, A., and Burrows, J. P.: SCIATRAN 2.0. A new radiative transfer model for geophysical applications in the 175–2400 nm spectral region, Adv. Space Res., 36(5), 1015–1019, 2005.
Sarkissian, A., Roscoe, H. K., Fish, D., Van Roozendael, M., Gil, M., Chen, H. B., Wang, P., Pommereau, J.-P., and Lenoble, J.: Ozone and NO2 air-mass factors for zenith-sky spectrometers: Intercomparison of calculations with different radiative transfer models, Geophys. Res. Lett., 22(9), 1113–1116, 1995.
Schofield, R.: The vertical distribution of atmospheric BrO from ground-based measurements, PhD thesis, University of Auck-land, AuckAuck-land, 2003.
Schofield, R., Connor, B. J., Kreher, K., Johnston, P. V., and Rodgers, C. D.: The retrieval of profile and chemical informa-tion from ground-based UV-visible spectroscopic measurements, J. Quant. Spectrosc. Radiat. Transfer, 86, 115–131, 2004. Shettle, E. P.: Models of aerosols, clouds, and precipitation for
at-mospheric propagation studies, AGARD Conference Proceed-ings No. 454: Atmospheric propagation in the UV, visible, IR and mm-region and related system aspects, 1989.
Sinnhuber, B.-M., Arlander, D. W., Bovensmann, H., Burrows, J. P., Chipperfield, M. P., Enell, C.-F., Frieß, U., Hendrick, F., Johnston, P. V., Jones, R. L., Kreher, K., Mohamed Tahrin, N., M¨uller, R., Pfeilsticker, K., Platt, U., Pommereau, J.-P., Pundt, I., Richter, A., South, A. M., Tørnkvist, K.K., Van Roozendael, M., Wagner, T., and Wittrock, F.: Comparison of measurements and model calculations of stratospheric bromine monoxide, J. Geo-phys. Res., 107(D19), 4398, doi:10.1029/2001JD000940, 2002. Solomon, S., Schmeltekopf, A. L., and Sanders, R. W.: On the
Inter-pretation of Zenith sky Absorption Measurements, J. Geophys. Res., 92(D7), 8311–8319, 1987.
Spurr, R. J. D.: Linearized Radiative Transfer Theory: A general discrete ordinate approach to the calculation of radiances and an-alytic weighting functions, with application to atmospheric re-mote sensing, PhD thesis, Technische Universiteit Eindhoven, 2001.
Stamnes, K., Tsay, S.-C., Wiscombe, W., and Jayaweera, K.: Nu-merically stable algorithm for discrete-ordinate-method radiative transfer in multiple scattering and emitting layered media, Appl. Opt., 27, 2505–2509, 1988.
Tørnkvist, K. K., Arlander, D. W., and Sinnhuber, B.-M.: Ground-based UV measurements of BrO and OClO over Ny- ˚Alesund during Winter 1996 and 1997 and Andøya during Winter 1998/99, J. Atmos. Chem., 43(2), 75–106, 2002.
von Friedeburg, C.: Derivation of Trace Gas Information combin-ing Differential Optical Absorption Spectroscopy with Radiative Transfer Modelling, PhD thesis, University of Heidelberg, 2003. Wagner, T., Dix, B., Friedburg, C. v., Frieß, U., Sanghavi, S., Sin-reich, R., and Platt, U.: MAX-DOAS O4 measurements: A new technique to derive information on atmospheric aerosols-Principles and information content, J. Geophys. Res., 109, D22205, doi:10.1029/2004JD004904, 2004.
Wahner, A., Ravishankara, A. R., Sander, S. P., and Friedl, R.R.: Absorption cross-section of BrO between 312 and 385 nm at 298 and 223 K, Chem. Phys. Lett., 152, 507–512, 1988.
Wahner, A., Tyndall, G. Y., and Ravishankara, A. R.: Absorption cross-section for OClO as a function of temperature in the wave-length range from 240–490 nm, J. Phys. Chem., 91, 2735–2738, 1987.
Weidner, F., B¨osch, H., Bovensmann, H., Burrows, J. P., Butz, A., Camy-Peyret, C., Dorf, M., Gerilowski, K., Gurlit, W., Platt, U., von Friedeburg, C., Wagner, T., and Pfeilsticker, K.: Balloon-borne Limb profiling of UV/vis skylight radiances, ozone and nitrogen dioxide: Technical set-up and validation of the method, Atmos. Chem. Phys., 5, 1409–1422, 2005,
SRef-ID: 1680-7324/acp/2005-5-1409.
Wittrock, F., Oetjen, H., Richter, A., Fietkau, S., Medeke, T., Rozanov, A., and Burrows, J. P.: MAX-DOAS measurements of atmospheric trace gases in Ny- ˚Alesund – Radiative transfer studies and their application, Atmos. Chem. Phys., 4, 955–966, 2004,