HAL Id: hal-01631586
https://hal.archives-ouvertes.fr/hal-01631586
Submitted on 6 Nov 2019
HAL is a multi-disciplinary open access
archive for the deposit and dissemination of
sci-entific research documents, whether they are
pub-lished or not. The documents may come from
teaching and research institutions in France or
abroad, or from public or private research centers.
L’archive ouverte pluridisciplinaire HAL, est
destinée au dépôt et à la diffusion de documents
scientifiques de niveau recherche, publiés ou non,
émanant des établissements d’enseignement et de
recherche français ou étrangers, des laboratoires
publics ou privés.
Comprehensive study of dynamic curing effect on tablet
coating structure
Claire Gendre, Muriel Genty, Julio Cesar Silva, Ali Tfayli, Mathieu Boiret,
Olivier Lecoq, Michel Baron, Pierre Chaminade, Jean Manuel Pean
To cite this version:
Claire Gendre, Muriel Genty, Julio Cesar Silva, Ali Tfayli, Mathieu Boiret, et al.. Comprehensive
study of dynamic curing effect on tablet coating structure. European Journal of Pharmaceutics and
Biopharmaceutics, Elsevier, 2012, 81 (3), p. 657-665. �10.1016/j.ejpb.2012.04.006�. �hal-01631586�
Comprehensive study of dynamic curing effect on tablet coating structure
Claire Gendre
a,b,c,⇑, Muriel Genty
c, Julio César da Silva
d,e, Ali Tfayli
a, Mathieu Boiret
c, Olivier Lecoq
b,
Michel Baron
b, Pierre Chaminade
a, Jean Manuel Péan
caGroupe de Chimie Analytique de Paris-Sud, Univ Paris-Sud, Châtenay-Malabry, France bCentre RAPSODEE, Mines Albi; CNRS; Université de Toulouse, Albi CT cedex 09, France cTechnologie SERVIER, Orléans, France
dNovitom, Gières, France eESRF, Grenoble, France
Keywords: Dynamic curing Film coating Raman spectroscopy Near Infrared spectroscopy X-ray micro-computed tomography X-ray microdiffraction
a b s t r a c t
The dissolution method is still widely used to determine curing end-points to ensure long-term stability of film coatings. Nevertheless, the process of curing has not yet been fully investigated. For the first time, joint techniques were used to elucidate the mechanisms of dynamic curing over time from ethylcellulose (Aquacoat!)-based coated tablets. X-ray micro-computed tomography (XlCT), Near Infrared (NIR), and Raman spectroscopies as well as X-ray microdiffraction were employed as non-destructive techniques to perform direct measurements on tablets. All techniques indicated that after a dynamic curing period of 4 h, reproducible drug release can be achieved and no changes in the microstructure of the coating were any longer detected. XlCT analysis highlighted the reduced internal porosity, while both NIR and Raman measurements showed that spectral information remained unaltered after further curing. X-ray microdiffraction revealed densification of the coating layer with a decrease in the overall coating thick-ness of about 10lm as a result of curing. In addition, coating heterogeneity attributed to cetyl alcohol was observed from microscopic images and Raman analysis. This observation was confirmed by X-ray microdiffraction that showed that crystalline cetyl alcohol melted and spread over the coating surface with curing. Prior to curing, X-ray microdiffraction also revealed the existence of two coating zones dif-fering in crystalline cetyl alcohol and sodium lauryl sulfate concentrations which could be explained by migration of these constituents within the coating layer. Therefore, the use of non-destructive techniques allowed new insights into tablet coating structures and provided precise determination of the curing end-point compared to traditional dissolution testing. This thorough study may open up new possibilities for process and formulation control.
1. Introduction
Functional aqueous polymer coatings are frequently used to control drug release rates[1]. The film formation process is in-duced from the coalescence of polymer particles for which a post-thermal treatment, known as curing, must generally be con-ducted to ensure long-term stability[2,3]. Currently, in vitro disso-lution testing is commonly used to determine curing end-points and evaluate the long-term stability of film coatings[4–6]. A com-prehensive understanding of the mechanisms involved during film formation is lacking as are methods of characterizing film coatings. Some authors reported studies on isolated films to assess the influ-ence of formulation and process parameters on film coating quality [7,8]. However, it was shown that film properties differ from those
of film coatings when applied to substrates[9]. The use of fast non-destructive techniques, allowing direct characterization of solid dosage forms during the curing process, is a welcome addition for the understanding of this crucial step.
In the present work, various techniques were investigated to detect subtle variations and elucidate changes in the tablet coating layer during curing. New insights into coating structures were gained using X-ray micro-computed tomography (X
l
CT), X-ray microdiffraction, and Near Infrared (NIR) and Raman spectrosco-pies. Compared to scanning electron microscopy or mercury porosimetry, Xl
CT enables non-destructive 3D visualization of the internal structure of samples[10,11], whereas X-ray diffraction allows a non-invasive means of probing information on crystallinity[12,13]. In this study, X-ray techniques were coupled to high-intensity synchrotron radiation, giving access to faster data acquisition and more accurate information relative to conventional X-ray sources [14]. NIR and Raman analyses are frequently employed to characterize solid dosage forms[15,16]and monitor ⇑ Corresponding author. 27 rue Eugène Vignat, 45000 Orléans, France. Tel.: +33(0)2 38 23 80 00; fax: +33 (0)2 38 23 82 01.
real-time pharmaceutical processes[17]; very few NIR or Raman studies, however, describe spectral changes induced upon curing [18–20].
For this study, a functional polymer combination of ethylcellu-lose/poly(vinyl-alcohol)-poly(ethylene–glycol) graft copolymer, using triethylcitrate as plasticizer, was chosen as the coating material to modulate drug release rate from matrix tablets and thus acting as a diffusion barrier. Dissolution studies previously demonstrated stable controlled drug release profiles from pellets coated using this polymer combination, which were subjected to either static or dynamic curing conditions[21,22]. Curing is often performed under static conditions in an oven, but can be carried out preferably within the coating equipment under dynamic condi-tions to eliminate additional tablet transfer steps[22]. In the pres-ent work, dynamic curing was carried out at 60"C and ambient relative humidity. Drug release properties from cured coated tablets were evaluated to confirm dynamic curing performances.
In accordance with current pharmaceutical development regu-lations based on ICH Q8 recommendations [23], the aim of this work was to determine curing end-point with accuracy to ensure film coating stability and thus improve the overall understanding of formulation and processing steps. A new insight into the coating structure of tablets subjected to different dynamic curing times was provided by combining results from the aforementioned techniques.
2. Materials and methods 2.1. Materials
Hydrophilic matrix tablets of biconvex shape (with a diameter of 8 mm, a radius of curvature of 7 mm, and an average mass of 200 mg), made from hypromellose and calcium hydrogenophos-phate as main excipients, containing a freely soluble drug sub-stance were supplied by Les Laboratoires Servier Industrie (Gidy, France).
Aqueous ethylcellulose dispersion (Aquacoat ECD 30!, FMC
Biopolymer, Philadelphia, USA), poly(vinyl-alcohol)-poly(ethyl-ene–glycol) graft copolymer (Kollicoat IR!, BASF, Ludwigshafen,
Germany), and triethylcitrate (Citroflex 2!, Morflex, Greensboro,
USA) were purchased as coating materials.
The commercially available aqueous ethylcellulose dispersion also contains cetyl alcohol as emulsifier (concentration range: 1.7–3.3% w/w of total solids) and sodium lauryl sulfate as surfac-tant (concentration range: 0.9–1.7% w/w of total solids)[24]. Ethyl-cellulose powder (Ethocel!Standard 10, Dow Chemical Company,
Midland, USA), cetyl alcohol (Sigma–Aldrich, Buchs, Switzerland), and sodium lauryl sulfate (Texapon!K 12 G PH, Cognis, Düsseldorf,
Germany) were used as crystallographic and spectroscopic references.
2.2. Coating operation
The coating suspension was prepared with an Aquacoat ECD 30!:Kollicoat IR! ratio of 90:10 w/w (expressed as dry masses).
Aquacoat ECD 30! was plasticized overnight with Citroflex 2!
(1:4 w/w, based on ethylcellulose content), under continuous agitation (Rayneri! apparatus, 200 rpm). An aqueous solution of
Kollicoat IR!was then added to adjust the final solid content at
20% (w/w). The actual coating suspension was mixed for an addi-tional period of 30 min prior to coating and stirred throughout the coating operation (Rayneri! apparatus, 100 rpm).
Approxi-mately 4 kg of preheated tablets (20 min at 40"C) were coated inside a partially perforated pan coater (Driacoater 500!, Driam,
Eriskirch, Germany) using a spray nozzle with a diameter of
0.8 mm at a rotation speed of 20 rpm. The inlet temperature was set at 63"C to maintain a product temperature of 36 "C during coating. Tablet bed temperature was controlled using a hand-held infrared temperature probe, regularly placed at the surface of the tablet bed of the pan coater (Fluke 574, Fluke Corporation, Everett, USA).
The process was stopped after spraying polymer blend equiva-lent to 10% theoretical weight gain (w/w expressed as percentage of core tablet mass). At the end of the coating operation, a fraction of uncured tablets was collected, together with a sample of dried coating suspension removed from the inner surface of the pan coater.
2.3. Curing operation
Coated tablets remaining inside the pan coater were subjected to dynamic curing. The rotation speed was reduced to 10 rpm to prevent tablet damage. The inlet temperature was gradually in-creased to 65"C to attain a steady product temperature of 60 "C throughout the curing operation. Tablet bed temperature was con-trolled using an infrared thermometer (Fluke 574, Fluke Corpora-tion, Everett, USA). No additional water was sprayed. Tablets were collected at different time intervals over 6 h (0.5, 1, 2, 4, and 6 h).
2.4. Drug release studies
In vitrodrug release from uncured and cured tablets was evalu-ated using the USP apparatus 2 dissolution system (AT7 Smart Off-line, Sotax, Allschiwtz, Switzerland), in 0.05 M phosphate buffer at pH 6.8 (1000 ml dissolution medium, 37"C, paddle rotational speed = 50 rpm, 3 tablets analyzed per condition). At appropriate time intervals, 10 ml samples were withdrawn over a 16 h period and analyzed by UV spectrophotometry at 230 nm (Agilent 8453 UV–visible spectroscopy system, Hewlett Packard, Waldbronn, Germany).
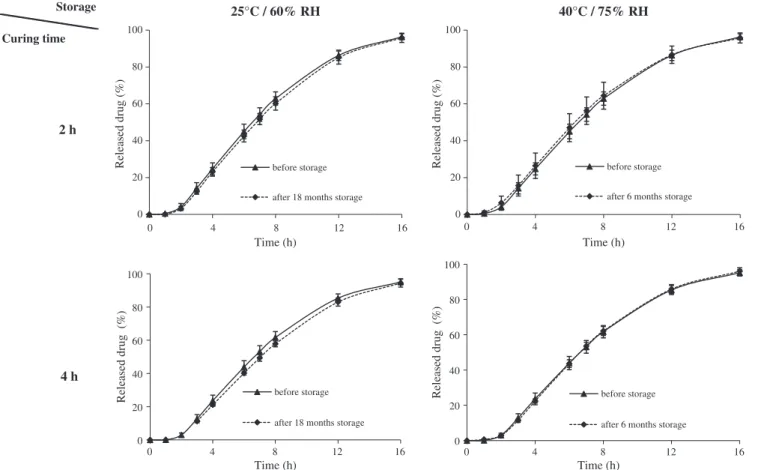
To assess long-term storage stability, cured tablets were stored in closed polypropylene vials at 25"C and 60% RH (ambient condi-tions) and at 40"C and 75% RH (stress conditions). Drug release was measured before and after 6 months storage for stress condi-tions and after 18 months storage for ambient condicondi-tions.
Comparison between drug release profiles was carried out using the similarity factor (f2)[25], given by the following equation:
f2¼ 50: log 1 þ ð1=nÞX n t¼1ðR t% TtÞ2 " #% 0:5 & 100 0 @ 1 A ð1Þ
where n is the number of time points, Rtdenotes the percentage of
drug released of the reference condition at time t, and Tt is the
percentage of drug released from the test condition at time t. Dissolution profiles were considered similar for f2 values
between 50 and 100[26].
2.5. X-ray micro-computed tomography (X
l
CT) measurements High-resolution X-ray micro-tomography acquisitions [27] were performed on beamline ID19 at the European Synchrotron Radiation Facility (Grenoble, France). Each data collection con-sisted in a set of 1200 radiographies acquired in 0.15 degree incre-ment over 180 degrees of rotation of the sample specimen. The detector resolution was 0.28l
m, leading to a reconstruction with an isotropic voxel size of 0.28l
m. The 17.6 keV incident X-ray parallel beam was truncated to the dimensions of 600l
m (wide) & 300l
m (high). A Fast Readout Low Noise – FreLoN – 14 bit CCD camera[28] was set at 12 mm from the sample to increase the propagation distance and, therefore, to enhance thephase contrast. 3D images were reconstructed using a standard fil-tered back projection algorithm. No further image treatment was necessary. The reconstructed volume was a cylinder of 600
l
m in diameter and 300l
m in height. Measurements were carried out in a non-destructive and non-invasive way, that is, from intact tab-lets without any sample preparation. However, due to the limited size of the X-ray beam, only part of the coating was analyzed.Both uncured and cured tablets were analyzed (2 tablets per sample). Quantitative analysis of coating porosity, expressed as the ratio (Volume of pores)/(Total Volume), was performed from a basic segmentation of the reconstructed volume using threshold adjustment and manual refinement. A representative coating vol-ume of 2048 & 2048 & 200 (pixels3) was selected from all samples
and then analyzed with VGStudio MAX 2.1 software. The 200 pix-els corresponded to a thickness of 56
l
m chosen in the middle of the coating in order to avoid artifacts from the surface or from the interface zone with the tablet core.2.6. Spectroscopic measurements 2.6.1. Near infrared measurements
NIR spectral acquisitions were performed with a BUCHI NIRFlex N500 spectrometer (BUCHI Labortechnik AG, Flawil, Switzerland) in the diffuse reflectance mode. The illumination spot diameter was 4 mm. Spectra were acquired over the wavelength range of 12,200–4000 cm% 1, at a spectral resolution of 16 cm% 1and
accu-mulated over 128 scans. NIR acquisitions were carried out on the top of one tablet face, at approximately the same location for all samples. Tablets were positioned on a sample plate allowing accurate and repeatable NIR acquisitions. Fifteen tablets, including uncured tablets, were analyzed for each dynamic curing time. Spectral acquisition was performed using BUCHI NIRCal!
5.2.3000 software (BUCHI, Flawil, Switzerland). 2.6.2. Raman measurements
Raman spectral acquisitions were performed with a HR Labram microspectrometer (Horiba Jobin Yvon, Lille, France). The excitation source was a 785 nm single-mode diode laser generating approxi-mately 50 mW on the sample. The microspectrometer was equipped with an Olympus microscope, and measurements were re-corded using a 50& MPlan objective (spot size laser ' 10
l
m). Light scattered by the sample was collected through the same objective. Using a Notch filter, the elastically scattered photons were sepa-rated from the Raman signal. A multichannel CCD detector (1024 & 256 pixels2) detected the Raman Stokes signal dispersedwith a spectral resolution of 2 cm% 1 by a holographic grating
(600 grooves/mm). The spectral range was from 500 to 1800 cm% 1.
All spectra were acquired at a total laser light exposure time of 2 & 30 s per collected spectrum. Each component of the coating sus-pension and a sample of dried coating sussus-pension were analyzed to assign Raman bands in film coating spectral information. A total of 9 spectra were then acquired from both uncured and cured tablets (3 tablets per condition and 3 acquisitions per tablet at different positions on the surface). Spectral acquisition was carried out using Labspec5 software (Horiba Jobin Yvon SAS, Lille, France).
2.6.3. Spectral data analysis
All Raman and NIR data were exported from Labspec5 software and BUCHI NIRCal! software, respectively, and analyzed using
Matlab!7.8, R2009a software (The MathWorks Inc., Natick, USA)
and PLS Toolbox 5.8.3 (Eigenvector Research Inc., Wenatchee, USA). Raman spectra were pre-processed using baseline correction [29]and normalization based on the highest peak intensity[30].
NIR spectra were pre-processed using Savitzky–Golay smooth-ing (filter width of 9 points and a second-order polynomial fittsmooth-ing) [31]and second derivative. A multivariate qualitative analysis was
performed from pre-processed NIR spectra using Principal Compo-nent Analysis (PCA). This method defines the significant sources of variance within the samples as a series of principal components (PC)[32]. The study of PCA scores based on the relative contribu-tion of each spectrum on the PC construccontribu-tion highlights the rela-tionship between samples.
2.7. X-ray microdiffraction measurements
Experiments were performed at the European Synchrotron Radi-ation Facility (Grenoble, France) on the microfocus beamline ID13 [33]. The high intensity monochromatic beam (energy 12.41 keV), obtained from an in-vacuum undulator and a Si(1 1 1) double-crystal monochromator, was focused with an ellipsoidal mirror (focal spot 20 (wide) & 40 (high)
l
m2) and a size-limited down toa 1.2
l
m diameter section by Kirpatrick–Baez optics. A two-pieces guard aperture (Pb, about 10l
m square aperture) was used to reduce the diffuse scattering from the exit of the collimator. Samples were mounted on a motorized gantry coupled with a microscope allowing sample positioning with a resolution close to 0.1l
m. The experiments were carried out in transmission geome-try with a sample-detector distance of 164.9 mm, calibrated using silver behenate (first order spacing 58.38 Å). 2D X-ray scattering patterns were recorded from 0.01 to 0.5 Å% 1on a MAR-CCD camera(16 bit readout; 130 mm entrance window; 2048 & 2048 pixels2;
pixel size of 78.94 & 78.94
l
m2) with a beam-stop diameter ofapproximately 200
l
m. The data collection procedure consisted of a series of 50 shots collected along a 150-l
m long line perpendicu-lar to the coating surface at the level of the tablet band, penetrating progressively into the coating with a 3l
m step size. Time exposure for recording one shot was 1 s. No radiation damage effect was de-tected in the scattering pattern for this exposure time. The diffrac-tion experiments were performed on 4 tablets prior to curing and following 4 h of dynamic curing (2 tablets per condition). To ensure the representativeness of the results obtained along a single scan, a series of 20 scans from a distance of 50l
m were also collected, leading to a 2D image of the crystalline structure of the coating layer.To identify the diffraction peaks, additional experiments were carried out on pure crystalline components present in the coating formulation inserted in a 1-mm diameter glass capillaries using a conventional laboratory set-up: Rigaku rotating Cu anode (50 kV, 100 mA), beam energy 8.04 keV, beam size 0.6 & 0.6 mm2,
distance sample-detector 250 mm, MAR-CCD 2300 image plate detector, resolution 0.15 & 0.15 mm2, exposure time 100 s.
3. Results and discussion
3.1. Dynamic curing effect on drug release and storage stability Fig. 1 represents drug release profiles obtained from tablets collected at the end of the coating operation and at regular time intervals during dynamic curing. Approximately 10% of theoretical polymer blend (w/w expressed as percentage of core tablet mass) was applied to obtain controlled release of the drug studied over a 16-h period. As expected, a significant decrease in drug release was observed between uncured and cured coated tablets regardless of curing time (38 < f2< 45). This confirmed that film formation was
incomplete immediately after coating. However, identical dissolu-tion profiles were obtained irrespective of curing time (75 < f2< 97). Therefore, even short dynamic curing periods at
60"C and ambient relative humidity could be efficient to obtain fully coalesced film coatings.
Storage stability was then conducted to confirm complete film formation after dynamic curing. Recently, long-term stable film
coatings prepared from similar coating suspension (15% ethylcellu-lose:Kollicoat IR!85:15) were obtained after 2 h of dynamic curing
in a fluidized bed at 57"C/15% RH[22]. In the present study, long-term storage stability of tablets coated with 10% ethylcellu-lose:Kollicoat IR! 90:10 and dynamically cured for 2 h at 60"C
and ambient RH was verified. As it can be seen inFig. 2, drug re-lease rates from cured tablets stored for 6 months under stress conditions and 18 months under ambient conditions were con-stant (f2= 85 and 84, respectively). In addition, stable film coatings
for 4 h dynamically cured tablets were also obtained (Fig. 2), under both ambient (f2= 77) and stress conditions (f2= 95).
Drug release profiles were stable even under elevated condi-tions of temperature and humidity. The high stability of the film coating and the efficiency of the dynamic curing operation were, therefore, confirmed.
Dissolution testing is currently the most widely used method to evaluate curing performances directly from coated solid dosage forms. However, it remains a destructive and time-consuming operation giving access to overall information on both the sub-strate and the coating layer. For a better understanding of film for-mation, new techniques were investigated to overcome dissolution drawbacks and provide a further insight into film coating structure irrespective of tablet core.
3.2. Non-destructive determination of internal coating structure using X
l
CTX-ray micro-computed tomography was used to provide infor-mation about the internal coating porosity of uncured and cured tablets. Currently, this information can be assessed using conven-tional but destructive microscopic techniques associated with im-age analysis. Whilst mercury porosimetry can determine the presence of pores within a solid dosage form directly, it cannot de-tect closed pores. In contrast, both open and closed pore popula-tions can be obtained by X
l
CT measurements[10].Typical reconstructed X
l
CT cross-sectional images are shown inFig. 3. These 2D images are representative of all recorded acqui-sitions for the two tablets analyzed per condition and of all cross-sectional images recorded for the 3D imaging reconstruction (1200 X-ray radiographies). The use of monochromatic synchro-tron X-ray radiation provided a relevant contrast between the tab-let core and the coating layer thanks to the phase contrast mode, thus allowing an accurate insight into the coating layer.0 20 40 60 80 100 0 4 8 12 16 Released drug (%) Time (h) Uncured 0.5 h 1 h 2 h 4 h 6 h
Fig. 1. Effect of curing time on drug release from tablets coated with ethylcellu-lose:Kollicoat IR!90:10 (10% coating level) and cured inside a pan coater at 60"C
and ambient RH. To not overload the figure, standard deviations were not represented but were included between 2% and 4% of released drug.
Storage
25°C / 60% RH
40°C / 75% RH
Curing time2 h
4 h
0 20 40 60 80 100 0 4 8 12 16 Released drug (%) Time (h) before storage after 18 months storage0 20 40 60 80 100 0 4 8 12 16 Released drug (%) Time (h) before storage after 6 months storage
0 20 40 60 80 100 0 4 8 12 16 Released drug (%) Time (h) before storage after 18 months storage
0 20 40 60 80 100 0 4 8 12 16 Released drug (%) Time (h) before storage after 6 months storage
Fig. 2. Storage stability of dynamically cured tablets before and after 18 months under ambient conditions and 6 months under stress conditions (as indicated in the figures). The storage conditions are shown at the top, the curing time on the left.
The non-destructive X
l
CT analysis highlighted the presence of micropores that gradually decreased as curing time continued. Un-cured tablets and tablets Un-cured for as long as 2 h (Fig. 3A–D) were characterized by the presence of numerous micropores within the coating layer and by a coating surface with a high roughness. A qualitative analysis revealed the existence of two types of microp-ores presenting either (i) a spherical shape with a characteristic diameter of around 5l
m or (ii) a broader and flatter shape. Quan-titative volume analysis demonstrated that uncured and 0.5 h dynamically cured tablets presented similar porosities (' 0.20% v/ v), while a 2-h curing period led to lower porosity (' 0.14% v/v). In contrast, tablets cured for longer times (Fig. 3E and F) presented coating layers with a much lower porosities (' 0.03% v/v) and smoother surfaces.These results suggested that 4 h of dynamic curing could lead to a more reduced coating permeability than the coating permeability obtained after 2 h of curing. A slower drug release could thus be expected. However, the observed variations in coating porosity were not correlated with dissolution profiles, which exhibited sim-ilar release patterns from all cured tablets. Therefore, X
l
CT al-lowed the detection of more subtle variations within film coating during dynamic curing in comparison with dissolution. This X-ray technique can successfully be carried out to provide a deeper insight into film coating structures, independently of substrate properties. Interestingly, more accurate determination of curing end-point could be assessed by combining results from Xl
CT coat-ing porosity and long-term drug release.3.3. Monitoring of dynamic curing by near infrared and Raman spectroscopies
3.3.1. Near infrared analysis
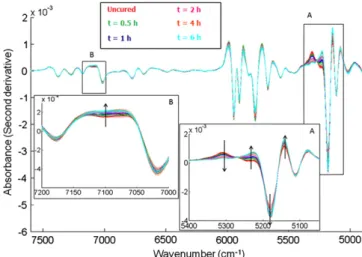
NIR spectra were recorded from uncured and cured tablets. Pre-processed NIR spectra are represented inFig. 4. Spectral evolution was observed with respect to curing times. Variations in absor-bance were observed in two characteristic NIR regions over the ranges 5060–5380 cm% 1 (region A, Fig. 4) and 6970–7190 cm% 1
(region B, Fig. 4). Both NIR regions identified are characteristics of combination and overtone bands of water due to stretching and deformation vibrations of the OH groups [34]. Observed
A
B
C
D
E
F
Fig. 3. Representative micro-tomographic images obtained from coated tablets (A) prior to curing and following various dynamic curing times: (B) 0.5 h, (C) 1 h, (D) 2 h, (E) 4 h, and (F) 6 h.
Fig. 4. Pre-processed NIR spectra of coated tablets prior to curing and undergoing dynamic curing until 6 h (as indicated in the figure). Enlarged areas A and B correspond to NIR spectral regions of interest where absorbance varies in a progressive way according to curing time. Arrows indicate the increase in curing time. (For interpretation of the references to color in this figure legend, the reader is referred to the web version of this article.)
changes could, therefore, be related to the presence of water in film coating. No other NIR spectral variations were detected over the entire spectral range that could be linked to curing times.
PCA was performed to highlight the relationship between sam-ples exhibiting spectral variations observed within both of the se-lected NIR regions. As seen in Fig. 5, an obvious discrimination between samples was obtained on PC2, related to relevant infor-mation from uncured and cured tablets. Uncured tablets were clearly separated from cured tablets. Spectra corresponding to cur-ing times rangcur-ing from 0.5 to 4 h were also separated in distinct groups, while spectra for longer curing times were clustered in a same area. This result confirmed that sample classification based on curing times could be correlated with the removal of water trapped within the coating layer during coating. In addition, this NIR spectral analysis demonstrated the efficiency of a 4-h dynamic curing period to achieve constant spectral information.
Nevertheless, NIR results obtained both from spectral observa-tions and PCA were not directly related to dissolution results that did not appear significantly different from all cured tablets. Simi-larly to X
l
CT, NIR spectroscopy allowed the detection of finer vari-ations in coating structure than dissolution. This vibrational technique could, therefore, be used in association with dissolution testing to determine optimal curing end-point in order to strength-en the control strategies of final product quality.Furthermore, previous studies also reported NIR changes during the curing of acrylic coatings. However, these changes, observed for a different coating formulation, were either attributed to the addition of an acidic polymer (Eudragit L!), resulting in ionic
inter-actions between functional groups of Eudragit!RS:RL 30D[18], or
caused by the N-R swinging of quaternary ammonium groups pro-moted by high humidity and temperature, required for acrylic coatings, during curing[19]. In the present study, NIR spectroscopy was efficiently used to monitor dynamic curing operation from tablets coated with an ethylcellulose based-coating suspension. Its ability to highlight changes in water content between uncured and cured tablets was demonstrated. It can be noticed that curing was performed at ambient relative humidity. Nevertheless, in some situations, high humidity during curing may be required to obtain long-term stable film coatings [22]. Therefore, in such a case, the use of NIR spectroscopy would have to be evaluated inde-pendently and it may not be suitable to monitor changes in water content as the high humidity would dominate the spectrum.
NIR spectroscopy is a well-known technique to monitor water content and provides detection limit as low as 0.1% (w/w)[35]. Nonetheless, this high sensitivity to moisture could mask other more subtle changes in the polymer formulation that might take place in parallel. Raman spectroscopy was, therefore, used as a
complementary vibrational technique to characterize the polymer structure prior to and following dynamic curing.
3.3.2. Raman analysis
Raman spectra of each excipient in the coating formulation, that is, cetyl alcohol (Fig. 6a), sodium lauryl sulfate (Fig. 6b), graft copolymer PVA-PEG (Fig. 6c), triethylcitrate (Fig. 6d), and ethylcel-lulose (Fig. 6e), were initially acquired. Dried coating suspension was then analyzed to identify Raman bands from each coating component (Fig. 6f).
Spectral analysis revealed ethylcellulose to be the main compo-nent in film coating; nonetheless, specific Raman bands arising from the presence of other components were also observed, as indicated in Fig 6f. The peak at 870 cm% 1 was assigned to
m
(CAOAC) stretching vibration from triethylcitrate or graft copoly-mer PVA–PEG[34,36]. Peaks at 1063 cm% 1, 1080 cm% 1, 1100 cm% 1,and 1297 cm% 1 were attributed to
m
(CAC) stretching vibrationfrom cetyl alcohol and sodium lauryl sulfate [36–39], while the peak at 1738 cm% 1was attributed to
m
(C@O) stretching vibrationfrom triethylcitrate[36].
Raman spectra of uncured and cured tablets after various dy-namic curing times were acquired and compared. The intensity of the peak at 1080 cm% 1decreased as curing proceeded, to
disap-pear entirely after 4 h. This can be seen quite clearly inFig. 7 rep-resenting the peak area, calculated between 1075 and 1085 cm% 1,
as a function of curing time. This specific Raman band at 1080 cm% 1 was assigned to the
m
(CAC) stretching mode in thegauche conformation[37] and may be attributed to either cetyl alcohol or sodium lauryl sulfate. As expected, it can be concluded that no chemical reaction occurred during curing as no new chem-ical entity was identified. Curing led only to a structural rearrange-ment showing a decrease in the gauche conformers along the alkyl chains, resulting in denser and more organized coating structure with lower permeability for water and drug. Consequently, a
Fig. 5. PCA scores plot obtained from pre-processed NIR spectra of uncured tablets and tablets dynamically cured until 6 h. (For interpretation of the references to color in this figure legend, the reader is referred to the web version of this article.)
600 800 1000 1200 1400 1600 1800 0 0.02 0.04 0.06 0.08 0.1 0.12 Wavenumber (cm-1) Intensity (a.u.) f e 600 800 1000 1200 1400 1600 1800 0 0.1 0.2 0.3 0.4 Wavenumber (cm-1) Intensity (a.u.) d c b a
Fig. 6. Raman spectra of (a) cetyl alcohol, (b) sodium lauryl sulfate, (c) graft copolymer PVA-PEG, (d) triethylcitrate, (e) ethylcellulose, and (f) dried powdered sample of film coating. Arrows indicate Raman bands related to the presence of other components in coating suspension in addition to ethylcellulose.
slower drug release rate could be expected for long curing times. However, dissolution results did not show significant changes in drug release with increased curing times. Raman results, therefore, revealed more subtle variations in film coating structure during dynamic curing and indicated a stable coating structure after a 4-h curing period.
Interestingly, real-time and in-line spectroscopic measure-ments could be successfully performed inside a coating apparatus to monitor dynamic curing, in accordance with current pharma-ceutical development regulations and Process Analytical Technol-ogy control strategies [23,40]. NIR and Raman techniques are commonly employed to control and monitor various real-time pharmaceutical processes[17]. To our knowledge, no study up un-til now has reported in-line monitoring of dynamic curing with the selected coating formulation. Therefore, these results highlighted the potential of both NIR and Raman spectroscopies for the control and the monitoring of this pharmaceutical unit operation.
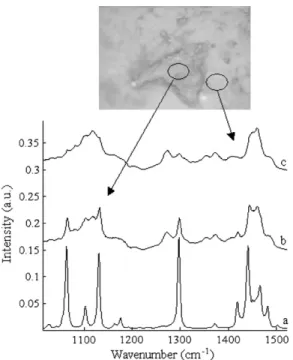
In addition, optical microscope images were recorded of the surface of uncured tablets (Fig. 8), showing some coating heteroge-neity. Specific Raman bands from darker areas, as observed in Fig. 8b, were identified and attributed to higher concentrations of cetyl alcohol (Fig. 8a), while these bands were attenuated for spec-tra acquired from lighter areas (Fig. 8c). As curing proceeded, a quantitative decrease in darker areas was observed. The melting of cetyl alcohol (melting point between 45 and 52"C[41]) is likely to occur during curing, thus leading to its partial diffusion at the surface or inside the coating layer. This would favor the improve-ment of coating homogeneity with curing.
Recently, Yang described similar coating heterogeneity from Aquacoat!-based free films, prepared by a spraying technique,
after a static curing of 1 h at 60"C[20]. The author suggested the existence of crystalline cetyl alcohol agglomerates to explain non-homogeneous distribution within the coating. On the other hand, Schmid et al.[42]using X-ray investigations observed cetyl alcohol in Aquacoat!to be in the amorphous state.
Based on these studies, X-ray microdiffraction measurements were conducted to elucidate the non-homogeneous distribution of cetyl alcohol and to identify its potential crystalline evolution during the curing operation.
3.4. Crystalline composition of coating layer using X-ray microdiffraction
In this study, X-ray diffraction using synchrotron radiation was performed at the microscale to identify the crystalline composition
of the coating layer and to gain a better understanding of coating heterogeneity.
3.4.1. Identification and distribution of crystalline components within the film coating layer
Fig. 9 illustrates representative diffraction patterns obtained from uncured tablets. The series of patterns collected during a scan perpendicular to the coating clearly showed a progressive change of scattering features from the coating surface up to the interface with the tablet core. In fact, each pattern consisted of the sum of the scattering contributions from all the matter located long the beam path. Therefore, close to the coating surface, the signal only arose from the surface. However, due to the tablet curvature, the contribution of the internal coating structure became more and more important when going deeper into the coating. The depth resolution was thus not perfect. In this work, measurements were carried out in a non-destructive way without microtoming the tab-lets. Such data collection could have complicated considerably the data analysis; nevertheless, the changes of the scattering features were well marked, leading to the straightforward interpretation
Fig. 7. Evolution of peak area, calculated between 1075 and 1085 cm% 1from Raman
spectra as a function of dynamic curing time, ranging from 0 (uncured) to 6 h. Mean area values obtained from 9 spectra, associated with its standard deviation, are represented per curing time.
Fig. 8. Raman spectra of (a) cetyl alcohol, (b) darker areas, and (c) lighter areas corresponding to distinct regions observed on optical microscopic images from uncured tablets (size: 614 & 460 pixels2).
Before curing 4 h curing
Microbeam positions
Outer coating
Inner coating
Fig. 9. X-ray microdiffraction patterns corresponding to inner and outer coating zones, as indicated on the schematic representation of uncured and 4 h dynamically cured coated tablets.
of the pattern evolution. The patterns exhibited mainly broad dif-fuse rings, corresponding to amorphous components, plus a series of sharp diffraction arcs/rings corresponding to crystallized com-ponents. The progressive change of these sharp diffraction features can be interpreted by the existence of two zones: an outer zone close to the tablet surface and an inner zone in contact with the tablet core (Fig. 9), which clearly indicated a difference in coating compositions.
The comparison between the outer and inner intensity profiles for uncured samples, obtained by circular integration, is given in Fig. 10. The intensity profiles are also shown of the three main crystallized or partly crystallized components in the initial coating composition: ethylcellulose, sodium lauryl sulfate, and cetyl alcohol.
It can be noticed that the relative intensities of the peaks in the coating were different from those of the pure components, firstly because of the non-uniform spatial orientation of the crystallites in the coating, and secondly and most importantly because of dif-ferent concentrations of the components. Nevertheless, the posi-tions of most diffraction peaks of the coating corresponded to the peaks of these three components. In addition, the slight shift in po-sition that was observed for a few peaks and the presence of a few extra peaks revealed the existence of a structural change during film coating formation, such as polymorphism and/or phase mixing.
Furthermore, main diffraction peaks in the outer zone of the coating corresponded to a lamellar thickness packing of 45 Å, and the two most intense WAXS peaks at 4.15 Å and 3.68 Å were typi-cal of a rectangular organization in the plane of the layers. The comparison with the patterns of the pure components demon-strated that these diffraction features were characteristic of cetyl alcohol. The inner zone also showed diffraction peaks from a lamellar system with a layer thickness of 41.5 Å and two main WAXS peaks at 4.32 Å and 4.10 Å. They corresponded to the fea-tures of sodium lauryl sulfate. With regards to ethylcellulose, which only displayed a sharp but weak peak (about 7.8 Å), it was evenly distributed though the coating except in the 10-
l
m thick outer surface where it was missing.An opposite behavior of sodium lauryl sulfate and cetyl alcohol emerged from these observations. Crystalline cetyl alcohol was mainly found in the outer part of the coating and its concentration decreased progressively when going toward the deeper parts of the coating. On the contrary, the concentration of sodium lauryl sulfate was low close to the surface of the coating and increased in the deeper parts. Therefore, the existence of two zones was clearly highlighted and could be inferred: an outer zone with high cetyl
alcohol content, low sodium lauryl sulfate content, and no ethyl-cellulose on the extreme surface, and an inner ethylethyl-cellulose zone, rich in sodium lauryl sulfate with a low cetyl alcohol content.
In agreement with Yang’s suggestions[20], X-microdiffraction results confirmed a non-homogenous distribution of crystalline ce-tyl alcohol observed by microscopic imaging and Raman measure-ments. In addition, an unexpected distribution of crystalline sodium lauryl sulfate within the coating layer was also highlighted. The homogeneity of coating suspension was checked prior to and during coating. Therefore, the main reason may be related to an upward migration of cetyl alcohol associated with a downward migration of sodium lauryl sulfate in coated tablets during coating. Taking into account the observations of Schmid et al.[42]who reported that cetyl alcohol and sodium lauryl sulfate were molec-ularly dispersed in Aquacoat!and thus in the amorphous state, it
could be assumed that these two components crystallized during coating.
3.4.2. Influence of curing on crystalline coating structure
Analysis of 4-h dynamically cured samples did not reveal any significant changes in the scattering intensity profiles, except for the thickness of the lamellar system attributed to cetyl alcohol lay-ers which decreased by 1 Å. The two-zone coating was still present with the same characteristics. This result confirmed that melted cetyl alcohol present at the coating surface was spread over the coating surface during curing and did not diffused deeper within the coating layer, as initially suggested by microscopic and Raman observations.
As previously mentioned, conducting diffraction experiments without sectioning tablets limits precise determination of concen-tration profiles due to the superposition of diffraction contribu-tions along the X-ray beam path. However, one can roughly estimate that the outer and inner zone thicknesses are, respec-tively, 30
l
m and 70l
m. These values were fairly constant along the 1-mm long zone which was analyzed in 2D. Nevertheless, the overall coating thickness decreased by about 10l
m during curing, indicating a denser coating layer.In addition to this result, differences in the orientation of cetyl alcohol crystallites in the outer coating were observed in cured tablets. Without curing the equatorial position of the SAXS arcs (perpendicular to the coating plane), combined to the meridional position of the WAXS arcs clearly indicated that the cetyl alcohol layers lie mainly parallel to the coating surface (Fig. 9). After 4-h dynamic curing, the arcs tend to transform into circles, indicating a random orientation of the layers. This observation can be inter-preted as a melting/recrystallization phenomenon induced by the heat-cooling cycle of cured tablets.
A new insight into the internal coating structure was provided prior to and following curing, revealing the crystalline distribution of coating components without requiring destruction of samples. Interestingly, results highlighted the existence of two coating zones presenting different concentrations in crystalline cetyl alco-hol and sodium lauryl sulfate, irrespective of curing.
4. Conclusions
Deeper insights into film coating structures from dynamically cured tablets were highlighted using non-destructive techniques. X
l
CT, NIR, and Raman analyses revealed more subtle variations occurring in coating layers during curing compared with usual dis-solution testing. It was demonstrated that stable film coating structures could be obtained after a 4-h dynamic curing period. Interestingly, and even prior to curing, unexpected distributions of two crystalline components, cetyl alcohol and sodium lauryl sul-fate, within coating layers were observed from X-raymicrodiffrac-Fig. 10. X-ray microdiffraction patterns of (a) cetyl alcohol, (b) sodium lauryl sulfate, (c) ethylcellulose, (d) outer, and (e) inner coating layers obtained from uncured coated tablets. (For interpretation of the references to color in this figure legend, the reader is referred to the web version of this article.)
tion measurements. Further, quantitative investigations would be required to fully elucidate these observations and determine their impact on the properties of film coating structures. Nonetheless, the aforementioned techniques can efficiently be used to provide a better understanding of curing process, leading to relevant deter-minations of curing end-points.
Acknowledgements
Authors would like to acknowledge Dr. Barbara Fayard (Novitom) for X
l
CT experiments, Dr. Jean Doucet (Novitom) for X-ray microdiffraction measurements, Dr. Michel Manfait (MéDIAN Unit, CNRS UMR 6237, Faculty of Pharmacy, Reims Champagne– Ardenne University, France) for Raman facilities, and Dr. Michael Lynch (Technologie SERVIER) for his contribution to improve the English of this paper. We thank the Brazilian Bioscience National Laboratory (LNBio) for financial support of J.C. da Silva. Claire Gendre is supported by a CIFRE fellowship granted by Technologie Servier and the French Ministry of Research and Innovation. References[1] J.W. McGintiy, L.A. Felton, Aqueous Polymeric Coatings for Pharmaceutical Dosage Forms, third ed., Informa Healthcare, New York, 2008.
[2] P.A. Steward, J. Hearn, M.C. Wilkinson, An overview of polymer latex film formation and properties, Adv. Coll. Interface Sci. 86 (2000) 165–267. [3] B.C. Lippold, R. Monells Pages, Film formation, reproducibility of production
and curing with respect to release stability of functional coating from aqueous polymer dispersions, Pharmazie 56 (2001) 5–17.
[4] H. Kranz, S. Gutsche, Evaluation of the drug release patterns and long term stability of aqueous and organic coated pellets by using blends of enteric and gastrointestinal insoluble polymers, Int. J. Pharm. 308 (2009) 112–119. [5] S. Muschert, F. Siepmann, Y. Cuppok, B. Leclercq, B. Carlin, J. Siepmann,
Improved long term stability of aqueous ethylcellulose film coatings: importance of the type of drug and starter core, Int. J. Pharm. 368 (2009) 138–145.
[6] Q.W. Yang, M.P. Flament, F. Siepmann, V. Busignies, B. Leclerc, C. Herry, P. Tchoreloff, J. Siepmann, Curing of aqueous polymeric film coatings: Importance of the coating level and type of plasticizer, Eur. J. Pharm. Biopharm. 74 (2010) 362–370.
[7] S. Obara, J.W. McGinity, Properties of free films prepared from aqueous polymers by a spraying technique, Pharm. Res. 11 (1994) 1562–1567. [8] G. Perfetti, K.M.B. Jansen, W.J. Wildeboer, P. van Hee, G.M.H. Meesters,
Characterization of physical and viscoelastic properties of polymer films for coating applications under different temperature of drying and storage, Int. J. Pharm. 384 (2010) 109–119.
[9] L. Mendoza-Romero, E. Pinon-Segundo, M.G. Nava-Arzaluz, A. Ganem-Quintanar, S. Cordero-Sanchez, D. Quintanar-Guerrero, Comparison of pharmaceutical films prepared from aqueous polymeric dispersions using the cast method and the spraying technique, Colloids Surf., A: Physicochem. Eng. Aspects 337 (2009) 109–116.
[10] B. Crean, A. Parker, D. Le Roux, M. Perkins, S.Y. Luk, S.R. Banks, C.D. Melia, C.J. Roberts, Elucidation of the internal physical and chemical microstructure of pharmaceutical granules using X-ray micro-computed tomography, Raman microscopy and infrared spectroscopy, Eur. J. Pharm. Biopharm. 76 (2010) 498–506.
[11] G. Perfetti, E. Van de Casteele, B. Rieger, W.J. Wildeboer, G.M.H. Meesters, X-ray micro tomography and image analysis as complementary methods for morphological characterization and coating thickness measurement of coated particles, Adv. Powder Technol. 21 (2010) 663–675.
[12] C. Nunes, A. Mahendrasingam, R. Suryanarayanan, Quantification of crystallinity in substantially amorphous material by synchrotron X-ray powder diffractometry, Pharm. Res. 22 (2005) 1942–1953.
[13] H. Yamada, K. Masuda, T. Ishige, K. Fujii, H. Uekusa, K. Miura, E. Yonemochi, K. Terada, Potential of synchrotron X-ray diffractometry for detection and quantification of small amounts of crystalline drug substances in pharmaceutical tablets, J. Pharm. Biomed. Anal. 56 (2011) 448–453. [14] J.A. Zeitler, L.F. Gladden, In-vitro tomography and non-destructive imaging at
depth of pharmaceutical solid dosage forms, Eur. J. Pharm. Biopharm. 71 (2008) 2–22.
[15] J. Luypaert, D.L. Massart, Y. Vander Heyden, Near-infrared spectroscopy applications in pharmaceutical analysis, Talanta 72 (2007) 865–883.
[16] K.C. Gordon, C.M. McGoverin, Raman mapping of pharmaceuticals, Int. J. Pharm. 417 (2011) 151–162.
[17] T. De Beer, A. Burggraeve, M. Fonteyne, L. Saerens, J.P. Remon, C. Vervaet, Near Infrared and Raman spectroscopy for the in-process monitoring of pharmaceutical production processes, Int. J. Pharm. 417 (2011) 32–47. [18] S.H. Tabasi, R. Fahmy, D. Bensley, C. O’Brien, S.W. Hoag, Quality by design. Part
III: Study of curing process of sustained release coated products using NIR spectroscopy, J. Pharm. Sci. 97 (2008) 4067–4089.
[19] T. Morita, T. Ishii, T. Sato, K. Terashita, T. Riermeier, Detection of curing via NIR shown for Eudragit!RL/RS 30D, in: Annual Meeting and Exposition of the
American Association of Pharmaceutical Sciences (AAPS), 2009.
[20] Q.W. Yang, Systèmes polymériques à base de dispersion aqueuse administrés par voie orale pour la libération contrôlée du principe actif, PhD thesis, University of Lille Nord de France, Lille, France, 2009.
[21] F. Siepmann, A. Hoffmann, B. Leclercq, B. Carlin, J. Siepmann, How to adjust desired drug release patterns from ethylcellulose-coated dosage forms, J. Control. Release 119 (2007) 182–189.
[22] S. Muschert, F. Siepmann, B. Leclercq, J. Siepmann, Dynamic and static curing of ethylcellulose: PVA–PEG graft copolymer film coating, Eur. J. Pharm. Biopharm. 78 (2011) 455–461.
[23] International Conference on Harmonisation of Technical Requirements for Registration of Pharmaceuticals for Human Use, ICH Harmonised Tripartite Guideline, Pharmaceutical Development Q8 (R2) (Step 4), 2009.
[24] FMC Biopolymer, Aquacoat!ECD-30, Ethylcellulose Aqueous Dispersion, NF,
JPE, Product Specification Bulletin, Bulletin #AECD-30-11/16/04.
[25] J.W. Moore, H.H. Flanner, Mathematical comparison of dissolution profiles, Pharm. Technol. 20 (1996) 64–74.
[26] US Department of Health and Human Services, Food and Drug Administration, Center for Drug Evaluation and Research (CDER), Guidance for Industry, SUPACMR: Modified Release Solid Oral Dosage Forms, Scale-Up and Postapproval Changes: Chemistry, Manufacturing, and Controls; In Vitro Dissolution Testing and In Vivo Bioequivalence Documentation, 1997. [27] L. Salvo, P. Cloetens, E. Maire, S. Zabler, J.J. Blandin, J.Y. Buffière, W. Ludwig, E.
Boller, D. Bellet, C. Josserond, X-ray micro-tomography an attractive characterisation technique in materials science, Nucl. Instrum. Methods Phys. Res. Sect. B – Beam Interact. Mater. Atoms 200 (2003) 273–286. [28] J.C. Labiche, O. Mathon, S. Pascarelli, M.A. Newton, G.G. Ferre, C. Curfs, G.
Vaughan, A. Homs, D.F. Carreiras, The fast readout low noise camera as a versatile X-ray detector for time resolved dispersive extended X-ray absorption fine structure and diffraction studies of dynamic problems in materials science, chemistry, and catalysis, Rev. Sci. Instrum. 78 (2007) 091301.
[29] J. Zhao, H. Lui, D.I. McLean, H. Zeng, Automated autofluorescence background subtraction algorithm for biomedical Raman spectroscopy, Appl. Spec. 61 (2007) 1225–1232.
[30] D. Zhang, D. Ben-Amotz, Enhanced chemical classification of Raman images in the presence of strong fluorescence interference, Appl. Spec. 54 (2000) 1253– 1415.
[31] A. Savitzky, M.J. Golay, Smoothing and differentiation of data by simplified least squares procedures, Anal. Chem. 36 (1964) 1627–1639.
[32] S. Wold, K. Esbensen, P. Geladi, Principal component, Anal. Chem. Int. Lab. Syst. 2 (1987) 37–52.
[33] C. Riekel, M. Burghammer, M. Müller, Microbeam small-angle scattering experiments and their combination with microdiffraction, J. Appl. Cryst. 33 (2000) 421–423.
[34] G. Socrates, Infrared and Raman Characteristic Group Frequencies, Tables and Charts, third ed., John Wiley & Sons, Ltd., 2010.
[35] H. Grohganz, D. Gildemyn, E. Skibsted, J.M. Flink, J. Rantanen, Towards a robust water content determination of freeze-dried samples by near-infrared spectroscopy, Anal. Chim. Acta 676 (2010) 34–40.
[36] M. de Veij, P. Vandenabeele, T. De Beer, J.P. Remon, L. Moens, Reference database of Raman spectra of pharmaceutical excipients, J. Raman Spectrosc. 40 (2009) 297–307.
[37] A. Tfayli, E. Guillard, M. Manfait, A. Baillet-Guffroy, Thermal dependence of Raman descriptors of ceramides. Part I: Effect of double bonds in hydrocarbon chains, Anal. Bioanal. Chem. 397 (2010) 1281–1296.
[38] J. de Gelber, K. De Grussem, P. Vandenabeele, L. Moens, Reference database of Raman spectra of biological molecules, J. Raman Spectrosc. 38 (2008) 1133– 1147.
[39] V.B. Kartha, L.C. Leitch, H.H. Mantsch, Infrared and Raman spectra of alkali palmityl sulfates, Can. J. Chem. 62 (1984) 128–132.
[40] Food and Drug Administration, Guidance for Industry, PAT – A Framework for Innovative Pharmaceutical, Development, Manufacturing and Quality Assurance, 2004.
[41] R.C. Rowe, P.J. Sheskey, S.C. Owen, Handbook of Pharmaceutical Excipients, fifth ed., Pharmaceutical Press and American Pharmacists Association, 2006. [42] S. Schmid, C.C. Müller-Goymann, P.C. Schmidt, Interactions during aqueous