EFFECT OF DENSITY AND TEMPERATURE PROFILE OF He GAS IN INTERFEROMETER METHOD USING LASER He-Ne
S. ASKRI 1,2, M. Lemerini1 and A. K. Ferouani1,3
1
LPT, Université A. Belkaid, Faculté des Sciences, Département de Physique, 13000, Tlemcen, Algerie.
2
Département de physique, Faculté Sciences exactes, Université Echahid Hamma Lakhdar d’El Oued, Algérie,
3
Ecole Supérieure des Sciences Appliquées. BP 165 RP Bel Horizon 13000 Tlemcen, Algérie
ABSTRACT
This work presents an optical diagnosis using interferometer method (Fig.1) using laser He-Ne. The density and the temperature are visualized by studying the interferograms of He (helium) gas medium subjected to a stationary DC (Corona Discharge) at atmospheric pressure [1-2]. The density is extracted from the phase shifting introduced by the studied medium, and the temperature is deduced from the ideal gas law. The refractive index is related to the density through the Gladstone–Dale equation [3]. The experimental set up that we have applied here is assumed to be cylindrically symmetric and the distance between electrodes, equals 10 mm. The obtained results show that the rate variation of the density increase from 10 to 45% and the temperature is varying between 300 to 500 K in all the space.
Keywords: keywords; keywords; keywords; keywords; keywords.
S. ASKRI, e-mail: askrisouha@gmail.com
1. INTRODUCTION
A corona discharge is a process by which a current develops from a high potential electrode so as to create plasma around this electrode. Despite their shortcomings, corona discharge systems have many applications ranging from environmental cleanup processes to solid-state
fans. The plasma diagnostics could be achieved by observing effects resulting from physical processes. In determining parameters of different types of plasma, it may not be appropriate to use material probes, as they may perturb the plasma. Raman scattering techniques sound, Absorption spectra, infrared spectra, ultra-sonic velocity electromagnetic wave probing, were all used to measure gas evolution in plasma. Most of the interferometry methods are based on measuring the change in the refractive index [1-2]. As temperature increases, the density and the refractive index decreases accordingly and the relationship between these parameters can be expressed by the Gladstone–Dale equation [3].
The situation is more complicated for a mixed gas because they not have the same refractive index, and they may not vary in the same way when temperature changes. However, it is believed that the Gladstone–Dale equation can still be applied by considering an individual Gladstone–Dale coefficient for each species in this case [4].
A possible method for determining the profile of temperature and density is well known by boltzmann plot [5]. It is thus possible to determine this thermodynamic temperature by using the refractive index variation introduced by the hot gas in the ambient air. This is done by using a Mach-Zehnder interferometer with a widened laser beam.
Recently, many advanced optical methods have been developed to measure the temperature of such an object. Among the different techniques, we can differentiate those giving the temperature at a point or in a restricted localized area of the reacting flow such as Raman scattering [5], LIF [6], spectroscopy [7], Rayleigh scattering [8], and CARS [9], and those measuring the complete spatial temperature distribution such as holographic interferometry [10], as well as the interferometric finite fringe method [11]. The last ones are all based on the same principle: determination of the spatial refractive index distribution using a laser interferometric technique coupled to knowledge of the studied gas composition. The temperature distribution is then deduced from the refractive index distribution [12].
In the present study, the mach-zehnder interferometry method is successfully developed to analyse and diagnose a helium gas medium subjected to corona discharge. We want to deduce especially the mapping of the refractive index, the density and the temperature.
Figure 1 shows the configuration of the Mach–Zehnder interferometer which has been used in the experimental study. A frequency stabilized He-Ne laser, with a wavelength λ of 632.8 nm and an output power of 10 mW, provides a linear polarized beam for the measurements.
First, a He–Ne laser beam was expanded to obtain a beam larger than the discharge. The expanded beam was divided into a probe beam and a reference beam with a beam splitter, which is the first element of the Mach-Zehnder interferometer. The probe beam passes through the medium being studied and the reference beam through ambient gas helium. Each beam is reflected into the second beam splitter by mirrors and recombined in this beam splitter and recorded on the CCD camera, connected to a Computer. The discharge system, used here, involved two stainless steel electrodes, a point electrode and a plane electrode. The curvature radius for the point electrode was 150 µm and for the plane diameter was 25 mm. The inter-electrode distance was set at 10 mm. To feed this system, a high-potential generator was used with a tension of 30 kV and a current of 0.6 mA for the point electrode. The current-stabilized generator was connected to the discharge by the intermediary of a 25 MΩ resistance. Helium gas coming from the He source cylinder was measured using a manometer, and the residual pressure in the vacuum chamber was lower than 10–4 mbar.
The finite fringe method needs to have fringes without the discharge. The introduction of a different medium with a temperature or density gradient (corona discharge) in the path of the probe beam changes the phase distribution of this beam and causes a deformation of the fringes.
Fig 1. Interferometer method using laser He-Ne
2. THE INTERFEROMETRIC FINITE FRINGE METHOD
The interferograms were recorded using a CCD camera from a screen (figure 1). For each of them, the distribution of the intensity of the interference field can be expressed as :
I (x, y) = a(x, y) + b(x, y) cos(φ(x, y)) (1)
where I (x, y) is the intensity of the interference field at the point (x, y), a(x, y) is the function that characterizes the mean intensity and b(x, y) is the function that determines the modulation of the interference signal. The phase values φ(x,y), can then be determined by several methods [10]. When the light wave generated from a coherent light source passes through a corona discharge, the phase information of the light wave varies according to the variation of the refractive index of the discharge. The extent of this change, compared with the light beam in the reference state, is determined by the refractive index field and its length. To calculate the density and temperature, first the refractive index field within the discharge is calculated from the Abel inversion [10].
R y dr y r r y x n y x dk 2 2 ) , ( 2 ) , ( (2)Where wavelength, R is study ray, r discharge ray and y coordinate each point.
The index variation is reply of neutral density varying. In our case, it is Gladstone-Dale relation which allows us to calculate the refractive index of neutral particle:
e e i n n C C nC N n1 ((1) ) (3)
n being the index of refraction of the medium, Nn density of the neutrals, ne density of the
electrons, the ionization level, Cn, Ci , Ce are the constants of Gladstone and corresponding
respectively to the population of the neutrals, the ions and the electrons. In our case, the ionization level is very weak and thus the contribution of the particles charged is negligible. The variation of the optical way of the pencils of light is thus due only to the variation of the density of the neutrals species. The relation of Gladstone-Dale becomes then:
g
C
n1 (4)
The value of Cg depend to the wavelength. In our case, and Cg=1.96 10-4 m3. kg
relation (4) can be also written according to the wavelength , dephasing between the fringes and the length L of the way of the beam inside the disturbed medium :
L n 2 1 (5)
using the relation (5) one determines the index of refraction of the medium, then one calculates starting from the equation (4) the density of neutrals Nn The refractive index is then
related to the temperature through the Gladstone –Dale equation and the ideal gas law:
) 1 ( ) 1 ( 0 0 0 n P n P T T (6)
Hence, the temperature distribution is calculated from (6), where T0 and n0 are the reference
temperature and the reference refractive index of the ambient air, respectively. T0 = 293 K ,
3. RESULTS
Figure 2, 3 and 4 show respectively interferogram without application of corona discharge, interferogram with application of corona discharge and interferometric image which represent the difference between interferogram with and without application of corona discharge of helium gas, the interelectrode distance equals 10 mm and applied voltage 25kV.
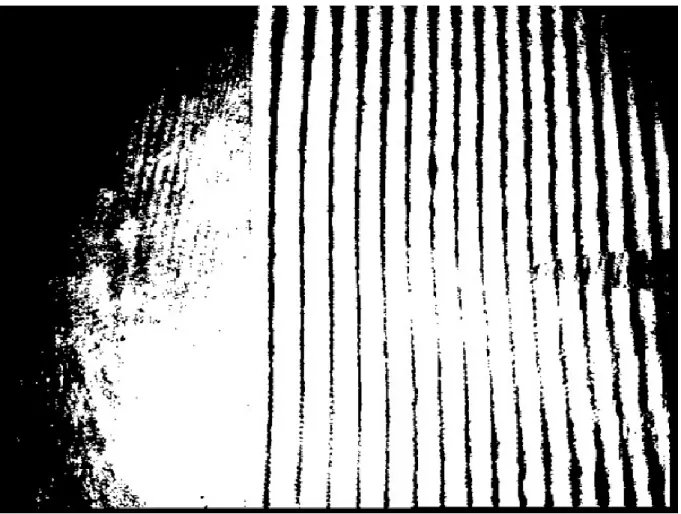
Fig 2. Interferogram of helium gas without application of corona discharge.
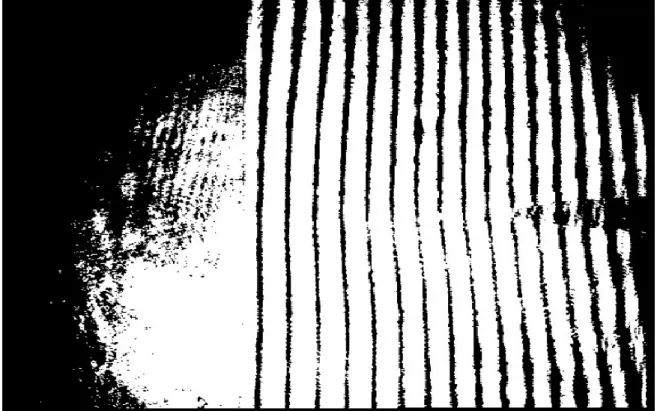
Fig 3. Interferogram of helium gas with application of corona discharge
(interelectrode distance = 10 mm- pressure = 1 bar - temperature = 293K)
Fig 4. interferometric image of helium gas which represent the difference between the two
interferograms obtained in Fig.2 and Fig.3, (interelectrode distance = 10 mm- pressure = 1 bar -temperature = 293K)
Fig 5. map of the helium density
(distance point plane = 10 mm-pressure = 1 bar -temperature = 293K)
Fig. 6. map of the helium temperature
Image 5 and 6 represent respectively the cartography of refractive index, density and temperature of helium gas subjected to corona discharge. These images are obtained by a local numerical code which is based on Pearce method, Abel transformation and Gladstone – dale equation. We observe clearly on these images the effect of the discharge on the helium gas.
Indeed, in the discharge point plane the energy transferred by the charged particles to neutral particles causes an increase of temperature. So, the pressure in the center of the discharge increases substantially, and when it becomes high enough a shock wave is formed and expands radially. This causes a strong depopulation neutral in the heart of the discharge. this decrease leads to an increase of the reduced field and therefore to an increase in electron and causing overheating neutral, and thus a depopulation becomes, the accuracy of the calculated temperature is about 10 in the gap, apart in the vicinity of the point electrode and near the plane where the movement of neutral particles is perturbed.
0 1 2 3 4 5 6 1,000025 1,000030 1,000035 1,000040 1,000045 1,000050 re fra ct ive in de x z(mm)
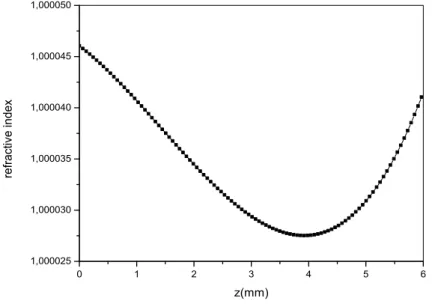
Fig. 7. axial profile of the helium refractive index at 760 Torr
Figure 7 shows spatial distribution of refractive index of helium gas along the axis when a voltage of 25 kV has been applied to the discharge electrode. The refractive index first decreases from the point until z=4 mm due to a energy transfer from electron, then increases until the cathode.
0 1 2 3 4 5 6 2,0x1024 2,5x1024 3,0x1024 3,5x1024 4,0x1024 d e n si ty (m -3 ) z(mm)
Fig.8. axial profile of the helium density at 760 Torr
Figure 8 shows spatial distribution of density helium gas along the axis when a voltage of 25 kV has been applied to the discharge electrode. The density first decreases from the point until z=4 mm due to the presence of the space charge which reduces the electric field in the intrelectrode space the rate of decrease is close to 10%;
0 1 2 3 4 5 6 300 350 400 450 500 550 T emp era tu re (K) z(mm)
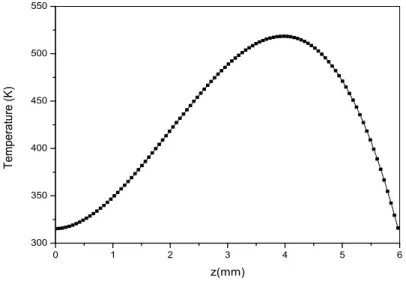
Fig. 9. axial profile of the helium temperature at 760 Torr
In Figure 9 we have represented the spatial distribution of temperature helium gas along the axis. The maximum temperature was observed on axis and was about 520 K. This evolution is
due to the local transfers of energy (of charged particles/neutral particles) which are not negligible even in the weak-current fields. Under such conditions of high pressures, where electrons are strongly collisional, the neutral gas is not only one more source of the charged particles, but it also intervenes with the general dynamics of the discharge. The temperature profile in the medium created by the discharge is slightly different. The maximum temperature (520 K), again appearing at the same place (r = 0, at z = 4 mm from the point).
-12 -10 -8 -6 -4 -2 0 2 4 6 8 10 12 1x1024 2x1024 3x1024 4x1024 5x1024 d e n si ty (m -3 ) r(mm)
Fig.10. radial distribution of the helium density ( 760 Torr - z=3mm)
Figure 10 shows radial distribution of density helium gas when a voltage of 25 kV has been applied to the discharge electrode. We observe the wave propagation caused and created by corona discharge.
4. CONCLUSION
Indeed, in the discharge point plane the energy transferred by the charged particles to neutral particles causes an increase of temperature. So, the pressure in the center of the discharge increases substantially, and when it becomes high enough a shock wave is formed and expands radially. This causes a strong depopulation neutral in the heart of the discharge. this decrease leads to an increase of the reduced field and therefore to an increase in electron and causing overheating neutral, and thus a depopulation becomes .
The accuracy of the calculated temperature is about 10 in the gap, apart in the vicinity of the point electrode and near the plane where the movement of neutral particles is perturbed. The density first decreases from the point until z=4 mm due to the presence of the space charge which reduces the electric field in the intrelectrode space the rate of decrease is close to 10%.
The temperature profile in the medium created by the discharge is slightly different. The maximum temperature (520 K), again appearing at the same place (r = 0, at z = 4 mm from the point).
In general, this work shows the applicability of the Mach-Zehnder interferometry to analyse and diagnose any gaseous medium subjected to a corona discharge. We have obtained in particular a cartography of the index refraction, the density and the temperature distribution in all the space between the point and the plane. The calculations were based on earlier Gladstone-Dale relation using the Abel inversion. We have found that the helium temperature varying between 293 and 520K and density between 1.5x1024 and 4.5x1024 m-3.
Thus the interferometry has a future application in controlling conditions of preparing advanced materials using a discharge method, or mapping chemical reactions, or Carbon nanotube manufacturing, where temperature control is an important factor.
5. REFERENCES
[1] Shakher, C. and Nirala, A. K. A review on the refractive index and temperature profile measurements using laser-based interferometric techniques Opt, Laser Eng., 1999, 31, 455– 491.
[2] Bechtel J.H. Temperature measurements of the hydroxyl radical and molecular nitrogen in premixed, laminar flames by laser techniques., Applied Optics ,1979, 18(13),2100–2106. [3] Mayinger, F., Feldmann, O. Optical Measurements: Techniques and Application. 2nd ed.. Berlin: Springer; 2001.
[4] Gardiner, W.C, Hidaka, Y., Tanzawa T. Refractivity of combustion gases. Combustion and Flame, 1981, 40,213–219.
[5] Drake, M. C. and Rosenblatt, G. M, Flame temperatures from Raman scattering Chem. Phys. Lett., 1976 44(2), 313–316.
[6] Daily, J. W. Laser induced fluorescence spectroscopy in flames Prog., Energy Combust. Sci., 1997, 23(2) 133–199.
[7] Rabat, H. and Izarra, C. check of OH rotational temperature using an interferometric method. J. Phys. D: Appl. Phys., 2004, 37, 2371– 2375.
[8] Pitz, R. W, Cattolica, R., Robben, F. and Talbot, L. Temperature and density in a hydrogen—air flame from Rayleigh scattering Combust. Flame, 1976, 27, 313–320.
[9] Eckbreth, A. C. and Hall, R. J., CARS thermometry in a sooting flame Combust. Flame, 1979, 36, 87–98.