Best Practices for
Evolutionary Software Development Management
byDarren Bronson
B. S. Computer Engineering, University of Illinois, 1992 M. S. Electrical Engineering, Stanford University, 1994
Submitted to the Sloan School of Management and the
Department of Electrical Engineering and Computer Science in partial fulfillment of the requirements for the degrees of
Master of Business Administration and
Master of Science in Electrical Engineering and Computer Science in conjunction with the
Leaders for Manufacturing Program At the
Massachusetts Institute of Technology June 1999
@91999 Massachusetts Institute of Technology, All rights reserved
Signature of Author
Sloan School of Management Department of Electrical Engineering and Computer Science
Certified by V
Michael Cusumano, Thesis Advisor Sloan Distinguished Professor of Management
Certified by
Daniel Jackson, Thesis Advisor Associate Professor of
Electrical
Engineering and Computer ScienceAccepted by
Arthur C. Smith, Chairman, Committee on Graduate Students Department of Electrical Engineering and Computer Science
Accepted by
Lawrence S. Abeln, Director of the Masters Program Sloan School of Management
Best Practices for
Evolutionary Software Development
byDarren F. Bronson
Submitted to the MIT Sloan School of Management
and the Department of Electrical Engineering and Computer Science on May 9, 1999
in partial fulfillment of the requirements for the degrees of Master of Business Administration
and Master of Science in Electrical Engineering and Computer Science
Abstract
In the past few years, Evolutionary Software Development processes have been adopted bynany development groups at Hewlett-Packard as an alternative to Waterfall Development. While there have been many successes with the new process, there also have been several groups that have attempted to adopt it, yet have decided to revert back to a simpler Waterfall process. Process consultants at HP believe that while the process has tremendous potential, it is more complicated to manage than previous processes and has some drawbacks when used inefficiently.
This project involves analyzing the efforts of Hewlett-Packard software teams that have adopted
Evolutionary Development in order to determine which are the factors that most impact a group success with the process. These efforts studied include management of project milestones, software integration,
software architecture, and testing.
First, data on 30 previously completed evolutionary projects was collected. Case studies were performed for four of these projects. These cases were then used in the evaluation stage, where experts with the process drew conclusions about which factors have the most impact on success. Next, documents were created which list best practices for using the process. Finally, experts reviewed these documents and amended them until they become satisfactory tools for communicating best practices with teams.
Management Thesis Advisor:
Michael Cusumano, Sloan Distinguished Professor of Management
Engineering Thesis Advisor:
Acknowledgements
Many people have contributed their knowledge, ideas, and encouragement toward the creation of this thesis. To those people I am truly grateful.
First and foremost, I would like to thank Bill Crandall, my manager at HP for the length of the internship. An alum himself (LFM'94), Bill is well familiar with the LFM program and recognized the benefit that an LFM internship could bring to this project. Bill originally conceived the conceived the structure and goals for the project. Yet gave me the freedom to run the project how I saw fit, so that I brought an outsider's view to the problem. Also, he gave a lot of his time, in terms of mentoring, lending his expertise, and encouraging me, which helped me learn a great deal.
My management advisor, Michael Cusumano, was also instrumental in creating the thesis. Although, he has been overloaded with a book release and two landmark trials, he still has been able to devote adequate time to advising me. Michael is truly a "guru" in the field of software development and gave me much insight into how to conduct research in this area.
Daniel Jackson, my engineering advisor, was a great resource. He provided a wealth of advice to help me better manage the research process and methods.
The "Evo team", consisting of several PGC consultants was also essential during the internship. Besides Bill, the team consisted of Nancy Near, Guy Cox, Ruth Malan, Derek Coleman, and Todd Cotton. Without their continual feedback and guidance, this project could never have gotten off the ground. Further help at HP was given by Elaine May, perhaps HP's leading expert with the process, who also gave valuable feedback on my work. Also, I am grateful to the teams that let me interview them for the case studies, particularly the project managers, which helped organize the process.
Tom Gilb, the originator of Evolutionary Development, also helped guide the project several times throughout its course. Tom's great skill as a visionary in the field helped us see the project in new light.
Lastly, I'd like to thank the LFM program, which organizes the internship process and provided a great education for me over the last two years. Thanks to all the directors, faculty, staff, and students.
Table of Contents
1 IN TR O D U CTIO N ... 9
1.1 CONTEXT ... 9
The internship...:... 9
Software developm ent processes ... 9
Current software developm ent trends ... 9
Software developm ent at H P ... 9
1.2 LIFECYCLE PROCESSES MODELS... 10
1.3 EVOLUTIONARY SOFTW ARE DEVELOPMENT AT HP ... 11
1.4 PROBLEM DEFINITION ... 11
1.5 STRUCTURE OF THE THESIS ... 12
2 DESCRIPTION OF EVOLUTIONARY DEVELOPMENT ... 13
2.1 BENEFITS OF EVOLUTIONARY DEVELOPMENT... 13
Increased visibility of progress ... 13
Reduced schedule risk ... 13
Reduced risk of custom er acceptance... 14
Reduced risk of integration ...
14
Early introduction to market ...
14
Increased m otivation of development team ... 15
2.2 COM PARISON TO OTHER LIFECYCLE MODELS ... 15
Waterfall D evelopm ent ... 16
Rapid Prototyping ... 16
Increm ental D evelopm ent... 17
Evolutionary D evelopm ent ... 17... 7
RELATIONSHIP OF M ODEL BENEFITS AND COSTS ... 17
3 RESEA R CH M ETH O D O LO G Y ... 19
3.1 CREATION OF A PAST PROJECT MATRIX... 19
3.2 CREATION OF CONSULTING MODELS ... 19
3.3 CASE STUDIES... 20
3.4 W EEKLY MEETINGS ... 21
3.5 CONCLUSION OF BEST PRACTICES ... 21
3.6 PILOT TEST OF BEST PRACTICES ... 22
4 O V ERV IEW O F CA SE STUDIES ... 23
4.1 DEEP FREEZE ... 23
4.2 REDW OOD FIRM W ARE ... 23
4.3 CASPER ... 24
4.4 BISTRO ... 24
C CONCLUDED BEST PRACTICES ... 26
5.1 PHASE I: Ar END G ROUND SCHOOL... 26
Understand Evo philosophy ... 26
D evelop product concept... 26
Set project goals ... 27
Identify risks and dependencies of project ... 28
Create plan for "Flight Plans" stage... 28
5.2 PHASE II: M AKE FLIGHT PLANS... 29
D evelop initial requirem ents ... ... 29
Develop high-level architecture...29
C reate developm ent environm ent... 30
C reate Evo plan for "M issions" stage ... 31
5.3 P H A SE III: F LY M ISSIO N S ... 33
Takeoff and land frequently--design, develop, integrate, and test incrementally ... 33
Evolve requirements and architecture... .... 34
Keep your eye out the window--get user feedback early and often ... 34
Build
frequently
... 35D ebrief after each m ission...---... 35
6 GENERAL CONCLUSIONS ...----....--... 37
6.1 PRO CESS PREPARATIO N ... 37
6.2 PROCESS PHILOSOPHY ... ... 37
6.3 T EA M CO M PETEN CE ... 37
6.4 CREATING THE "RIGHT PRODUCT" ... 37
6.5 M OTIVATIONAL IM PLICATIONS... 38
7 RECOMMENDATIONS FOR FUTURE RESEARCH ... 39
7.1 Q U A N TITATIV E STU D Y ... 39
7.2 IMPORTANCE OF FLEXIBLE ARCHITECTURES... 39
7.3 TAILORING OF THE MODEL TO SPECIFIC NEEDS (LARGE TEAMS, NEW MARKETS, ETC.)... 39
7.4 RELATION TO OPEN SOURCE SOFTWARE (OSS) METHOD...40
BIBLIOGRAPHY ... ... 41
APPENDIX I: PAST PROJECT MATRIX DESCRIPTION... . . ... 43
ROW S AND COLUM NS OF THE M ATRIX ... 43
N OTES O N THE DATA ... 43
CONCLUSIONS FROM AGGREGATE DATA.. . ---.... -... ... 43
APPENDIX II: FULL TEXTS OF CASE STUDIES ... ... ... ... 44
D EEP FREEZE ... 41
REDWOOD FIRMW ARE ... 44
C ASPER... ... 48
1 Introduction
1.1 ContextThe internship
Research for this thesis was conducted during a six-month on-site internship as a part of MIT's Leaders for Manufacturing (LFM) Program. LFM is a partnership between 14 major U.S. manufacturing
companies. Fellows of the LFM pursue both a master in management and a masters in engineering during the 24 month program. Internships are generally setup so that the student can both perform valuable research worthy of an MIT thesis and also make a significant impact on the sponsoring company.
Software development processes
In the 50 years that computers have existed, most of the focus has been on hardware. Creating hardware has always been orders of magnitude more difficult than creating software. Money was made from selling hardware, not software. Hence, many processes were created to better manage the creation of
hardware, while software was usually slapped together quickly by a small team and updated later if bugs were found.
Nowadays, thanks to the increase of CPU power, software code bases are much larger and more complicated than ever before. To create operating systems and major applications, teams of several
hundred programmers are required. To manage teams today, large and small, developers must use stricter processes. However, existing software processes are much less developed than their hardware
counterparts.
Because few software practices have become dominant standards, one group may use a vastly different process than another. Also, since groups have different interpretations of the processes, even two groups using the same process may be running it very differently.
Current software development trends
Just as with the development of computer hardware, the need for fast development cycles is great. Releasing a product a few months early or late can sometimes be the difference between success and failure. Groups often consider schedule to be their highest priority.
There is a wide variety of process competence between software groups today. Yet, the importance of process capabilities is being more realized lately. Much of the recent focus on process is thanks to the Capabilities Maturity Model (CMM), created by Carnegie Mellon's Software Engineering Institute. The CMM is a highly popularized tool, which helps a team benchmark its process capabilities against other software groups. Based on the responses to the CMM questionnaire, teams are assigned a number
between I and 5, where a higher number means higher process competence. Knowledge of the CMM has been wide spread in the U.S., and teams often set explicit goals of transitioning to a higher CMM rating over periods of time. (Note that the CMM does not include a lifecycle model, and hence it is not compared directly to the models presented in section 2.2.)
Software development at HP
Hewlett Packard, traditionally known as a "hardware company", is finding itself developing more and more software. Like many companies, HP now employs more software engineers than hardware
engineers. Still, since few of its end products are strictly software, the company still views itself as mainly a hardware company. Many of the goals set for software projects are derived from goals used for hardware teams. For example, teams sometimes tend to focus on quality more so than innovation and cycle time.
To assist the specific needs of the many software development groups, an internal software development consulting group was setup. Process Generation Consulting (PGC), formerly the Software Initiative, has been assisting various software teams with both technical and managerial issues for the last 12 years. Since this group has easy access to many HP software teams that use similar processes, it is an ideal group from which to conduct a research study. PGC hired me to study how its customers were using one particular process, Evolutionary Development.
In recent years, as an effort to combat the lack of revenue growth, HP upper management has been preaching the value of new product generation. Most of the company's revenues now come from new products and versions of products introduced in the last 2 years, which it proudly publicizes. Yet, there is a drive to be even more reliant on new products and product versions. Thus, demand for processes that assist with new products and allow faster cycle times is high. Many groups, when adopting a new software process, request the assistance of consultants from PGC to help them ease the transition to the new process.
1.2 Lifecycle processes models
Software lifecycle processes help manage the order and interrelationship between the various stages of development. The major development stages are investigation, design, implementation, and test. Several
models have been used to base processes upon. The simplest and most traditionally used model has been the "Waterfall" model. In the waterfall model, the 4 stages occur serially, without overlapping or
repeating. Before the Waterfall, groups often lumped the stages together. When this occurs, rework often results from tasks being performed without proper groundwork and planning. By helping teams avoid such rework, the Waterfall model has served developers well for many years.
Yet, there are many limitations to Waterfall Development. Creating hard transitions between stages makes it difficult to go back and change decisions that were made in previous stages'. Because of this major limitation, new lifecycle models have been introduced in recent years.
The Spiral Development model2
, introduced by Boehm in 1988, received much attention. The model allows teams to create a product in a handful of cycles of increasing magnitude. With the primary
intention of reducing development risk, each cycle included checkpoints for risk assessment. Many teams have created processes based on the Spiral model, and many are satisfied with it. However, the Spiral model has often been criticized as being too complicated for most development teams.
Several other models have been also introduced. The various models have much in common with each other. However, there are some aspects which distinguish one model from another. For example, cycles are present in many of the models, borrowing the concept of PDCA cycles from Total Quality
' Steve McConnell, Rapid Development, Microsoft Press, p. 138.
2 Barry Boehm. "A Spiral Model of Software Development and Enhancement", IEEE Computer, May 1988, pp.
Management. However, some models involve only 3-5 cycles, while others involve 20-50. Also, when groups implement a model into their software process, the implementations of the models often differ vastly. Developers often decide to add or leave out certain aspects that the models recommend, usually for purposes of simplification. Because of the similarity of the models and the variation of their
implementations, there is much confusion over the differences between them. McConnell has compared 10 models for development in recent work, yet there is still much overlap between the models. Hence, it is often arguable which model a given development project is based on.
This thesis is not attempting to redefine the various lifecycle models. Yet, for the purposes of distinguishing between them, we will use some characteristics of the models to create working definitions. The conclusions presented here are not only applicable toward users of Evolutionary and Incremental Development, but also for other processes that share the characteristics of having iterative cycles and/or utilizing user feedback.
1.3 Evolutionary Software Development at HP
Evolutionary Development, often called Evo, was first introduced by Tom Gilb, in the book Principles of Software Engineering Management.4 Like many other lifecycle models, Evo was proposed as an
alternative to the waterfall model. Gilb has further defined the process and created tools to aid it in later works.
Elaine May, as a project manager, was the first to formally use the process at HP in 1991. Gilb was hired as a consultant to help the group adopt the process. May's team discovered that it was possible to relax some of Gilb's instructions for implementing Evo. In particular, they used internal or "surrogate customers", to give much of the user feedback, because of the difficulty in using external customers5. After the project, May left the team to join PGC as a software process consultant. There, she helped other teams throughout the company similarly adopt the process. After her departure from the group in 1995, PGC continued to consult on the process.
Since 1991, PGC has assisted around 30 HP teams with the process over the last 8 years. Teams have varied the process dramatically, and some have had great success, while others have failed. Some of the failures have been attributed to early lack of confidence in the process, as well as increased overhead in running the process6.
1.4
Problem Definition
The problem as defined by PGC managers was to determine why some groups found Evo to be greatly beneficial, while others have found it mediocre or even aborted the process midway through a project.
Because the process is regarded so highly, most all of the consultants in PGC would prescribe groups to shift from Waterfall Development to Evolutionary Development. However, recent failures to adopt the process cast some doubt on Evo's image as the "miracle cure". What was most interesting was the disparity between some teams' classifications of the project as successful and other teams' claims that it is
4 Tom Gilb, Principles of Software Engineering Management, Addison Wesley, 1988.
5 Elaine May and Barbara Zimmer, "The Evolutionary Development Model for Software Development", HP
Journal, August 1996, p.1.
6 May and Zimmer, pp.3-4
ineffective. PGC consultants hypothesized that the process had great potential, yet it would succeed or fail, based on how it was implemented. Perhaps teams were basing critical decisions such as their cycle lengths based on intuition, when there might be a better method to decide such parameters, based on studying the success of past projects.
Thus, my task was to determine how teams could better handle implementation decisions, in order to make their Evo adoption more effective.
1.5 Structure of the thesis
This thesis begins by defining and describing Evolutionary Development in Chapter 2. In order to make the definition more clear, the evolutionary model is compared to 3 other lifecycle models. Also, the relationships between the 4 models is discussed, as well as the benefits of transitioning from one model to another.
Next, Chapter 3 describes the research methodology I used in conducting research and generating best practices.
Chapter 4 is a summary of the four case studies that were performed on teams that had used Evolutionary or Incremental Development to produce a product. Full texts of the cases are included as appendices.
The next section, chapter 5, lists the best practices that were concluded from the research. These best practices are grouped into 3 stages, according to when, chronologically, they are applied during a project. For each best practice, reasoning behind using the practice is discussed, as well as heuristics for
implementing the practice.
Chapter 6 then presents some general conclusions about the about the process and how HP software groups operate in general. Included here are discussions of the most critical best practices, barriers to success with the process, and the organizational impact of the process.
Finally, chapter 7 lists the topics that this study did not yet address and provides some insight into what research can be performed in the future, concerning software lifecycle processes.
2 Description of Evolutionary Development
Evolutionary Development (Evo) is a software development methodology in which a product is created via many iterative delivery cycles, while gathering of user feedback regularly during development. Within each delivery cycle, the software is designed, coded, tested and then delivered to users. The users give feedback on the product and the team responds, often by changing the product, plans, or process. These cycles continue until the product is shipped.
2.1 Benefits of Evolutionary Development
Groups decide to follow an Evolutionary Development model for various reasons. At HP, managers generally state 2 or 3 of the following benefits as their motivation for using the process.
Increased visibility of progress
Because the product is developed in cycles, each cycle boundary serves as a checkpoint for progress. The traditional method of estimating progress, where team members estimate what percent of their code is complete, is highly inaccurate. In the evolutionary approach, features are developed serially and are checked into a working code base upon each feature's completion. Progress monitoring becomes much
more accurate, since features are deemed complete when they are both integrated and runable.
Reduced schedule risk
Developing features sequentially allows teams to save low priority features for last. Then, if the schedule slips, the latest cycles can simply be skipped to pull in the schedule. Compared to the waterfall approach, which usually requires a project to build all desired features in parallel during a single development phase, this approach makes the project much more likely to hit its market window.
Figure 1: Ability of the lifecycle process to adapt to schedule changes
Reduced risk of customer acceptance
Evolutionary Development involves getting feedback from customers (and those who can act as customers) throughout the development process. This feedback often helps the team make critical decisions about the interface and feature set, so as to increase the odds of customer acceptance.
Reduced risk of integration
Big bang approaches, in which all subsystems are integrated at the end, can become a huge time sink at the end of a project. Several projects at HP have spent months or even failed because their integration has been overly complex. (The rationale is as follows. If 1 bug caused by I new code section takes 1 minute to fix, then 10 bugs caused by 10 new code sections will take >10 minutes to fix, because there is more new code to sift through when searching for each bug.) Incremental integration at every cycle boundary reduces this risk.
Early introduction to market
Early versions of the product can be easily released with only the major features available. Only a brief Q/A phase is needed to complete the product after the team concludes that the current cycle should be the last.
Hitting Market Windows
Waterfall:
Original Plan
Investigate Design Implement Test
Actual Plan =Market Window
Investigate Design Implement
- actual project checkpoints You know you're in I trouble!
EVO:
Original Plan
Investigate Design Cycle I ... ycle N-I Cycle N 'Sys Test
Actual Plan - 1 (eary release)
investigate Design Cycle I ycle N- S Market
Actual Plan -2 (adidefeatures or schedu[e slippage)
Investigate Design Cycle I '[ycle N- Cycle N ycle N+l
Increased motivation of development team
Seeing a working product evolve every cycle is usually a rewarding experience for developers. One team member's check-ins become immediately available and usable by others.
2.2 Comparison to other lifecycle models
There are two major characteristics of Evolutionary Development that make it distinct from other models: ( 1) delivery of the product in short discrete cycles, and (2) early and frequent user feedback. Most lifecycle models can be differentiated based on how strictly they adhere to each of these characteristics.
A delivery cycle is defined as a portion of the project's implementation phase, which concludes with a working product (or the software portion of a product). Some software projects do not integrate the code together into a single executable until the end of the project, thus creating only one delivery cycle. Other projects are divided up into multiple deliveries for various purposes. The upper bound observed at Hewlett Packard is around 50 deliveries, in which about 2% of the project is developed in each cycle.
User feedback can be any sort of feedback the team receives from an end user or someone emulating an end user. The primary purpose of this feedback is to help the team decide which features are important in the product and how those features should be implemented to best meet the user's needs. The latest when feedback can begin is at the product's release to the market. (Most products receive their first user feedback at their Beta release, at which time most of the feedback is used for bug fixes.) The earliest that a product can receive feedback is at the beginning of the implementation phase of the project, by creating a prototype or patching together a few key features to deliver to users.
For simplicity, we will consider only 4 development models: Waterfall, Incremental Development, Rapid Prototyping and Evolutionary Development. These definitions shall be working definitions for the purposes of this analysis, and are not meant to undermine definitions that are currently used by others.
The figure below shows how the four models relate to the two characteristics:
At beginning of implementation
When user (early)
feedback begins At product release (late) Pure Waterfall
Figur
manyNumber of delivery cycles e 2: Model comparison matrix
Page 15 Pure Evolutionary Development Rapid Evolutionary Prototyping Development Development Waterfall Incremental Development Development
Timeline diagrams are now shown to further illustrate the differences between the models:
Waterfall Development
Figure 3: Waterfall Development Lifecycle (1 cycle, no user feedback)
The traditional Waterfall model strings together investigation, design, implementation, and test phases sequentially and there is usually no delivery of a working product until the end of the project. Thus, there is only one delivery. There is also typically little or no user feedback involved in the process until late, often at beta release time or later.
The Waterfall model is strong in creating explicit checkpoints between phases and allowing groups to move forward with confidence. However, it is often criticized for making it difficult to backtrack to previous phases in order to make changes.
Rapid Prototyping Development
/User Feedback
Investigate Prototype Design Implement Test
Figure 4: Rapid Prototyping Development Lifecycle (1 cycle, early user feedback)
For Rapid Prototyping Development, we assume a basic Waterfall model with the added measure of prototype creation early in the product's implementation phase. Prototyping is usually performed either to (1) assess customer acceptance or to (2) assess feasibility of a new technology. Both are considered forms of user feedback, even though developers may be emulating the user when evaluating the prototype. It is conventional wisdom to throw away the prototype and start from scratch since the prototype is not based on a thoroughly planned architecture. (Note that user feedback here is slightly earlier than that of Evolutionary Development, since the feedback occurs before the design phase. Evolutionary Development can also be managed with a throwaway prototype up front, in order to push user feedback even earlier.)
The benefit of prototyping is the knowledge gained from early feedback. Adjustments can be made or the project cancelled if deemed appropriate. The downside is that prototyping efforts consume valuable resources and early feedback is never entirely accurate. Also, managers and customers may mistakenly assume that the whole product is "almost ready" after seeing the prototype.
Incremental Development
Figure 5: Incremental Development Lifecycle
(many cycles, no user feedback)
Incremental projects generally contain 3 or more delivery cycles, where a working executable is ready at the end of each cycle. Some projects contain 3-5 long cycles are usually described as "milestone
approaches" or "phased development." Other projects contain around 50 short cycles, around 1-3 weeks each. No user feedback is collected until product release or upon release of the Beta version at the earliest.
Products are usually generated via delivery cycles to allow the team visibility of progress at the end of each cycle. If progress is greater or less than what was predicted, the schedule may be adjusted by adding or skipping features in the product. Also, continual integration makes a project more manageable by reducing risk from big-bang integration and helping teams spot problems earlier. The cost of the process is usually the extra overhead of management tasks at each cycle boundary.
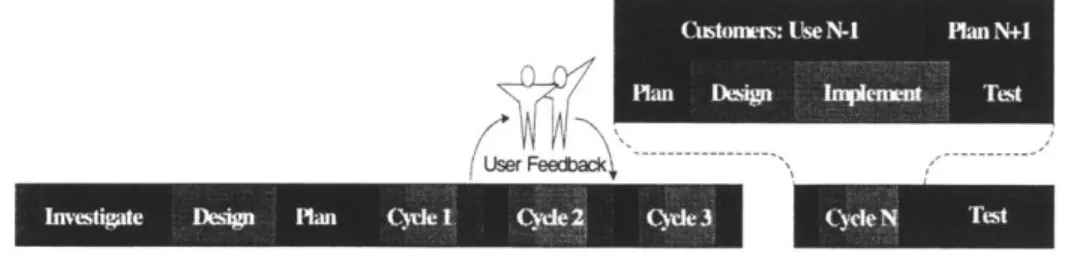
Evolutionary Development
Custon : Use N-1 PIlan N+1 Plan Design
Implement
TestFigure 6: Evolutionary Development Lifecycle
(many cycles, early user feedback)
Evolutionary projects contain both many cycles and early feedback and take advantage of the synergy between the two characteristics. In products with many delivery cycles, since a working product is ready at the end of each cycle, this product may be used to get feedback from users, often with little overhead.
The benefits, therefore, of Evolutionary Development are the sum of the benefits of both Rapid Prototyping and Incremental Development, without consuming resources normally required for
prototyping. However, the downside is that the effort required in project management tasks is increased somewhat over Incremental Development, due to managing the relationship with and the delivery to the users.
2.3
Relationship of Model Benefits and Costs
Few development experts will claim that one of the four models is best in all cases. Rather, each project's needs and resources will determine the optimal approach. Evolutionary Development, the most complex of the models, yields the most benefit, but also the most cost. In moving to a more complex model, one must tradeoff the benefit with the associated cost.
Page 17
Investigate Design Plan Cytle I Cyde 2 Ccle 3
Plan Design ,Impl eent , Test
---U"s Feedbk& *,
Investigate Desig Plan Cycle I CydieZ Cycle CVcWN1 Test
When moving from the bottom to the top of the chart, earlier feedback allows teams to make more changes to better meet customer needs. Also, feedback helps teams respond more quickly to changes in the technology or the marketplace, such as moves by competitors. Therefore, moving up the chart gives a
project higher probability of building "the right" product. However, this benefit comes at the cost of higher effort in managing the user relationship. To serve this effort, groups usually designate a user
liaison to manage such relationships.
When moving from left to right on the chart, we find that increasing the number of delivery cycles yields a greater visibility of progress. It also gives a project more manageability in terms of reducing integration risk and making breakages visible sooner. Yet, the cost incurred is in the increased effort in managing
cycle boundaries. This means that someone, often the project manager, must spend many extra hours
each cycle in planning and rescheduling.7
The figure below graphically displays these benefits:
11
I
IIL!h I 'iii I.'H 1'(/:f coStI
e/ri in managing the reationship EarlyWhen
user
feedback
begins
Late Pu Waterfa e 11 Pure Evolutionary DevelopmentNumber of delivery cycles
Project anageability. Prog('ress Visibilitv
Higher effort in managing cvcle boundaries
benefit
cost
Figure 7: Model comparison matrix with benefits
Rapid PR pi. Evolutionary Prototypmng Development Development Waterfall Incremental Development Development m1anly3 Research methodology
3.1
Creation of a past project matrix
By working as an intern in PGC, I had access to data from all of the projects that hired PGC to assist with their Evolutionary Development process. Most of the knowledge about the process still existed in the heads of the consultants and the project managers they assisted. However, some of the consultants did compile a matrix of past projects in 1995, when PGC last examined the process for critical success
factors. The matrix contained only around 10 projects as row headings and a handful of column headings, such as cycle length, factors that occurred during the project, and key learnings. My first task was to expand this matrix to contain more projects and enough additional fields, such that conclusions could be drawn.
Counting the projects between 1995 and 1998, the total number jumped to 30. I also added around 20 more fields to hold data about the projects that might be relevant. The first fields that were added reflected success. Because success of the project was different than success of the Evo process, we used two separate fields to track success. The rest of the fields were chosen, based on which variances between projects had a likely chance of influencing the success of the Evo process. (See Appendix I: past project
matrix description for a list of column headings.)
Next, filling in the blank matrix proved to be a challenge. Many of the PGC consultants were still around and could be questioned about the projects they assisted. However, it was often the case that certain data about the project was forgotten, since it happened many years before, or that the data was never known. Also, the project managers themselves were somewhat difficult to contact. Several had left the company. Others, I was instructed by PGC not to contact, since they were potential future customers that should not be troubled.
Teams also did not often perform retrospective analyses of Evo's effectiveness. Instead, they would deem the process successful or unsuccessful and then move on. Evo is seen by most teams as either "good" or "evil", instead of being a model, whose implementations are the cause of success or failure. Hence, few written analyses of the projects were made, and it was somewhat common for project
managers to forget why the process was effective or ineffective. Hence, only about 50-60% of the entries in the matrix were filled.
Only a few conclusions could be made from aggregating the data in the matrix. (See Appendix I: past
project matrix description for conclusions from aggregate data.) Because there were so many process
variables that teams "tweaked", a variety of team and project types, and incompleteness of data, there was not enough data to make quantitative conclusions. (See Section 7.1 for quantitative study ideas.)
However, the project matrix was effective for reference during dialogue about past projects and it is a good tool to collect future data.
3.2 Creation of consulting models
Before conducting case studies, much time was spent creating consulting "models". A model, in this sense, is a short (usually one page) drawing or slide that represents an abstraction of the process. The purpose of these models is to convey an idea and to promote dialogue about the process. An example of such a model is the 2 x 2 matrix in chapter 2.
The models were used for discussions with consultants and process experts. Often these discussions would lead to the creation of new models. The models that were most liked were kept and evolved into more detailed slides. The interest in these models helped me decide which aspects of the process people would most like me to study.
3.3 Case studies
Four case studies were performed, from which conclusions were derived. Each case was based on a previous Evolutionary Development project at HP. Interviews were conducted with team members, and questions addressed many topics related to the implementation of the process.
Questions asked during the interviews fell into 5 categories:
I) Project and process concepts and goals 2) Team background
3) Software architecture 4) Handling of Evo cycles
5) Handling of user feedback
Category I was intended to address the initial organization phase of the project. Most questions concerned the selection of the Evo process, how the process related to the project goals, and how the goals were communicated with the team. Category 2 addressed mainly team experience in relation to the product and process. Both of these sections consisted mainly of short, quick questions to get background information that can be compared with other projects.
Categories 3-5 contained the bulk of the interview. Most questions were open ended, to inspire anecdotes about how well or poorly something worked in the process. Category 3 attempted to characterize the amount of focus the group spent on their architecture, and in particular, how much of it was created up front, versus in the cycles. Category 4 addressed the managerial issues that occurred in managing short, repetitive development cycles (e.g. order of development, handling schedule slippage, etc.) Finally, category 5 addressed issues related to gathering user feedback (e.g. how often gathered, who were the users, etc.). If the project did not gather user feedback, this time was spent focussing on hand-offs with other teams.
Selecting candidates for case studies proved more difficult than was originally thought. First, projects who were considered to have "process failures" were ruled out. It was thought that only one or two major factors caused such failures, and most of these factors had already been determined by PGC consultants or the development teams. Also, groups generally have cultural aversions to talking about past failures. Therefore, it was concluded that more would be gained by talking with teams that had mostly success with the process.
Next, many of the 30 past projects were ruled out because the teams were no longer available. Since the project manager typically takes the lead on installing the new process, teams whose project managers had left were immediately excluded. Lastly, several more teams were too busy or not interested in helping to create a case study. A couple teams were in the middle of "crunch mode" at the time or had recently completed analysis of their process and did not wish to spend a few hours with interviews.
The field of 30 was whittled down to a handful and 4 studies were conducted. The first two were conducted on-site, by interviewing 5-6 team members for an hour each. In each case, the interviewees consisted of the project manager, technical lead, user liaison (usually an engineer), and some developers.
This proved effective, since many of the focus areas were narrowed down after completing the first two studies. The fourth and last case was conducted via a series of emails with a project manager overseas.
The four teams had some similarities, by the nature of their relationship with PGC. Because of the variety of products at HP, software groups come in all shapes and sizes. Yet, most of teams that contact PGC for assistance have between 8-30 developers. (Teams with fewer than 8 members have less of a budget for consultants, while very large teams generally hire someone full-time to handle their processes.) Also, all four products were attached to hardware, and thus had to work closely with their corresponding hardware development teams.
The case studies were written up each as 3-4 page documents, with common sections, so that consultants and experts could easily compare them. Their full texts are presented as appendices (cleansed for external use) and short synopses appear in chapter 4.
3.4 Weekly meetings
Because an "evolutionary" approach was used to generate conclusions for this thesis (we were "eating our own dogfood"), the weekly meetings with PGC consultants and other experts were critical. In an effort to "practice what we preach", in-progress deliverables for the research project were presented incrementally, every two weeks, along with a progress report. User feedback was attained mostly from PGC consultants,
some of whom will use the consulting models that were created. Evo team meetings were held weekly and I -on- I meetings were held with each of them bi-weekly on average.
Thus, weekly meetings were held with an "Evo team", consisting of PGC consultants whom had expertise related to the process. Team members were:
Bill Crandall - Intern mentor, some consulting experience with Evo
Nancy Near - consulted on many Evo projects
Guy Cox - social anthropology background, some consulting experience with Evo
Ruth Malan - architecture expert
Derek Coleman - architecture and requirements expert
Todd Cotton - consulted on many Evo projects
Other experts were contacted less frequently, but provided valuable feedback:
Tom Gilb - creator of Evo (contacted every 2 months)
Michael Cusumano - renowned researcher of software development, thesis advisor (contacted monthly)
Elaine May - originated Evo usage at HP, currently a Lab Manager at HP (contacted monthly)
3.5 Conclusion of best practices
Most of the best practices presented in chapter 5 were concluded from discussions related to the case studies or projects in the past project matrix. When Evo team members agreed that a practice that a group performed or neglected to perform impacted its success, the practice was generally included in the list of best practices.
For each non-obvious recommendation in the best practice section, sources are listed in brackets, following the recommendation (except when literature is footnoted). An explanation of how the source relates is included if relevant. Sources are from one of the following:
1) Past project data 2) Case studies
3) May and Zimmer, a paper based on a previous HP study on Evolutionary Development (footnoted)
4) Relevant literature (footnoted)
5) Recommendations from interviews with experts
As a caveat to the reader, please note that the best practices are not based on enough data to be
statistically conclusive. However, each of them has passed a panel of experts in Evo, including most of the people listed above, in section 3.5.
The best practices were stored and presented to individuals in the form of a consulting model. The model started as a single page graphic, which separated the process into 3 phases, chronologically. Best
practices were added into their corresponding phase, and the model soon expanded into a 7-page slide set. To house additional notes and ideas that could not be classified as best practices, a 20 page slide set was created which contained a page or more on each of the subcategories in the best practice model. These notes were called heuristics. In general, the best practice model describes the "what" of the process (i.e. what to do), and the heuristics answers the "how" (i.e. how to do it). Both of these slide sets were then combined to create chapter 5.
3.6 Pilot test of best practices
Finally, to validate the compilation of best practices, a pilot test was performed. The slide set was presented to a couple members of a team that was considering using the process for the first time. The team claimed that the material would be very valuable, yet they could not afford consulting services for their project.
However, as PGC consultants continue to assist HP groups with the process, they will use the list of best practices and attempt to validate its usefulness and correctness.
4 Overview of case studies
The approach to analyzing best practices for Incremental and Evolutionary Development involved creating four separate case studies of evolutionary projects at Hewlett Packard. The studies were created
via interviews with between one and six team members, retrospectively. Two of the projects had completed within a few months of the study, while the other two completed two to three years prior. All four groups were software development groups for an end product that included both hardware and software.
(Even though all of the teams refer to their processes as "evolutionary", some teams did not collect significant user feedback, and thus were using Incremental Development, instead.)
4.1 Deep Freeze
The Deep Freeze project is a clean-cut example of a successful transition from Waterfall to an incremental process. The product was the software component for a semiconductor test system.
Management clearly defined the risks of the product up-front. There was significant risk in meeting the target performance and also in meeting the development schedule. A cyclical development process was used mainly to make progress visible, in order to manage project risks. The team decided not to
incorporate user feedback into the process.
The seven software developers were well experienced, yet had never used an incremental process before. Since they were required to write progress reports at the end of each cycle, many developers were not initially fond of the new process and its associated overhead. However, when they realized the importance of the reports to management, they soon regarded them as a trivial routine task.
Since there was a high schedule risk, low priority functionality was planned for the later cycles. In this way, these later cycles acted as a schedule buffer, in case the schedule slipped. Some of these features were indeed pushed off to the next product iteration, so that the schedule wouldn't slip.
The final product had phenomenal market success. It released within 2 months of the original target (total project length was 18 months), while the competitor's product was a whole year late. The group has since then, used the process in much the same way.
4.2 Redwood Firmware
The Redwood Firmware group, which developed firmware for a printer, was also successful with their adoption of the Evo process, even though they were part of a much larger development team. The firmware team had to interface with both the hardware and software teams for their product.
The software team was also using an Evo process for the first time. However, while the firmware team used 2-week cycles, the software team chose 3-week cycles. In the end, this didn't pose much of a problem, since the two teams were not very reliant on each other's releases.
Managing interactions with the hardware team proved more of a challenge. The hardware team was not using an Evo process, but the team was very dependent on new firmware releases. Since the firmware from the previous product was "broken and rebuilt from scratch", the hardware team could not use some of its basic functionality during the early phases of the project. Although, the decision to build the
firmware from the ground up had little to do with the firmware team's Evo process, the hardware team associated Evo with these problems, and subsequently formed a disliking of the process.
Team members also noticed that Evo requires developers to use their planning skills more than before. New engineers are notoriously optimistic when planning schedules, until they become more familiar with development efforts. On Redwood, there was often slippage due to overoptimistic estimations. However, by the end of the project, the accuracy of estimations had improved.
The firmware team met most of its goals and was very satisfied with using Evo. (Market success is too premature to determine.) One of the largest impacts of the process was that by forcing the team to do much of their detailed planning up front, many critical dependencies were determined. (The first 5 cycles were planned in detail before cycle 1 began.) However, the project manager said that the Evo process required much more of her time than previous processes.
4.3 Casper
The Casper team was developing the latest product in a line of Network Protocol Analyzers, the first of which to have a GUI. Evo was originally considered as an effort to improve quality up-front in the project, however, the team soon realized other benefits.
Since the team was releasing a product every 2 weeks, their progress was very visible, and they received much attention from management and marketing. Also, the incremental process allowed them to avoid the "big crunch" which often occurs at the end of projects.
Marketing personnel were utilized to give user feedback on the product. This worked well for getting feedback on the GUI, since there are always many usability issues of new interfaces. However, the team did not get feedback from any customers until late in the development process. At that point, demand for a key feature was realized, but it was already too late to implement it. Although the marketing team members were cheaper to use, they did not have the same knowledge of customer needs that actual customers had.
The project ended up meeting most of its goals and concluded that the new process was beneficial. Market success of the product, however was less than expected, due in part to the exclusion of the key feature. Team members enjoyed the visibility that the new process created. Yet, just as with Redwood, the project manager found that the process increased her workload.
4.4 Bistro
The Bistro team, which developed software for a printed circuit board tester, had mixed success with its incremental process. The project employed 23 software engineers, split into 2 main teams, with a project manager for each team. One of the teams focussed on throughput speed, while the other implemented a radical new feature. The new feature had a high degree of technology risk, and required several
mathematicians to help with the development.
The group is one of the earliest adopters of Evo at HP, and has been using some form of the process for 8 years. Although previous projects have involved significant user feedback, Bistro used very little of it. The reason is that their customers are highly risk-averse and are usually reluctant to use a product that has not been thoroughly tested. (Some groups find that this is an encouragement to have Evo users, since the product can then be marketed as having been used longer.)
A remarkable disappointment with the project was the slippage in schedule of the new feature. Its
schedule slipped so much that it was pushed off into the follow-on product. Several redesign efforts were necessary in the feature's development, each of which set it back by more than a month. Team members suggest that more up-front design effort should have been used for the feature.
On the upside, the performance goals of the project were met, and the team thought that their process was successful.
5 Concluded best practices
5.1
Phase I: Attend Ground School
Much like military pilots spending time in the classroom, development teams must spend some time in meeting rooms learning about the process, deciding how to tweak the process to meet their needs, and satisfying some entry criteria for the process. It is important that all affected team members, including project managers and oftentimes marketing personnel attend, to assure that the process meets everyone's needs.
Understand Evo philosophy
V Recognize the benefits and costs of frequent iteration and early & often user feedback V Learn philosophy by comparing approaches and results of Evo and non-Evo projects
Since Evo requires expending some additional effort, it is extremely important to educate the entire team about the process, so that everyone will realize what value is achieved from the extra effort. Also, since there are many ways to implement the process in order to achieve different benefits, teams need to be aware of the "knobs" in the process, and what results are achieved by turning them.8 (See section 2.3 for
major process knobs and their associated costs and benefits.)
Many teams confuse Evo with the "milestone approach". Milestones, like evolutionary approaches, help avoid the "80% syndrome", where developers often incorrectly estimate that a task is 80% complete.9
Yet, Evo has the additional requirement that a working product be delivered each cycle to measure progress and usefulness. If a working product (or partial product) is not delivered at the cycle boundaries, then user feedback cannot be given and progress cannot be easily measured.
An important heuristic to follow is to implement software "depth first", or one feature at a time, instead of "breadth first", or developing them all simultaneously. By developing depth first as much as possible, it will be easier to release a working product early with minimal functionality and it will be easier to smoothly distribute the release of new features.
One should also note that Evo is an "organic" approach, and thus its philosophy differs from
"mechanistic" approaches. For instance, Waterfall Development, a mechanistic approach, assumes that requirements are well known and unchanging from the start. However, Evolutionary Development assumes that requirements are only partially known and will change during the project.
Develop product concept
V Translate customer needs into product concept that captures key features, quality attributes, and components
V Have a value proposition that answers the question, "why will customers buy your product vs. the competition's?"
Past project data shows high correlation between the team clearly understanding the Evo value proposition and success with the process.
Creating the original concept for the product is not a trivial task. If basic characteristics of the product are not outlined at the start, defining proper project goals and creating a software architecture will be difficult. Even though these characteristics may change slightly during the development process, it is always best to set an initial target. A clear value proposition will also help guide prioritizing and decision making, and will make it easier for users and developers to understand why some changes are approved and others are not.'0
Much research has been performed in the area of product concept development. Concept Engineering", a process developed by the Center for Quality Management, deals with clarifying the "fuzzy front end" of the product development process that precedes detailed design and implementation. Also, Crossing the Chasm", and related work by Geoffrey Moore, deals with value propositions.
Set project goals
V Set quantified targets for results (schedule, budget, market share, profit, revenue)
V Prioritize them
V Communicate them to the team and stakeholders
Once the product concept has been created, project goals can be set. Goals should be quantified", prioritized, and communicated to the team and stakeholders. Since the Evo process requires multiple people to make decisions often, alignment on project goals will aid the decision making in the project.
The most common method of setting team goals and making them public is by creating a compelling project vision, and then putting it on a banner on the wall. However, quantified targets are seldom posted on the wall for proprietary reasons. Yet it recommended conveying such information to key stakeholders by whatever means is appropriate.14
(Some groups, for example, use password-protected web pages to post such data.) The most common stakeholders for projects are:
* developers * customers * marketing
e sales representatives * test team
* dependent teams (e.g. hardware team)
10May and Zimmer, p. 6.
"Center for Quality Management, Concept Engineering, 1996.
12 Geoffrey A. Moore, Crossing the Chasm, HarperBusiness, 1991.
"3 Personal interview with Tom Gilb, 8/1/98.
4 Casper did not have an explicitly stated vision and each had conflicting motivations about whether to release the
project early. Redwood Firmware and Deep Freeze both had explicit vision statements and did not have such problems.
Most project managers use an informal process to create goals before the requirements creation phase. However, Tom Gilb, creator of Evolutionary Development recommends a more formal process, such as his planning language, Planguage' .
Identify risks and dependencies of project
V List the primary risks expected from product, process, people, and technology V Consider how Evolutionary Development can help overcome these risks V List key dependencies
Listing the project's major risks and dependencies will make explicit to the whole team the things that the experienced members are worrying about. In that way, everyone can help navigate through these murky waters. 6 Some common risks are schedule risk, uncertain product requirements, feature creep, new team
member risk, and new technology risk. Common dependencies often involve deliveries to hardware groups, sub-teams, or trade shows.
In most cases, Evolutionary Development will help to reduce a project's overall risk. The types of risk that Evo helps mitigate are:
* schedule risk
* customer acceptance risk (e.g. from unknown requirements) e component integration risk
e team motivation risk
However, one must keep in mind that introducing Evo for the first time creates new risks. Some commonly encountered new risks are:
e acceptance of the process by team
e managing delivery to dependent teams * feature creep
e difficulty in obtaining early users e testing neglect during the cycles
e temptation to skip up-front architecture and design work Create plan for "Flight Plans" stage
/ Define evolutionary plan for gathering initial requirements, defining high-level architecture, creating development environment and preparing for development
The next phase of the process, "Make Flight Plans", can be performed in an evolutionary fashion by breaking down each of the tasks into sub-tasks and creating frequent checkpoints. For instance, architecture can be broken down into first setting the principles and style and then secondly breaking down the system into components. Creating sub-tasks and checkpoints allow for easier progress monitoring and allow dependencies to become more recognizable. 17
1 Tom Gilb, (see http://result-planning.com)
" Redwood failed to identify the dependency between the hardware and firmware teams. Bistro's schedule slipped dramatically from high technology risk.
While the process gurus usually recommend such cycling for the middle stage, some project managers believe otherwise. Hence, it is important to recognize the pros and cons and formulate a decision for your own team. "Investigation phases" are generally somewhat amorphous with developers not yet in the mode of thinking about deadlines and dependencies with other teammates. Evolutionary planning for this phase will add more structure, and give managers more progress visibility in order to manage a schedule-driven project. However, some argue that this structure is too constrictive for developers and that such detailed planning will stifle new ideas.8
5.2 Phase II: Make Flight Plans
Now that the team has completed Ground School, they are ready to start planning for the mission. Several activities need to be performed up-front before implementation begins. The four main activities are (1) requirements, (2) architecture, (3) creating the development environment, and (4) project planning.
Develop initial requirements
V Identify functional requirements and quality attributes for customers and stakeholders
According to Tom Gilb, requirements definition is the one area where software projects have the most need for improvement. For evolutionary projects in particular, it is important to make requirements explicit especially if the team plans to utilize user feedback to better match the product with customer needs. If so, these requirements will be changed and refined by analyzing the user feedback data.'9
In my experience, it is rare for groups to keep a formal requirements document that is updated after analyzing user feedback data. The reason for this discrepancy is unknown. However, this is what process consultants recommend.
Requirements definition is an entire discipline of its own, with likely more literature available than all of the lifecycle processes put together. HP customers can contact PGS experts in this field and request related reports. (Contact Derek Coleman.) Another good source is Gilb's Requirements Driven Management20
Quality attributes are often referred to as the "ilities" of a project. Examples are usability, reliability, maintainability, etc. These "ilities" can be broken into two categories: real-time and development. Quality attributes can often be best described with use cases. (Contact PGC for further info.)
Develop high-level architecture
V Develop meta architecture - architectural vision, guiding principles, philosophies, style V Develop conceptual architecture - breakdown of system into components with
responsibilities and interconnects
Since evolutionary projects' designs have the tendency to change during the project, creating an
architecture that is "flexible" enough to anticipate changes is ideal. One way of making the architecture
8 The Casper project manager presented this argument.
9
Source: interviews with Gilb, PGC experts.20 Tom Gilb, Requirements Driven Management, (currently in publication, see http://result-planning.com)