HAL Id: hal-00788420
https://hal-mines-paristech.archives-ouvertes.fr/hal-00788420
Preprint submitted on 14 Feb 2013HAL is a multi-disciplinary open access archive for the deposit and dissemination of sci-entific research documents, whether they are pub-lished or not. The documents may come from teaching and research institutions in France or abroad, or from public or private research centers.
L’archive ouverte pluridisciplinaire HAL, est destinée au dépôt et à la diffusion de documents scientifiques de niveau recherche, publiés ou non, émanant des établissements d’enseignement et de recherche français ou étrangers, des laboratoires publics ou privés.
Elements on the computation of UV maps in the
Eurosun database
Lucien Wald
To cite this version:
1
Elements on the computation of UV maps in the Eurosun database
Lucien WALDMINES ParisTech, BP207, 06904 Sophia Antipolis, France
http://eurosun-project.org – 2012-04-24
Abstract
A simple method has been devised to produce daily doses of UV radiation from the solar total irradiation at ground level. The well-known HelioClim databases contain daily total irradiation for Europe since 1985. They are exploited to produce the EUROSUN database covering the period 1988-2007 for supporting analyses of effects on incidence of skin cancers through maps and exposure of individuals. Maps of 5-years average of monthly means of UV daily doses are made and compared to other maps of lower spatial resolution from the COST no726 project and from KNMI/ESA. The coincidences of features support the validity of the EUROSUN database in terms of spatial and temporal variability.
INTRODUCTION
The EUROSUN (Quantification of Sun Exposure in Europe and its Effects on Health) project, led by International Prevention Research Institute, was launched in 2007 by the European Commission (Sixth Framework Programme under Grant Agreement No. 2006320). It aimed at a better knowledge of UV exposure in the European Union and its effects on incidence of skin cancers, focusing on the period 1988-2007. This period has been selected in accordance with the different volumes of the IARC publication “Cancer Incidence in Five Continents” (21). Each volume covers a period of 5 years. Therefore, it was planned to have maps of monthly UV doses averaged over a 5-years period to support analyses in combination with the IARC publication. In addition, it was planned to calculate daily UV exposure in individuals by reconstructing past individual exposure
2
over the period 2005-2010 in random population samples.
The already available databases and maps were not suitable to support activities in EUROSUN because of the lack of geographical coverage (SUVDAMA, EDUCE) or geographical details (COST726, TEMIS), or unsuitable periods (MAUVE, UVAC, COST726). Therefore, EUROSUN had to develop its own database. The objective of this paper is to provide an insight on how the EUROSUN database, has been created. Many works have revealed the difficulties encountered when creating a database of UV radiation as well as the amount of efforts needed.
The innovative path taken by the EUROSUN project was to exploit the existing HelioClim databases of total irradiation (i.e. integrated over the whole solar spectrum), combined with a method that produces a spectral distribution of irradiation from total irradiation. In this way, the efforts and time needed were reduced. (22) exploits maps of 30-year averaged values of daily total irradiation over the United States of America and uses them as a surrogate for UV radiation. This is a similar approach to ours, with the exception that EUROSUN database comprises every day of the selected period and not an average. We describe hereafter the method for computing daily irradiation in UVA and UVB from daily total irradiation. We show an excerpt of the EUROSUN database in the form of map of UVB in Europe for June. We discuss the features present in the map in comparison with the results of the COST726 project and KNMI/ESA climatological maps, though the COST726 and KNMI/ESA maps display erythemal UV and have coarser spatial resolutions.
ON THE ALGORITHM
Ozone is the most important absorber affecting the UV radiation (UVR) reaching the Earth’s surface (1). It affects more the UVB (280-315 nm) than UVA (315-400 nm). However, there are two major modulators of UVR on hourly, daily and seasonal scales. Solar zenithal angle is one of them (1, 11, 23): a larger angle implies a longer path through the atmosphere than a smaller angle and a corresponding stronger attenuation. This effect explains partly the observed overall latitudinal gradient of UVR (1, 15-18, 24). Clouds are the other modulator (1, 11, 24-28): the larger the cloud cover, the lower the UVR. However, cloud cover, often expressed in octas, is not the best parameter to describe the variability in UVR. Hence, many researchers have studied the
3
relationship between UVR and the surface downwelling solar radiation integrated over the whole spectrum (280-4000 nm), called total or broadband radiation.
A strong correlation between the UVR irradiation IUVR and the total irradiation I is observed at
various scales: hour, day, season (25, 28-37). This was also noted for limited parts of the UV range, such as UVA IUVA, UVB IUVB, or erythemal UV IUVery. This suggests that IUVR can be
obtained from more numerous measurements or estimates of I. Several authors propose relationships between IUVR, or IUVA, or IUVB, or IUVery, and I based on regression analyses of
observations (29, 31-36). It was also observed that the ratio IUVR to I increases with decreasing
solar zenithal angle and increasing cloud cover (28, 30, 33, 35, 37).
All these works support our approach in assessing the UVR from the total irradiation. We combine these findings with the model proposed by (38-40) predicting the spectral distribution of the irradiation. In this model, the irradiation I() at wavelength less than 465 nm and for a 10-nm band centered on , is equal to:
I() = 1.163 10-4 (-300) f()I (10)
where f() is a spectral factor and is expressed in nm. The algorithm does not provide spectral factors below 310 nm, i.e. for the UVB range. We palliate his lack by assuming that the irradiation
IUVB can be computed from the spectral irradiation I(310) at 310 nm by using the ratio of these
same quantities but outside the atmosphere, which is approximately 1.8:
IUVB = 1.8 I(310) (11)
Two sets of spectral factors are proposed in tabular form in (40): one for clear-skies fc(), and the
other for overcast skies fb(). The spectral factor for any sky condition is obtained by linear
interpolation between the clear and overcast conditions, where the sky condition is characterized by the relative sunshine duration S/S0, where S is the sunshine duration during the day and S0 the astronomical daylength:
f() = [1–fc()]S/S0+[1–fb()](1-S/S0) (12)
Unfortunately, the sunshine duration is known in a limited number of sites. As the total irradiation at the top-of-atmosphere I0 is easy to compute, we propose a modification of the algorithm to substitute the sunshine duration by the clearness index KT, defined as the ratio I/I0. The Angström-Prescott relationship enables such a substitution:
4
where (b, c) are site-specific parameters. Though this relationship has been validated for monthly values, we assume that it holds for much shorter durations such as a day. Because of our lack of knowledge on the exact values of (b, c) for each location, we neglect their variation in space. For overcast sky: S/S0 = 0, i.e., KT = KTmin = b, and for clear-sky: S/S0 = 1, i.e.,
KT = KTmax = b+c. KTmin and KTmax for Europe are set to 0.1 and 0.7 (40), and parameters b
and c can be computed. Substituting numerical values for fc() and fb(), then integrating over , and constraining KT in the interval [0.1, 0.7]:
KT* = max(0.1, min(KT, 0.7)) (14)
it comes:
IUVB = [1.897 – 0.860 KT*] 10-3 I (15)
IUVA = [7.210 – 2.365 KT*] 10-2 I (16)
By applying Eqs 15 to 16 to the daily irradiation I, we obtain predicted values HCUVB and HCUVA
of daily irradiation in UVB and UVA.
Our model is an affine relationship between (IUVB / I) and KT. This is close to that proposed by
(32) which is linear, i.e., (IUVB / I) is proportional to KT. The model explains the reported increase
of the ratio IUVR to I with increasing cloudiness discussed above. When cloudiness increases, I and KT decrease; the difference (d - eKT) increases and the ratio IUVR/I increases. However, Eq. 15 will
not reproduce the change in IUVB in clear-sky due to a dramatic change in ozone content, because I,
and therefore KT, will be mostly insensitive to this change and will remain the same.
Though the model deals with daily irradiation, (48) performed comparisons between the results of this model applied to total irradiation derived every 15 min from Meteosat images and coincident ground measurements made in two sites in Europe: Lille in Northern France, and El Arenosillo in Southern Spain. The data span over two years: 2005-2006. It was found that i) the form of the model is correct, ii) there is no noticeable influence of the sun zenithal angle or year on the performances of the model, and iii) the performances depend only slightly of the choice for KTmin and KTmax. For both sites, IUVB is underestimated by 20% to 30%, and IUVA is overestimated by
the same relative amount. Given the conditions of comparison, we cannot assess precisely the magnitude of under- or overestimation for daily values; nevertheless, we believe that this magnitude is close to that reported above, and is fairly large. However, the large correlation, greater than 0.93, between measurements and predicted values indicate a linear relationship
5
between them. This means that the changes in space and time in UV are well reproduced by the predicted values though the changes are dampened in the case of UVB and amplified in UVA. This is enough for the purposes of EUROSUN as they rely on the relative variations in space and time of the UV radiation. This approach is similar to that of (49) whose model produced an overestimation of 10-15% in monthly doses of UV radiation for Norway; (49) concluded that despite this overestimation, the results of the model can be used because the focus was more on trends and variations instead of absolute values.
Daily doses predicted by Eqs 15 and 16 were also compared to measurements of UVA and UVB exposure of children recorded with personal dosimeters with assessment through a detailed questionnaire (50). A large correlation was found between predicted values and dosimeter readings when the latter are corrected for type of use, exposure in the shade, and environment. It was concluded that compared to dosimeters, EUROSUN data give a good estimate of individual UVA and UVB exposure, independently of exposure conditions and could be used to estimate actual exposure.
ON THE COMPARISON BETWEEN EUROSUN, COST726 AND
KNMI/ESA MAPS
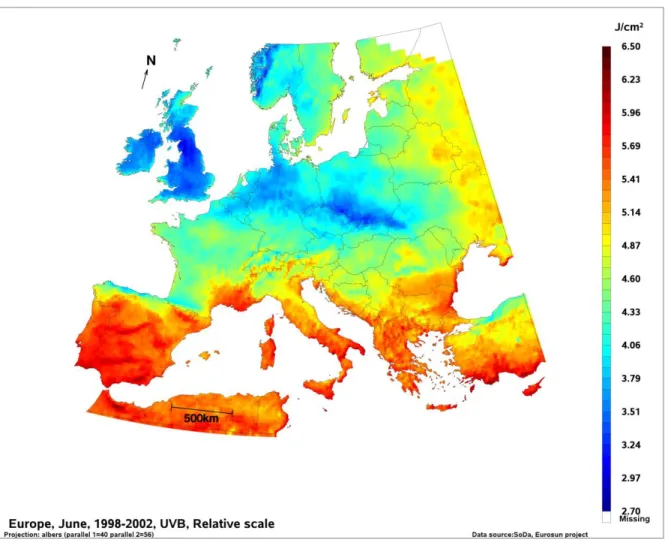
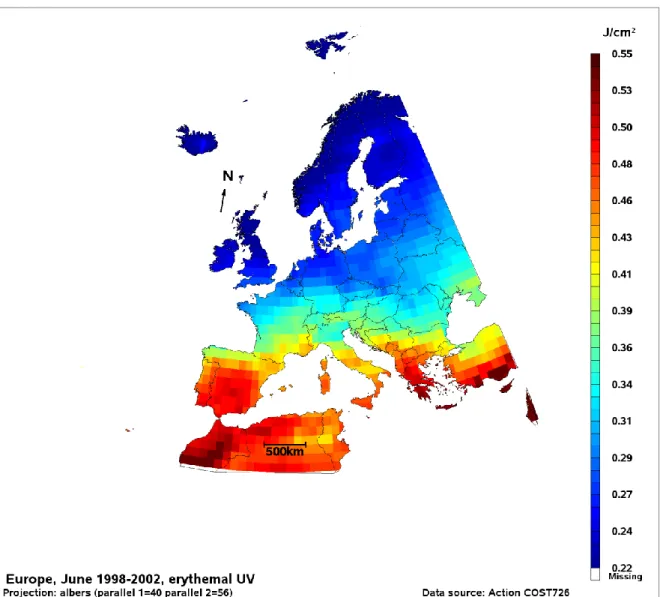
Figure 1 exhibits the map of the mean daily dose in UVB for the month of June during the 1998-2002 period as an example. One may observe a general latitudinal trend of the UV radiation: the largest values are found in Southern Europe, the lowest in Northern Europe. This trend is induced by the position of the Sun relative to the earth and is found at any wavelength, not only in UV. This is well-known and can be observed in the maps of erythemal UV radiation for June made by the COST726 project for the same period: 1998-2002 (Fig. 2), or on a climatology basis by KNMI/ESA (Fig. 3).
6
Figure 1. Map of the mean daily dose in UVB for the month of June during the 1998-2002 period.
7
Figure 2. Map of the mean daily dose in erythemal UV for the month of June during the 1998-2002 period from the COST726 database.
8
Figure 3. Map of the mean daily dose in erythemal UV for the month of June. Climatology from KNMI/ESA. Divide values by 10 to obtain J/cm2.
One observes in Fig. 1 local deviations to the latitudinal trend. This is the case of major orographic features such as the Cantabrians, the Pyrenees, the Alps, the Apennine, or the Carpathians, the Scottish Highlands, among others. These features should also be present in erythemal UV and can be observed in Figs. 2 and 3, though the coarser spatial resolutions may prevent to see all of them. The pixel size in COST726 is larger than that of KNMI/ESA, which is itself larger than that of EUROSUN. The larger the pixel size, the lower the spatial resolution, and the more dampened the spatial variability. Consequently, the EUROSUN map displays more variability in space than the KNMI/ESA map, and the COST726 map, and there are more orographic features seen in the KNMI/ESA map than in the COST726 one.
9
Areas of low (e.g., Provence, in the Southeast France) or large cloudiness (e.g., Upper Po Valley, in Northern Italy) are easily observed in the EUROSUN map. They are also seen in the two other maps. Over Norway, on may observe the general latitudinal trend with radiation increasing from North to South (Figs 2 and 3). More complex features can be seen in Southern Norway in Fig. 1 because of the greater spatial resolution. A W-E gradient is observed: UV increases from the coastline to the inland. This can be seen also in the COST726 map (Fig. 2) and much more faintly in KNMI/ESA map (Fig. 3). This gradient was observed in measurements made at ground level by (49) who explain this feature by variations in cloud properties. The prevailing westerlies transport moist air to the West coast of Norway, causing orographic lifting and production of dense clouds. In the east, a more continental climate is responsible for fewer and less dense clouds.
In Sweden, one may note a W-E gradient: UV increases towards the Baltic Sea. This gradient can be seen in the KNMI/ESA map but hardly in the COST726 map. To be sure that this feature exists though not visible in Fig. 2, we have drawn in Fig. 4 the erythemal UV daily dose read in the COST726 database for three cities in Sweden, having approximately the same latitude, and whose longitude increases to the East. The increase towards the East, i.e., the Baltic Sea, is clearly visible.
10
Figure 4. Mean daily dose in erythemal UV for the month of June during the 1998-2002 period from the COST726 database, for three cities in Sweden.
Looking at Baltic States and Russia, one observes in Fig. 1 that the radiation increases from W to E, again a deviation from the latitudinal gradient. This feature is also observed in the COST726 map, and to a lesser extent in the KNMI/ESA map because of the truncated coverage of this region.
A dark blue feature elongated along a WNW-ESE axis can be seen in Central Europe (Fig. 1). The UV radiation is less along the borders between Poland and Czech Republic or Slovakia. This can be seen in Figs 2 and 3. This N-S gradient over Slovakia was reported by (51) though for July.
One may observe an unexpected feature in Fig. 1: several sites in Sweden or Estonia exhibit values as large as, or close to, those observed in Germany. This is hardly seen in maps from KNMI/ESA or COST726 because of the spatial resolution. We have drawn a graph from the COST726 data, showing the monthly means of the daily irradiation in erythemal UV for the cities of Stockholm (Sweden), Tartu (Estonia), Lindenberg (Germany), and Postdam (Germany), for the 1998-2002 period. One can see that despite the low spatial resolution that
11
decreases the spatial variability in COST726 data, the June values are close one to each other for these four sites, and Tartu exhibits the greatest value in July. This supports the observation made on the EUROSUN map.
Figure 5. Monthly mean of daily dose in erythemal UV during the 1998-2002 period from the COST726 database, for Stockholm (59.33 N; 18.08 E), Tartu (58.3 N; 26.5 E), Postdam (52.36 N; 13.08 E), and Lindenberg (52.21 N; 14.12 E).
The comparison between the COST726, KNMI/ESA, and EUROSUN maps was made for all months and all periods. All features present in the EUROSUN maps were retrieved on the other maps, depending of course of the spatial resolution. These coincidences support the validity of the EUROSUN database in terms of spatial and temporal variability.
12
Because of its higher spatial resolution, the EUROSUN maps depict more details than the other databases: one may see the particular case of Paris region in France, Venetia in Italy, or Swedish coastline, among many other examples.
REFERENCES
1. Juzeniene, A., P. Brekke, A. Dahlback, S. Andersson-Engels, J. Reichrath, K. Moan, M.F. Holick, W.B. Grant and J. Moan (2010) Solar radiation and human health. Rep. Prog. Phys. 74, 066701, doi:10.1088/0034-4885/74/6/066701.
11. de La Casiniere, A., M. L. Toure, D. Masserot, T. Cabot and J. L. Pinedo Vega (2002) Daily doses of biologically active UV radiation retrieved from commonly available parameters.
Photochem. Photobiol. 76(2), 171-175.
15. Janjai, S., S. Buntung, R. Wattan and I. Masiri (2010) Mapping solar ultraviolet radiation from satellite data in tropical environment. Remote Sensing of Environment 114, 682-691, doi: 10.1016/j.rse.2009.11.008
16. Peeters, P., P.C. Simon, G. Hansen, R. Meerkoetter, J. Verdebout, G. Seckmeyer, P. Taalas and H. Slaper (2000) MAUVE: A European initiative for developing and improving satellite derived ultraviolet map. Radiat. Prot. Dosimetry 91(1-3), 201-202.
17. Verdebout J. (2004) A European satellite-derived UV climatology available for impact studies. Radiat. Prot. Dosimetry 111(4), 407-411, doi: 10.1093/rpd/nch063.
18. Verdebout, J. and J. Groebner (2003) A satellite-derived UV radiation climatology over Europe available for impact studies: daily maps from January 1984 to Octobre 2002. In Proceedings of the 2003 Eumetsat Meteorological Satellite Conference, 29 September – 3 October 2003, Weimar, Germany, EUM P39, Eumetsat, Darmstadt, Germany.
19. COST No 726 at www-med-physik.vu-wien.ac.at/uv/cost726/cost726.htm 20. Troposperic Emission Monitoring Internet Service at www.temis.nl
13
22. 22. Tatalovich, Z., J.P. Wilson, T. Mack, Y. Yan and M. Cockburn (2006) The objective assessment of lifetime cumulative ultraviolet exposure for determining melanoma risk. J.
Photochem. Photobiol. B, Biol. 85, 198–204, doi:10.1016/j.jphotobiol.2006.08.002.
23. Seckmeyer, G., D. Pissulla, M. Giandorf, D. Henriques, B. Johnsen, A. Webb, A-M Siani, A. Bais, B. Kjelstad, C. Brogniez, J. Lenoble, B. Gardiner, P. Kirsch, T. Koskela, J. Kaurola, B. Uhlmann, H. Slaper, P. den Outer, M. Janouch, P. Werle, J. Groebner, B. Mayer, A. de la Casiniere, S. Simic and F. Carvalho (2008) Variability of UV irradiance in Europe.
Photochem. Photobiol. 84, 172-179, doi: 10.1111/j.1751-1097.2007.00216.x.
24. Herman, J.R., N. Krotkov, E. Celarier, D. Larko and G. Labow (1999) Distribution of UV radiation at the Earth’s surface from TOMS-measured UV-backscattered radiances. J.
Geophys. Res. Atmospheres 104(D10), 12059-12076, doi: 10.1029/1999JD900062.
25. McKenzie, R.L., K.J. Paulin, G.E. Bodeker, J.B. Liley and A.P. Sturman (1998) Cloud cover measured by satellite and from the ground: relationship to UV radiation at the surface.
Int. J. Remote Sensing 19, 2969-2985.
26. Foyo-Moreno, I., I. Alados, F.J. Olmo and L. Alados-Arboledas (2003) The influence of cloudiness on UV global irradiance (295-385 nm). Agricultural and Forest Meteorology 120, 101-111, doi: 10.1016/j.agrformet.2003.08.023.
27. Alados-Arboledas, L., I. Alados, I. Foyo-Moreno, F.J. Olmo and A. Alcantara (2003) The influence of clouds on surface UV erythemal irradiance. Atmospheric Res. 66, 273-290, doi: 10.1016/S0169-8095(03)00027-9.
28. Foyo-Moreno, I., J. Vida and L. Alados-Arboledas (1998) Ground-based ultraviolet (290-385 nm) and broadband solar radiation measurements in South-eastern Spain. Int. J.
Climatology 18, 1389-1400.
29. Martinez-Lozano, J.A., F. Tena and M.P. Utrillas (1999) Ratio of UB to global broad band irradiation in Valencia, Spain. Int. J. Climatology 19, 903-911.
14
30. Anton, M., A. Serrano, M.L. Cancillo and J.A. Garcia (2008) Relationship between erythemal irradiance and total solar irradiance in South-Western Spain. J. Geophysical Res. 113, D14208, doi: 10.1029/2007JD009627.
31. Kudish, A.I., and E. Evseev (2000) Statistical relationships between solar UVB and UVA radiation and global radiation measurements at two sites in Israel. Int. J. Climatology 20, 759-770.
32. Basset, H.A., and M.H. Korany (2007) The global and UV-B radiation over Egypt.
Atmosfera 20, 341-358.
33. Jacovides, C.P., F.S. Tymvios, D.N. Asimakopoulos, N.A. Kaltsounides, G.A. Theoharatos and M. Tsitouri (2009) Solar global UVB (280-315 nm) and UVA (315-380 nm) radiant fluxes and their relationships with broadband global radiant flux at an eastern Mediterranean site.
Agricultural and Forest Meteorology 149, 1188-1200.
34. Escobedo, J., E.N. Gomes, A.P. Oliveira and J. Soares (2011) Ratios of UV, PAR and NIR components to global solar radiation measured at Botucatu site in Brazil. Renewable Energy 36, 169-178, doi: 10.1016/j.renene.2010.06.018.
35. Bilbao Santos, J., D. Mateos Villan and A. de Miguel Castrillo (2011) Analysis and cloudiness influence on UV total irradiation. Int. J. Climatology 31, 451-560.
36. Canada, J., G. Pedros and J.V. Bosca (2003) Relationships between UV (0.290-0.385 m) and broad band solar radiation hourly values in Valencia and Cordoba, Spain. Energy 28, 199-217, doi: 10.1016/S0360-5442(02)00111-1.
37. Canada, J., G. Pedros, A. Lopez and J.V. Bosca (2003) Influences of the clearness index for the whole spectrum and of the relative optical air mass on UV solar irradiance for two locations in the Mediterranean area, Valencia and Cordoba. J. Geophys. Res. 105, D4, 4759-4766, doi: 10.1029/1999JD901106.
15
38. Crommelynck, D., and A. Joukoff (1990) A simple algorithm for the estimation of the spectral radiation distribution on a horizontal surface, based on global radiation measurements.
Solar Energy 45, 131-137, doi:10.1016/0038-092X(90)90047-G.
39. Joukoff, A., and D. Crommelynck (1993) Estimation of the spectral radiation distribution using a simple algorithm. In Proceedings of the Int. Radiation Symposium, Tallin, Estonia, 3-8 August 1922, pp. 241-244. Keevallik S. and Karner O. (Eds), Deepak Publishing.
40. European Solar Radiation Atlas. Fourth edition, includ. CD-ROM (2000) Edited by K.
Scharmer, J. Greif. Scientific advisors: R. Dogniaux, J. K. Page. Authors: L. Wald, M. Albuisson, G. Czeplak, B. Bourges, R. Aguiar, H. Lund, A. Joukoff, U. Terzenbach, H. G. Beyer, E. P. Borisenko. Published for the Commission of the European Communities by Presses de l'Ecole, Ecole des Mines de Paris, Paris, France.
48. Wald, L., A. Arola, C. Brogniez and J.M. Villaplana (2010) A preliminary assessment of the quality of UV data derived from the database HelioClim-3. 10th EMS Annual Meeting (European Meteorological Society), Bern, Swizerland, 13-17 September 2010.
49. Medhaug, I., J.A. Olseth and J. Reuder (2009) UV radiation and skin cancer in Norway. J.
Photochem. Photobiol. B, Biol. 96, 232–241. doi:10.1016/j.jphotobiol.2009.06.011
50. Boniol, M., M.S. Cattaruzza, L. Wald, M.-C. Chignol, M.A. Richard, M.T. Leccia, F. Truchetet, C. Renoirte, P. Vereecken, P. Autier and J.-F. Dore (2006) Individual sun exposure can be assessed using meteorological satellite measurements. In Epidemiology - International Conference Epidemiology and Exposure, 2-6 September 2006, Paris, France.
51. Pribullová, A., and M. Chmelík (2008) Typical distribution of the solar erythemal UV radiation over Slovakia. Atmos. Chem. Phys. 8, 5393-5401. doi:10.5194/acp-8-5393-2008.