HAL Id: hal-01672515
https://hal.archives-ouvertes.fr/hal-01672515
Submitted on 3 Jan 2018
HAL is a multi-disciplinary open access
archive for the deposit and dissemination of sci-entific research documents, whether they are pub-lished or not. The documents may come from teaching and research institutions in France or abroad, or from public or private research centers.
L’archive ouverte pluridisciplinaire HAL, est destinée au dépôt et à la diffusion de documents scientifiques de niveau recherche, publiés ou non, émanant des établissements d’enseignement et de recherche français ou étrangers, des laboratoires publics ou privés.
non-Brownian fiber suspensions
S. Bounoua, E Lemaire, P. Kuzhir
To cite this version:
S. Bounoua, E Lemaire, P. Kuzhir. The role of attractive interactions on shear thinning in non-Brownian fiber suspensions. Annual European Rheology Conference (AERC) 2017, Apr 2017, Copen-hagen, Denmark. �hal-01672515�
The role of attractive interactions on shear thinning in non-Brownian fiber suspensions S. Bounoua, E. Lemaire, and P.Kuzhir
University of Côte d’Azur, CNRS UMR7010, Institute of Physics of Nice, Parc Valrose, Nice 06100 France Synopsis
This work is focused on shear thinning behavior of suspensions of rigid non-Brownian fibers dispersed in a Newtonian liquid. The work consists in developing a new theoretical model and conducting accurate experimental measurements. The shear thinning is expected to be caused by adhesive interactions between fibers. Experiments on polyamide (PA) fibers (present work) and carbon nanotube (CNT) suspensions [Khalkhal et al., J. Rheol. 55, 153-175 (2011)] have revealed the following features: (a) the flow curves exhibit a pronounced pseudo-plastic behavior interpreted in terms of the progressive aggregate destruction at the increasing shear rate; (b) the enhancement of the shear thinning with an increasing particle volume fraction is observed and explained by an increase of the strength of effective interactions between particles, as their concentration increases; (c) a weak yield stress of the PA fiber suspensions is detected in a controlled-stress mode and explained by the liquid-solid transition as the concentration of aggregates (constituted by fibers) approaches the close packing limit; (d) the shear thinning is much stronger in CNT suspensions because the adhesive interactions play a more important role between nano-sized CNT particles than between micron-sized PA fibers. A theoretical model considering the coexistence of transient aggregates with free non-aggregated fibers has been developed. The model allows viscosity calculations in terms of the aggregation parameter – the ratio of adhesive to hydrodynamic forces. It captures qualitatively the above-mentioned shear thinning behaviors and fits reasonably well to the experimental data on both PA fiber and CNT suspensions.
I. Introduction
Fiber-reinforced composites are broadly used in civil engineering, automobile and aerospace industries. Fabrication of these materials is often related to extrusion or mixing of fibers dispersed in a liquid matrix [1]. The composites are usually charged with a large amount of particles. Therefore, their successful fabrication and processing require a deep understanding of rheology of concentrated fiber suspensions.
Since the pioneering work of Jeffery [2], the rheology of dilute and semi-dilute fiber suspensions has been well understood and documented, see reviews by Larson [3], Petrie [4]. In concentrated suspensions, short-range interparticle interactions play an important, if not decisive, role. The effect of short-range hydrodynamic forces and of direct mechanical contacts has been understood through theoretical modeling [5,6] and direct numerical simulations [7–9]. In suspensions of fibers dispersed in a Newtonian solvent and interacting with each other through lubrication forces, direct collisions and Coulombic friction, all these interactions produce a single scaling for the stress, 0 , with 0 being the solvent
viscosity and – a characteristic value of the rate-of-strain tensor (shear rate in the case of a simple shear flow). These suspensions exhibit a viscous behavior with the shear viscosity linear in particle volume fraction at low concentrations and nearly quadratic with at higher volume fractions [7,8]. The last trend is explained in terms of pair-wise interactions between fibers. Non-hydrodynamic interactions, such as adhesive or electrostatic repulsive forces between fibers, as well as elastic bending of flexible fibers produce non-linear scaling of the shear stress with the shear rate.
From a general perspective, the role of the non-hydrodynamic interactions becomes less important with increasing shear rate. In most cases, this results in a shear thinning behavior. The degree of shear thinning strongly depends on the types of interactions between particles, as well as on fiber flexibility, as discussed below:
1. In purely repulsive systems, the electric double layer may substantially increase the effective particle size and lead to gelation transition and consequently to a yield stress at particle volume fractions well below conventional dense packing fraction [10]. Electrostatic repulsion has recently been found to be at the origin of a yield stress in nanofiber suspensions [11].
2. Excluded volume interactions between rigid or semi-flexible fibers could also lead to gelation of the nanofiber suspension [12].
3. In attractive systems with colloidal nanoparticles, the interplay between the electrostatic repulsion and the van der Waals attraction governs the degree of particle flocculation and yielding behavior [13-15]. At the same time, adhesive interactions produce a moderate shear thinning in suspensions of rigid micron-sized rod-like particles, such as polyamide [16, 17], ceramic particles [18], wollastonite [19].
4. Elastic bending of flexible micron-sized or nano-sized fibers is another mechanism inducing both shear thinning or yield behaviors observed in pulp suspensions [20, 21], carbon nanotube (CNT) composites [22, 23], solutions of agar fibers [24]. The yield stress in flexible fiber suspensions comes from the formation of an entangled network whose strength depends mostly on inter-particle solid friction and, to a lesser extent, on the colloidal forces between them, as revealed by particle level simulations of Klingenberg and co-workers [25, 26]. Theoretical models by Toll and Månson [27] and Servais et al. [28] allow a correct prediction of the yield stress in short fiber polymer composites during their forming, while the model of Keshtkar et al. [29] captures the transient viscosity of semi-flexible fiber suspensions.
Surprisingly, theoretical modeling of the rheology of rigid fiber suspensions with colloidal interactions is less documented. One of the first rigorous models considering aggregation of rigid fibers has been developed by Ma et al. [30], in the case of Brownian fibers. This model introduces a continuous series of fiber populations with different degrees of aggregation. The model captures well the shear thinning behavior and shows a good agreement with experiments on CNT suspensions. However, the role of the colloidal
interactions cannot be well understood. First, the shear-induced destruction of aggregates is taken into account only implicitly by the introduction of phenomenological shear rate dependencies of the aggregation and disaggregation rates. Second, the model introduces distinct rotary diffusivities for each population, and these diffusivities are taken to be independent of shear rate. The shear thinning is thus a synergy of the two following effects: (a) the fiber alignment at increasing Péclet numbers; and (b) disaggregation generated by a progressive decrease of the aggregation rate with increasing shear rate. More recently, a multi-scale model of aggregated fiber suspensions has been proposed by the same research group [31-33]. This approach considers both the dynamics of the rod-like particles inside the cluster and the dynamics of the whole cluster. The model allows a precise determination of the cluster rotation and deformation in shear flows. At this moment, colloidal interactions between fibers constituting the aggregates are not explicitly introduced, and the rheology of the clustered suspension is not analyzed in details.
Another model allowing capturing the shear thinning in fiber suspensions has been recently developed by Natale et al. [34] and Férec et al. [35]. This model discards aggregation of particles and considers short-ranged forces between contacting fibers. The authors capture shear thinning behavior introducing a non-linear lubrication force (proportional to n, 0<n<1) between fibers that mimics a combined effect of the short-range hydrodynamic and non-hydrodynamic interactions. This force is weighed by the contact probability and affects both the orientation state (producing more isotropic orientation distribution) and the stress tensor. Such a phenomenological approach provides a good agreement with experiments on CNT suspensions. However, the role of the colloidal interactions remains unclear. In our recent work, we have extended this model to van der Waals interactions and solid friction between fibers [36]. Affine motion of the fibers in shear flow has been supposed. Despite the fact that aggregation was neglected, this model predicts a yielding behavior of the suspension with an apparent yield stress being totally defined by the strength of the van der Waals interaction. The model gives a satisfactory agreement with experiments on CNT suspensions at high shear rates, at which both the shear stress and the first normal stress difference are quasi linear with the shear rate and the extrapolation of the flow curves on zero shear rate gives the apparent yield stress. The model does not capture initial rounded shape of the flow curves. This disagreement comes probably from the aggregation of the suspension at low shear rates discarded in the model.
In some rigid fiber suspensions, such as CNTs subjected to moderate shear stresses, the particles experience attractive colloidal interactions often leading to aggregation [30, 37]. It is therefore important to develop an adequate theoretical model for rigid fiber suspensions with aggregation induced by these interactions. To the best of our knowledge, such aggregation model explicitly accounting for attractive colloidal forces has never been reported in literature for rigid fiber suspensions, even though various cluster models exist for suspensions of spherical particles [3, 38]. Furthermore, the experimental rheological results often depend on the mode of the suspension preparation and on the shear history [39]. Because of relatively large periods of fiber rotation, the steady state of the shear flow is
expected to be achieved at a long time usually exceeding the typical duration of standard rheometric measurements. These two factors complicate the comparison between the theory and experiments on steady-state flows. Only accurate experiments ensuring the steady state and independence of shear history could be safely compared to the model.
This allows us to formulate the main objectives of the present work: (a) develop a theoretical model of aggregated fiber suspensions, in which the aggregate behavior and the suspension viscosity would be explicitly expressed through short-ranged adhesive forces between fibers; (b) conduct new rigorous experiments on the steady-state shear flow of non-Brownian fiber suspensions with adhesive interactions and compare these experiments to the theoretical model. The theory proposed in the present work is inspired by the multi-population aggregation model of Vaccaro and Marrucci [40], Ma et al. [30], the contact probability approach of Djalili-Moghaddam and Toll [5], Férec et al. [6] and a scenario of aggregate rupture under shearing forces developed by Snabre and Mills [41] for aggregated suspensions of spheres. The rheological experiments are made with neutrally buoying polyamide (PA) fibers dispersed in a Newtonian solvent in the range of the shear rates and shear stress when the fibers can be considered as almost perfectly rigid. We test our model on two different experimental systems exhibiting aggregation behavior – PA fibers (the present experiments) and CNT suspensions (experiments of Natale et al. [34]).
This paper is organized as follows. The theoretical model is presented in Sec. II. The experimental details are explained in Sec. III. Experimental results are reported and compared to the theoretical model in Sec. IV. Conclusions and perspectives are outlined in Sec. V. II. Theory
II-A. Basic assumptions and qualitative behavior
Let us consider a steady state simple shear flow of a suspension of fibers dispersed in a Newtonian solvent of a viscosity 0. The Cartesian coordinate frame is chosen in such a way
that the axes x1, x2 and x3 correspond to the flow, velocity gradient and vorticity directions,
respectively, as depicted in Fig.1a. The flow is considered to be homogeneous on a macroscopic scale, and the volume average velocity is defined by the vector v(x2, 0, 0), where is the shear rate.
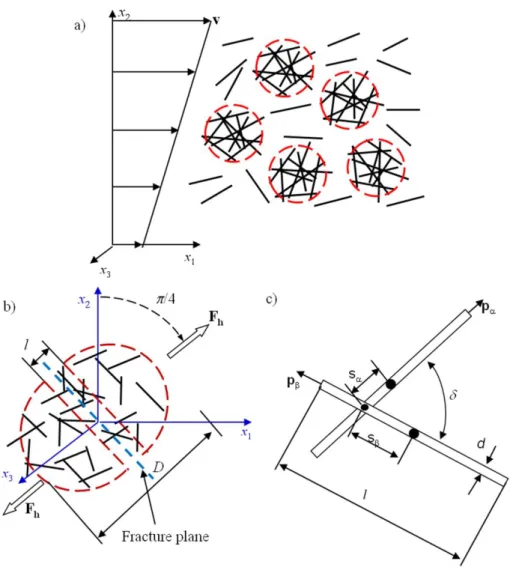
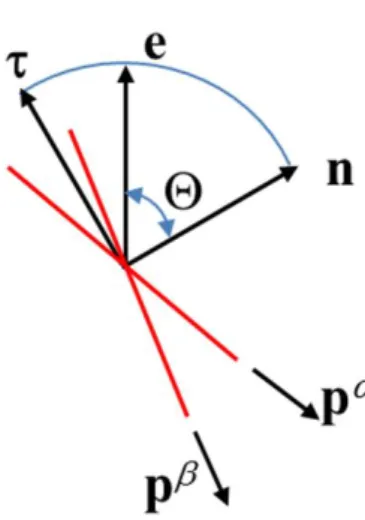
Fig. 1. Problem geometry. The two-population approach is schematically presented in figure (a). According to this approach, the spherical aggregates are dispersed in a suspension (population) of free fibers dispersed in a liquid carrier [cf. assumption (3) of Sec. II-A]. Aggregate rupture in the middle plane is presented in figure (b).
Two contacting fibers inside an aggregate are shown in figure (c).
To get the physical insight into the role of adhesive interactions on aggregation and rheology of fiber suspensions, first we present a qualitative picture of the suspension behavior introducing the following simplifications and assumptions:
1. The fibers are considered to be perfectly rigid, non-Brownian and mono-disperse, i.e. all having the same length l, diameter d and aspect ratio r=l/d. The high aspect ratio limit
1
r is considered. As it will be stated below, this limit affects the fiber orientation distribution, their contact probability and the suspension viscosity. The gravitational settling of fibers is neglected. The validity of these conditions is checked in Sec. C of Supplemental Materials [42] for the PA fibers.
2. The flow is considered to be laminar both on the scale of the whole suspension and on the scale of the aggregates or isolated fibers. This condition is satisfied by low values of the
Reynolds number, Re1, at all the scales of the problem, as shown by estimations in Sec. C of Supplemental Materials [42].
3. The model is developed for attractive colloidal interactions which can stick the fibers together and induce spatial heterogeneities as well as their cooperative motion under shear. The cooperative motion of particles can be quantified by a spatial correlation function of particle velocities associated to a certain correlation length [43]. This allows us to define the aggregates as the regions with presumably higher particle concentrations showing a coherent motion of fibers and delimited by a correlation length D. The following assumptions are related to the structure of the aggregated suspension:
3.1. As often observed in flocculated fiber suspensions, the aggregates are periodically formed by relative translational and rotational motion of fibers and periodically destroyed by shearing forces – see review by Kerekes [44].
3.2. The whole suspension is considered to be a two population system – transient aggregates immerged in a suspension of free fibers filling the space between them, as depicted in Fig.1a. The fraction of fibers involved into aggregates is denoted by 1, while the fraction
of free fibers is 2. The particle conservation implies:
1 2 1
. (1)
3.3. In the dynamic equilibrium at steady state, the rates of aggregate construction and destruction are the same; the fractions 1 and 2 remain constant with time and are defined
by a kinetic equation formulated in Sec. II-D.
3.4. For the sake of clarity, we will consider aggregates of spherical shape, while extension of the model to elongated shape (prolate ellipsoids of revolution) is developed in Sec. A of Supplemental Materials [42].
3.5. The contribution of aggregates to the suspension viscosity is estimated ignoring filtration flows and relative motion of fibers within the aggregates (rigid aggregate assumption), as if we dealt with a hard sphere suspension of an effective particle volume fraction equal to a 1 / i, with - volume fraction of fibers in the whole suspension, i
– internal volume fraction of aggregates. Note however, that such viscosity estimation can be subject to some uncertainty because both internal flows and relative motion of fibers may appear during fragmentation of aggregates unless this process is very fast compared to their living time.
3.6. The suspension viscosity is calculated using the Krieger-Daugherty relationship [3], in which the shear viscosity, f , of anisotropic free fiber population is used as the viscosity of the suspending medium for aggregates. Perturbation of the orientation state of the free fibers surrounding the aggregates, and its consequence on f value are neglected. Studies on the liquid crystalline polymers charged with hard sphere particles show that this approach gives at least a semi-quantitative agreement with experiments for the composite viscosity [45].
3.7. The aggregate behavior (and, as a consequence, the suspension rheology) is governed by the dimensionless ratio of the characteristic adhesive force FA to the characteristic
2 A A F N d , (2)
called hereinafter the aggregation parameter.
4. Two length scales of inter-fiber interactions are considered. The hydrodynamic interactions correspond to a length scale of about a fiber diameter d and to the separation between fibers, hRhH d, where hR is the surface roughness scale. The adhesive
interactions usually have a shorter length scale hA. Both aggregated and free fibers should
experience these two types of interactions. However, adhesive interactions are supposed to be negligible for free fibers. This statement is confirmed by a posteriori estimation of adhesive and lubrication forces for free fibers [see Section IV-C, Appendix D]. On the other hand, according to Assumption 3.5, the aggregates contribute to the suspension viscosity through their effective volume fraction a, which is defined by the cohesive strength Fc of the
aggregates [Sec. II-C, Appendix A]. For rigid aggregates, Fc is uniquely determined by
adhesive forces between aggregated fibers before they begin to slide over each other during aggregate break-up. Thus, the hydrodynamic force between aggregated fibers does not intervene into calculations of the cohesive strength and suspension viscosity.
5. Two different scenarios of the break-up of inter-fiber contacts during aggregate fragmentation are considered: (a) rupture in the direction normal to the contact surface; (b) sliding of fibers along each other. In the case (a), friction does not intervene, and the cohesive strength of the aggregate is fully defined by the normal colloidal force Fn. In the case (b), the
cohesion strength is defined by tangential friction force F, while the normal colloidal force
Fn intervenes into the cohesive strength through a friction law. The cases (a) and (b) will be hereinafter referred to as, respectively, the normal and the tangential rupture scenarios.
6. The classical Amontons-Coulomb friction law is supposed for the tangential rupture: n
F F . (3)
Here is the friction coefficient, whose typical values vary in a relatively narrow range for polymer fibers in different solvents, namely =0.3-0.5, as measured experimentally [46, 47]. Note that little is known about friction mechanics at nanoscale, especially in the boundary lubrication regime. However, the simplest Amontons-Coulomb law still allows correct predictions of the friction between single crystal nanoparticles [48], as well as of flows of concentrated colloidal nanoparticles [49] or hard-sphere suspensions [50].
7. The three following assumptions are related to the internal aggregate structure:
7.1. The orientation state of the fibers inside the aggregates is considered to be isotropic. However, to check whether the orientation distribution strongly affects the aggregate cohesive strength, we extend our model to nearly aligned state and obtain only a slight difference with respect to the isotropic orientation distribution [Appendix A]. Thus, the model can be applied for our experiments with PA fibers showing an intermediate orientation state.
7.2. The internal aggregate structure corresponds to the colloidal glass state, characterized by spatially homogeneous distribution of fibers with a fractal dimension equal to 3. This state occurs within the range of the internal particle volume fractions inside the aggregates, 0.7 /ri 5.4 /r, valid for the high aspect ratio limit [51, 52]. The lower bound of this interval corresponds to the percolation threshold. Analysis at the end of Sec. II-C shows that concentration of fibers inside the aggregates in our PA suspensions is above the percolation threshold.
7.3. All the aggregates have the same internal volume fraction i, corresponding to the limit of their mechanical stability [see Sec. II-C].
8. The characteristic aggregate size, D, is supposed to be much smaller than the width of the flow channel b, and possible wall interactions are neglected. Particle/aggregate migration induced by shear rate gradients or normal stress gradients in rheometric flows are also neglected for both populations of free and aggregated fibers. These both assumptions are a
posteriori verified, at least, for the PA suspensions [Sec. III-B].
The approach introduced in the assumption (3.5) allows us to calculate separately the viscosity of the free fiber population suspension [Sec. II-B] and then the viscosity of the whole suspension [Sec. II-C]. To close the problem, the unknown fractions 1 and 2 of
fibers belonging to both populations will be determined by a kinetic equation in Sec. II-D. II-B. Viscosity of the free fiber population suspension
The rheology of this population is governed by the fluid and hydrodynamic fiber-fiber interactions, while adhesive interactions are negligible [Assumption (4) justified in Sec. IV-C]. In what follows, on the basis of our previous work [36], we will briefly describe how the viscosity of the free fiber population can be found accounting for hydrodynamic interactions between fibers.
Only the short-range hydrodynamic fiber-fiber interactions are considered. They correspond to lubrication forces that are assumed to be proportional to the contact surface [53] and to be linear in velocity [5]. For two perfectly smooth cylindrical surfaces (i.e. when the separation hH between surfaces of free fibers is well above the roughness scale hR, as
confirmed for our PA suspensions, cf. Table IV), the expression for the lubrication force reads [54]: 2 0 lub 3 H d h
u F p p (4)where u is the relative velocity of the approach of two fibers, whose orientation is described by unit vectors p and p. The gap hH between free fibers is taken as a free parameter in the
The lubrication forces are weighed over the contact probability introduced by Férec et al. [6] and estimated in the high aspect ratio limit, r1, using the tube model of Doi and Edwards [55] and taking into account the length-scale hH of hydrodynamic interactions:
2
2 ( )
H H
dP n dh pp ds ds dp (5)
where n2 is the particle number fraction in the free fiber population, is the angular
distribution function of the neighboring fibers ; s and s are the distances between the contact point and the centers of the fibers and [Fig. 1c].
The hydrodynamic interactions between fibers induce their stochastic angular motion [56] that can be mimicked by an isotropic rotary diffusion process with a phenomenological rotary diffusivity
2 r
D C
, (6)accounting for pair-wise interactions between fibers with frequency proportional to the particle volume fraction (2 in the case of the free fiber population) and to the shear rate. The dimensionless constant C accounts for geometrical details of the interaction.
The orientation state of the fibers can be found in low diffusion, D rr 3/ 1, and high aspect ratio, r1 limits, following the work of Leal and Hinch [57]. In this limit, the moment 2 2
1 2
p p of the orientation distribution function does not depend on D and is equal r
to p p12 22 0.315 /re, with re1.24 / lnr 1/ 2r being the equivalent aspect ratio of fibers Brenner [58]. The shear viscosity f of the free fiber population depends only on the moment
2 2 1 2
p p . Thus, f appears to be independent of the rotary diffusivity, and the unknown constant C does not intervene into the final expression for f .
The stress tensor is obtained by the averaging of the local stress over the contact probability [Eq. (5)] and over the fiber orientation, using the slender body theory for fiber-fluid interaction [59]. The component of lubrication force parallel to the fiber axis gives a contribution proportional to the square of the particle concentration. Since non-hydrodynamic interactions between free fibers are neglected, the free fiber population behaves as a Newtonian suspension of an effective particle volume fraction 2 with a relative shear viscosity given by the following formulaa [36]:
a Equation (7) is obtained from Eq. (2.26) of the original paper [36] by replacing the constant k by 3(d+h
H)/hH and neglecting the last adhesion term in the right-hand side of this equation.
1/ 2 II 2 1/ 2 2 2 2 0 2 ln ( ) 8 1 2( ) ( ) ( ) 1 ln ( ) 3 ln(2 ) f r f H r r f d c c r r r h (7) where II (1 0.64 ) /(1 1.5 )
f is the form factor; 1/ ln(2 )r and c≈0.254. The last two terms of Eq. (7) stand respectively for hydrodynamic interactions between the fibers and the solvent and for short-range lubrication forces between contacting fibers.
Notice that the relative viscosity of the whole disaggregated suspension at high shear plateau is defined by Eq. (7) where the fraction of free fibers 2 is set to unity: 2=1.
II-C. Mechanical equilibrium of the aggregates and suspension viscosity
According to the assumption (3) [Sec. II-A], the rigid impermeable clusters are dispersed in a Newtonian fluid formed by the population of free fibers suspended in the liquid solvent. The volume fraction of the aggregates is a 1/i, and the relative viscosity of the suspension of the aggregates dispersed in the continuous medium of viscosity f is estimated by the Krieger-Daugherty relationship [3]:
, , 1 , , 1 1 ma ma r a a a f ma mai
(8)where [] is the intrinsic viscosity of a dilute suspension of aggregates, m a, is their maximum packing fraction. The value
5 / 2 allows recovering a dilute hard sphere suspension limit for aggregates at high shear rates, while the maximum packing fraction is forced to unity, m a, 1, that is appropriate for a continuous fiber network occupying all the suspension volume, which is expected in the quiescent suspension.The relative viscosity ar depends on the two unknown parameters 1 and i. The fraction 1 of aggregated fibers will be estimated in Sec. II-D. The internal volume fraction
i
of aggregates is determined in this section.
According to the assumption (7.3) [Sec. II-A], all the aggregates are supposed to have the same internal volume fraction corresponding to the limit of their mechanical stability under shearing forces. The adhesive forces between fibers are capable to preserve the aggregates from destruction until they are dominant over the shearing forces.
The aggregate break-up can follow two different scenarios: (a) erosion of individual fibers from the aggregate surface, or (b) aggregate rupture and splitting into parts, both mechanisms being observed in flexible cellulose suspensions [60]. The dominant break-up mechanism has to be found for our particular case of rigid fiber suspensions. To this purpose, it is convenient to compare the shear stresses corresponding to aggregate destruction by both
mechanisms. Estimation shows that the rupture stress, 2 2
32 /(5 )
r i rFA d
appears to be lower than the erosion stress, 2
32 /(5 )
e irFA d
(cf. Sec. B of Supplemental Materials) [42], or, in other words, the fracture occurs at lower stresses and therefore is expected to be a dominant mechanism of the aggregate destruction.
We suppose therefore that the aggregates are broken in equal parts by shearing forces. The hydrodynamic force acting on a half of a broken aggregate is maximal along the extension axis. Therefore, the fracture is assumed to happen at the aggregate middle plane perpendicular to the extension axis of the shear flow, making an angle /4 with the flow direction [Fig. 1b] Note that appearance of the voids inside the flocs under shearing forces has been reported by Björkmann [61] and Karppinen et al. [62] for micro-fibrillated cellulose suspensions. These voids were extended along the largest compression axis (therefore perpendicular to the extension axis) and led to partial breakup of the fiber network.
The aggregate fracture corresponds to a break-up of the adhesive contacts within the fracture region. It is expected to occur when the hydrodynamic force, Fh, acting on a half of
the aggregate surface overcomes the aggregate cohesive strength, Fc, defined by the sum of all
adhesive forces in the fracture region. Both Fh and Fc represent the projection of the forces
onto the extension axis along which the aggregate is torn.
Since the concentration a of aggregates in the suspension is high enough, the hydrodynamic force acting on aggregates will be affected by multi-body hydrodynamic interactions with neighboring aggregates. These interactions can be accounted for by an effective medium approach considering that the aggregates are immersed into a fluid whose viscosity is equal to the viscosity of the whole suspension rather than the viscosity f of the
suspending medium. Such an approach has been successfully used by Snabre and Mills [41] for aggregated suspensions of spherical particles. At this condition, the hydrodynamic force acting on a half of the aggregate along the extension axis is given by the following expression [63]: 2 2 5 5 8 8 h F D D (9)
where D is the aggregate diameter and is the applied shear stress.
Similarly to lubrication forces between free fibers, the normal adhesive force Fn
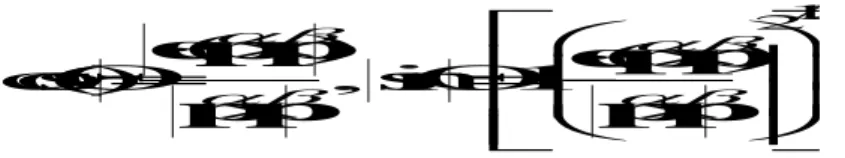
between aggregated fibers is expected to be proportional to the inter-fiber contact area, thus inversely proportional to the sine of the angle between fibers (sin pp , cf. Fig.1c) [11]: n F F p p (10)
where F is the value of the normal adhesive force corresponding to the angle =/2 between two fibers. In the particular case of van der Waals interaction, equation (10) holds at
1
/2
r
and, at small separations hAd between the fiber surfaces, the expression for F reads [64]: 2 12 A A d F h (11)where A is the Hamaker constant.
The cohesive strength, Fc, of the aggregates is estimated in Appendix A for both
normal and tangential rupture scenarios [assumption (4)] and for both isotropic and nearly aligned fiber orientation within the aggregates [assumption (7.1)]. These four cases are combined into a single expression for Fc:
2 2 2 4i A c FDr F d
(12)where r and d are the fiber aspect ratio and diameter, respectively, FAF is an effective colloidal force, where the multiplier is of the order of unity and varies in a narrow range
min(1/ 2,/ 4) max(1, ) depending on the contact rupture scenario and the orientation state. The reasons for a weak variation of the cohesive strength with the rupture scenario and with the orientation distribution are explained in details in Appendix A. On the other hand, the characteristic value of the normal adhesive force, F, can be estimated using Eq. (11) if the separation hA between aggregated fibers is known. In the present model, the value FAF is taken as an adjustable parameter, which will allow us to estimate the separation hA [Sec. IV-C,
Appendix D].
At mechanical equilibrium, the sum of the hydrodynamic [Eq. (9)] and cohesive [Eq.(12)] forces is zero, and we arrive at the following expression for the desired quantity – the internal volume fraction of aggregates:
2 2 2 2 32 32 1 5 5 A A i F r N r d , (13)
where we have made use of Eq. (2) for the aggregation parameter NA.
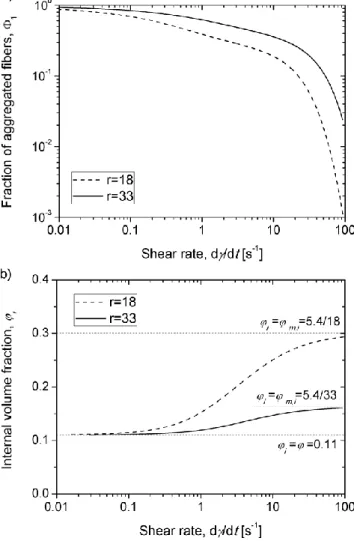
The equation (13) gives a progressive increase of the internal volume fraction with an increase of the shear stress. This comes from the fact that the total number of contacts inside the fracture region (proportional to i2) should increase in order that the aggregate might support a higher applied stress. In such a way, the cohesive strength of the aggregate increases with the increasing stress; this ensures the balance of hydrodynamic and cohesive forces acting on the aggregate. At high shear stresses, the aggregation parameter vanishes, NA1,
and the volume fraction becomes much larger than unity: i 1. This indicates that the present model is only valid for moderate-to-high aggregation state, NA 1 ensuring physically correct values of the internal volume fraction i 1. To extend our model to high shear states, we add a term 1/m i,2 to the right-hand side of Eq. (13), allowing an upper limitation of the i value by some maximum admissible internal volume fraction m i, :
2 2 2 , 32 1 1 5 A i m i N r (14)
For definiteness, we put m i, equal to the upper limit concentration of the colloidal glass state: m i, 5.4 /r. Notice that the aggregate diameter D disappears from Eq. (14) for
i
. This has been expected thanks to non-fractal nature of the aggregate structure [assumption (7.2)].
Finally, substituting Eq. (14) for i into Eq. (8), we get the following expression for the relative viscosity of the suspension of spherical aggregates dispersed in a free fiber suspension: , 5/ 2 1/ 2 1/ 2 1 1 2 2 2 2 2 , , , 32 1 32 1 1 1 5 5 m a r A A a m a m i m i N r F r d (15)
The equation (15) allows one to find the relative viscosity of the aggregate population as function of the aggregation parameter NA (or, alternatively, the applied stress ) and of the
particle volume fraction . The viscosity of the whole suspension is found as the product of the relative viscosity ar of the aggregate suspension and the viscosity fof its suspending medium – the free fiber population:
0 r r r f a f a
(16)where 0 is the Newtonian solvent viscosity, fr is given by Eq. (7) and ar - by Eq. (15). It is important to notice that the viscosities fr and ar of both fiber populations are affected by the average number Z of contacts per fiber. This effect is considered in details in Appendix B.
To close the problem, we need to define the fractions 1 and 2 of fibers belonging to
II-D. Kinetic equation for the fractions 1 and 2
Kinetics of aggregation and of destruction of the aggregates is a complicated multiscale process. The aggregation is usually governed by the collisions between the aggregates of different sizes and is satisfactorily described by Smoluchowsky equation [65] allowing estimation of the aggregate size distribution. If the aggregation of spherical particles is well documented, the aggregation of fibers is studied only scarcely [66, 67] likely because of complexities related to orientational ordering and intricate cluster geometry. Development of a rigorous multiscale approach of the aggregation kinetics is out of scope of the present study.
Let n and 1 n number density of particles belonging to populations of aggregated and 2
free fibers, respectively, while n is the number density of all particles in the suspension. The particle conservation implies n n1 n2. The kinetic equations of both populations are written in the most general form, as follows:
1 c d dn q q dt (17a) 2 c d dn q q dt (17b)
where t is the time; q and c q are, respectively, the aggregate construction and the aggregate d destruction rates per unit volume of the suspension. The sum of both kinetic equations gives
/ 0
dn dt that verifies the particle conservation condition.
The aggregate construction is supposed to be governed by the fiber collision frequency, whose volume density has been estimated theoretically [8] and then confirmed by simulations [68]: c q 2 3 2 2 ln r n l r 2 2 f ln n V r (18)
where V , l and r are, respectively, the fiber volume, length and aspect ratio. The aggregation f
rate is then given by the product of the collision rate to the probability 0 that the collision
sticks the fibers together, also called the orthokinetic capture efficiency [69] and takes the form:
2 1 0 2 ln
c f
q k nV
r (19)where k1 is a dimensionless constant accounting for geometrical details of the fiber-fiber
According to the fracture scenario introduced in Sec. II-C, the aggregate destruction is supposed to be governed by the fracturing of unstable aggregates having an internal volume fraction i lower than that given by Eq. (14) and thus having an insufficient cohesive strength to resist to the shearing forces. The broken halves are expected to have nearly the same internal volume fraction as the original aggregate; they are therefore unstable and subject to a further fracturing. Thus, the first break-up could initiate a continuous fracturing-break-up process until the aggregates are fully disintegrated into separate fibers. In such a scenario, the destruction rate is given by:
d a
q n Jn nVa i a , (20) where na is the number density of the aggregates in the suspension; J is the number of fibers
per unit time moving apart from the destroyed aggregate under the action of the shear flow, ni
is the number density of the fibers in the aggregates, and Va is the aggregate volume. The
product n n appearing in the last equation is related to the number density a i n of the 1
aggregated fibers by the following expressions: n na i n V1/ a. The destruction rate is corrected by the term 1 / i to ensure zero rate when the fiber concentration in the suspension, , approaches the internal volume fraction i of aggregates – the yield point at which a
continuous fiber network is expected to occur. In this way, topological interactions between fibers are implicitly taken into account. The final expression for the volume density of the destruction rate reads:
2 1 1 d i q k n (21)
with k2 - a dimensionless constant, accounting for microscopic details of the aggregate
destruction. Combining together Eqs. (17a), (19) and (21), the kinetic equation for n is 1
written in its final form:
2 1 1 0 f ln( ) 2 2 1 1 i dn k V r n k n dt (22)
The number densities n and 1 n are related to the fractions 2 1 and 2 of the aggregated and free fibers by the following expressions: n1 1/Vf and n2 2/Vf. Replacing these formulas in Eq. (22) and taking into account the particle conservation [Eq.(1)], we arrive at the following equation with respect to 1:
2 1 1 0 ln( ) (1 1) 2 1 1 i d k r k dt (23)
1/2 1 1
( 2) (24a) 0 1 / 2 ln i r (24b)where k2/k1 is a dimensionless constant taken as an adjustable parameter of the present model and i is given by Eq. (14) as function of the applied stress . The fraction 2 of the
free fibers is obtained from Eqs. (1) and (24a):
1/2 211
( 2
)
(25)
The last unknown parameter intervening into the expressions (24a) and (25) for 1 and 2 is the sticking probability 0 given by the following expression estimated in
Appendix C:
0 e ln(2 )r NA1
(26) where the aggregation parameter NA is related to the applied shear stress by Eq. (2).
In summary, the suspension shear viscosity is calculated by Eqs. (7), (15), (16), in which the fiber fractions 1 and 2 are replaced by Eqs. (24) and (25), respectively. The three adjustable parameters of the model are the gap hH between free fibers, the effective
adhesive force FA, and the parameter appearing in the expression [Eq. (24)] for the fraction
1
of aggregated fibers.
III. Experiments
In this work two kinds of fiber suspensions were investigated: polyamide fiber (PA) and carbon nanotube (CNT) suspensions. The characterization and experimental measuring protocols for PA suspensions will be presented in Sec. III-A and III-B, while the CNT suspensions will be briefly characterized in Sec. III-C.
III-A. Polyamide fiber suspensions
The PA fibers (provided by “La société nouvelle le flocage”, France) of the length
l=0.5 mm and of two different diameters, d=15.2±0.5 µm and 27.8±0.5 µm, corresponding to
aspect ratios of r=33±1 and 18±0.5, were used. The fibers were monodisperse and their size was confirmed by optical microscopy measurements. The fiber density was measured precisely by a pycnometer method. Table I summarizes the size, the density and the effective stiffness (Eq. (S-16) in Supplemental Materials) [42] of both types of fibers.
The fiber surface roughness has been measured using an atomic force microscope (AFM). We obtained the values hR=5±2 nm and hR=14±4 nm of the arithmetic average
roughness (Ra) for the fibers of the aspect ratios, r=18 and r=33, respectively.
Table I. Characterization of PA fibers and CNT Material Length l [µm] Diameter d [µm] Aspect ratio r Density f [g/cm3] Effective dimensionless stiffness, Seff*** PA 500 15.2±0.5 33±1 1.340±0.001 4 – 4∙104 PA 500 27.8±0.5 18±0.5 1.090±0.001 30 – 3∙105 CNT 0.1-2.2 (0.5)* 0.007-0.025 (0.014)* 4-314 (36)** ≈2.0 0.4 – 4∙103
* The values in brackets correspond to the peak of the size distribution of CNT reported by Khalkhal et al. [37]; ** The value in brackets correspond to the ratio of the peak value of the CNT length to the peak value of its diameter
*** Estimations are provided in Sec. C of Supplemental Materials [42]
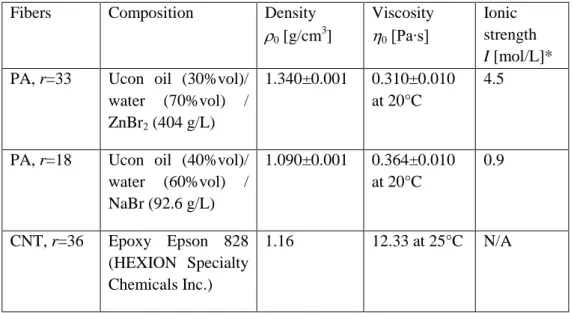
Table II. Characterization of the suspending liquid of the fiber suspensions
Fibers Composition Density
0 [g/cm 3 ] Viscosity 0 [Pa∙s] Ionic strength I [mol/L]*
PA, r=33 Ucon oil (30%vol)/ water (70%vol) / ZnBr2 (404 g/L)
1.340±0.001 0.310±0.010 at 20°C
4.5
PA, r=18 Ucon oil (40%vol)/ water (60%vol) / NaBr (92.6 g/L) 1.090±0.001 0.364±0.010 at 20°C 0.9 CNT, r=36 Epoxy Epson 828 (HEXION Specialty Chemicals Inc.) 1.16 12.33 at 25°C N/A
* Estimations are provided in Sec. C of Supplemental Materials [42]
The PA fibers were dispersed in a mixture of UCON oil 75H90000 (Dow Chemical, France; density oil=1.09 g/cm3, viscosity oil=30 Pa∙s at 25°C) in distilled water at different
volume fractions ranging from 1 to 17% depending on the fiber aspect ratio. This mixture has been chosen as a model system, ensuring the neutral buoyancy and having a relatively low viscosity that allows attaining a relatively high ratio of colloidal-to-hydrodynamic forces required for studies of the shear thinning behavior. Furthermore, UCON oil shows a good solubility in water without phase separation, and the mixture exhibits a perfectly Newtonian
response in the considered range of the shear rates, 102 102 s-1. An appropriate amount of zinc bromide (ZnBr2) or sodium bromide (NaBr) salt [Sigma-Aldrich, France] was added
into the mixture in order to adjust the density of the suspending liquid to that of the fibers. The composition of the suspending liquid for both fiber sizes is summarized in Table II along with its physical properties.
The fiber sedimentation time scale, the fiber effective stiffness Péclet and Reynolds numbers, inertial pressure, Debye screening length and Hamaker constant of PA/UCON-water system are estimated in Sec. C of Supplemental Materials [42]. These estimations allow us to draw the following conclusions on PA suspensions:
(a) the assumption (1) on rigid non-Brownian (Péclet number is Pe 3 107) and neutrally buoyant fibers is confirmed;
(b) the assumption (2) on laminar flow on the flow scale (Reynolds number Reflow 360) and particle scale (Rep 4 103) is validated;
(c) the electrostatic interactions are completely screened by a relatively large amount of brome salts added to the suspending fluid resulting in Debye length e-1<1 nm; PA
suspensions are therefore fitted into the frames of our model developed for attractive interactions [assumption (3)].
The same conclusions hold for CNT suspensions, as follows from appropriate characterizations and estimations done in the work of Khalkhal et al. [37].
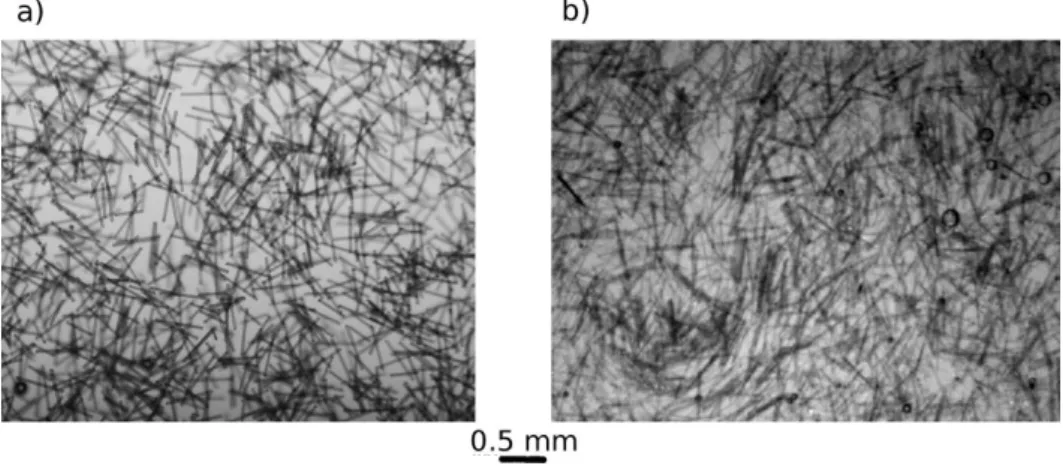
The quiescent PA fiber suspensions were visualized after shearing using an inverted optical microscope Nikon Dashpot. The micrographs shown in Fig. 2 confirm some spatial heterogeneity at relatively low suspension concentration.
Fig. 2. Optical microscopy images for quiescent PA fiber suspensions. The figure (a) corresponds to particle aspect ratio r=18 and =0.03; the figure (b) – to r=33 and =0.05
Existence and behavior of concentration heterogeneities can be better analyzed via observation of the suspension behavior under shear. The video available in Supplemental
Materials [70] (best viewed in Google Chrome or Safari browsers) shows the shearing of the suspension of fiber volume fraction =0.05 and aspect ratio r=18 at a shear rate 0.3 s-1
and at the gap between moving plates fixed to three fiber lengths. The experiment starts with a short and intense pre-shear at 50 s-1 applied before the main shearing at 0.3 s-1 in order to be closer to the experimental protocol of the rheometric measurements [Sec. III-B]. The following information can be drawn from this observation: (a) the existence of denser domains separated by free fibers is confirmed; (b) the fibers belonging to these domains seem to exhibit a cooperative motion and some misalignment relatively to each other; (c) it was impossible to measure the spatial correlation of fiber velocities but we estimated the spatial correlation of the particle concentration applying a Fourier transform to the image intensity and assigning the lowest harmonic to the correlation length; this length was about one-to-two fiber lengths,
D(1–2)l, and was taken as a rough estimate of the aggregate size; notice that density and
velocity correlation lengths could be different, thus an exhaustive experimental study is required for a precise determination of the aggregate size distribution; (d) some domains have an isotropic shape, other ones – an extended shape aligned with the main flow, however the Fourier analysis appears to be very rough to indicate precise values of the aggregate aspect ratio; it is estimated to lie in the range 1<ra<3; (e) some rearrangement of fibers inside the
denser domains is observed but it is difficult to follow kinetics of their formation and disintegration because of their small travel distance limited by the narrow observation window. Even though more accurate image processing would be necessary to well characterize the aggregate morphology, we believe that these observations are in agreement with our basic assumptions (3.1)-(3.4) concerning particle aggregation, as we defined it in Sec. II-A.
III-B. Experimental procedure on polyamide fiber suspensions
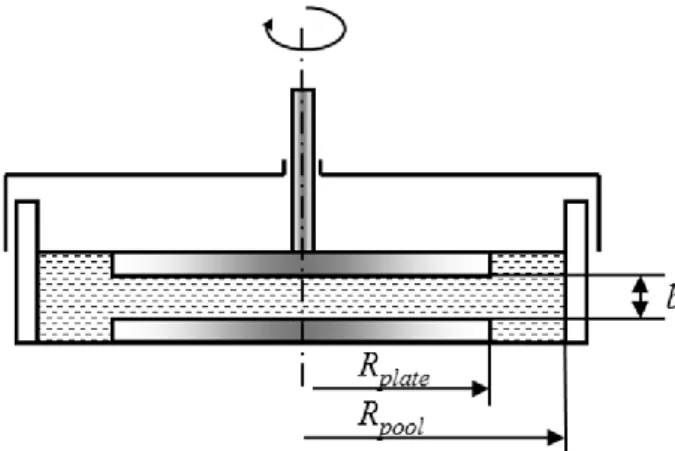
The viscosity measurements are carried out with a controlled-stress rheometer (Thermo Mars II) in rotating parallel plate geometry. The suspension is introduced into a pool and sheared by a rotating top disk, as shown schematically in Fig. 3. The suspension level in the pool is adjusted to the upper surface of the rotating plate. This allows minimization of capillary pressure effects and shear rate oscillations at low shear rates. The pool is covered by a Plexiglas lid in order to minimize evaporation of the suspending liquid. The temperature of the lower plate (bottom of the pool) is kept constant and equal to 20°C by a standard Peltier element, while the experimental room is air conditioned at 22°C. The measuring system had the following dimensions: the rotating plate and the pool radii were Rplate=30 mm and Rpool=44 mm, respectively. The gap between the rotating plate and the bottom of the pool was varied in the range b=2-10 mm. This geometry was chosen in order to decrease possible effects of the fiber or aggregate confinement in the measuring gap. However, due to shearing of the suspension in the pool outside the gap, this geometry gives overestimated values of the viscosity and the appropriate correction is described in Sec. C of Supplemental Materials [42]. To check the confinement effect, we have measured the suspension viscosity in the pool geometry at different gaps b, ranging from 1 to 6 mm. The measurements show that the
suspension viscosity becomes independent of the gap at b>4 mm. We expect therefore that the confinement effects are negligible when the gap is set to b=5 mm for all the measurements reported in the present paper. This is also consistent with the scale separation, Db
assumed in our model [assumption (8)] and approximately verified in visualization experiments [Sec. III-A], where D(1 2) l0.5 1 mm is the aggregate length scale.
Fig. 3. Sketch of the experimental pool geometry
The measurements are performed in a controlled-stress mode using the following protocol. First, the suspension is pre-sheared for 3 min at 102 s-1. Then, the suspension is left at rest for 3 min. Then, the constant shear stress of the lowest value (corresponding approximately to 102 s-1) is applied for a time ranging between 2 and 5 h, long enough to ensure that the steady state has been reached. The shear rate and the suspension viscosity are measured as function of time. At the end of this period, the suspension is left un-sheared for 3 min, and sheared again for 3 min at 102 s-1, left un-sheared once more for 3 min, and a new value of the constant shear stress is applied for a time sufficient for reaching the steady-state. For adequate comparison with the theory, the Moony correction is applied to the shear stress and the shear viscosity, as explained in details in Sec. C of Supplemental Materials [42]. This procedure with a pre-shear stage is repeated for all the values of the applied shear stress (increasing at each new step) until its highest value corresponding to 102 s-1. In some cases, the measurements have also been continued by a decreasing shear stress ramp. And, even though the full measurement lasts several hours, we did not observe distinguishable flow curve hysteresis and the low-shear steady-state viscosity was found to be the same at the beginning and the end of the test. This proves the absence of sedimentation and evaporation of the suspending liquid, in agreement with the estimation by Eq. (S-14) in Supplemental Materials [42], as well as the absence of aging effects. Furthermore, shear-induced particle migration, either within the gap or from the inside to outside of the gap, appears not to play any role, in agreement with the assumption (8) and with the experimental data on suspensions of spherical particles in parallel plate geometry [71-73].
It is important to note that our measuring protocol with high shear rate pre-shearing ensured the similar initial conditions for each value of the applied shear stress. This allowed us to exclude the effects of the shear history on the suspension rheology.
III-C. Carbon nanotube suspensions
The CNT suspensions have been characterized in details in the work of Khalkhal et al. [37]. Some parameters of the multiwall CNT particles are summarized in Table I. The particles showed a rather broad distribution of their length and diameter, with the values l=0.5 µm and d=14 nm corresponding to the peak of the size distribution curves. These values result in an effective aspect ratio r=36 and were used for the comparison between experiments and our model.
The multiwall CNTs were dispersed in a Newtonian epoxy resin Epson 828 (HEXION Specialty Chemicals Inc.) having a viscosity 0=12.3 Pa.s at 25°C at different volume
fractions ranging from 0.59 to 2.36%. The estimations using Eqs. (S-14)-(S-16) in Supplemental Materials [42] allow one to neglect the CNT settling during experiments and consider them as rigid and non-Brownian within the experimental range of applied shear rates, even though the electron microscopy reveals some bending of fibers likely because of some local defects. The Hamaker constant for CNT/epoxy system was evaluated to be
A10-20 J (cf. Sec. C of Supplemental Materials) [42]. Unfortunately, there is no more precise information about colloidal interactions between the CNT and their surface roughness.
A torsional cone-plate flow was realized using an Anton Paar Physica MCR 501 rheometer in a controlled-rate mode with a rotating cone having a diameter of 50 mm and an apex angle of 2°. The shear rate is homogeneous in this geometry, and any rheological correction is not required. The flow respected the non-inertia limit according to the estimations of the Reynolds numbers and of the inertial pressure (cf. Eqs. (S-19) and (S-20) in Supplemental Materials) [42]. The experimental protocol is described in details in the work of Natale et al. [34].
IV. Results and discussion IV-A. Transient response
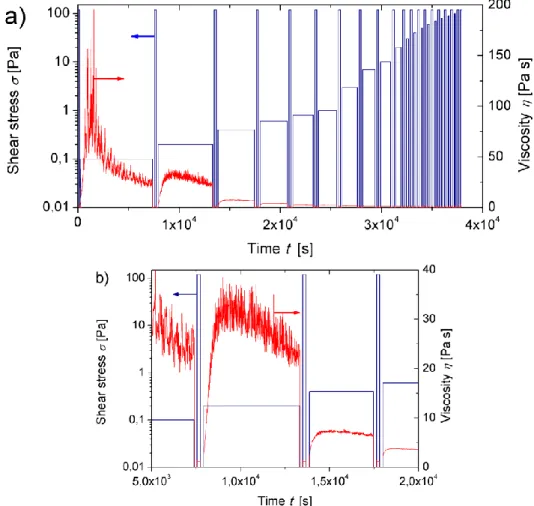
Experimental time dependency of the viscosity of PA fiber suspension during all the measurement corresponding to the increasing stress ramp including pre-shearing stages between each applied stress is shown in Fig. 4a for the particle volume fraction =0.09 and aspect ratio r=18. The time dependency of the imposed shear stress is also shown on this figure. As is seen from this figure, the total duration of the measurement is about 10.5h. The duration of the longest measurement step between intense pre-shearing steps (that are expected to re-suspend the particles) is 2h and is smaller than the typical settling time of 7h, estimated by Eq. (S-14) in Supplemental Materials [42].
A detailed view of the second and the third stress steps (=0.2 Pa and 0.3 Pa) is presented in Fig. 4b for the same suspension. This figure deserves some comments. Firstly, the viscosity signal for =0.2 Pa is quite noisy probably because such a small imposed stress generates an extremely low shear rate of about 2∙10-3
s-1 being near the detection limit of the rheometer. Another possible reason could come from an unstable and inhomogeneous flow of highly aggregated suspension at very low shear rate near the yield point. The viscosity signal becomes rather smooth and regular starting from the imposed stress equal to 0.3 Pa.
Fig. 4. Transient rheological response of a PA fiber suspension with a particle aspect ratio r=18 and a particle volume fraction =0.09. The figure (a) corresponds to the whole duration of the experiment; the figure (b) is a detailed view of the second and third stress steps at imposed shear stress equal to =0.2 Pa and 0.3 Pa. On both graphs, the blue line corresponds to the imposed stress (t); the red curve – to the viscosity ( )t . Raw values of
the viscosity are presented in figures (a) and (b) without performing the correction due to the pool geometry. Secondly, very large times are required to achieve the steady state viscosity at low shear rates 10-2 s-1. This can be easily understood in terms of slow orientation dynamics of fibers in the shear flow. The Jeffery period of the rotation of high aspect ratio fibers is given by [3]: Trot 2 r/ that gives about 3h for r=18 and 102 s-1. Even though the fibers are pre-oriented by intense pre-shearing at the beginning of each measurement, they spend almost half of the Jeffery period being nearly aligned with the flow and trying to readjust their mean
orientation to the new steady state value. Another possible reason for a slow dynamics is the kinetics of aggregation. The aggregation governed by pair collisions between fibers has a time scale of Tagr1. A more precise estimation based on the solution of the kinetic equation (23) gives the value of about 0.5h for the time required for the fraction, 1, of aggregated fibers to reach 95% of its steady state value at 10 s2 1, r=18 and =0.17 [we set
1 2 0
k k 1 in Eq.(23)]. Thus, taking into account uncertainties in kinetic coefficients k1
and k2, kinetics of aggregation and orientation could have comparable time scales, both
governing the long-time transient response of the suspension. IV-B. Steady-state: high shear viscosity
The steady-state values of the shear rate and of the suspension viscosity at a given shear stress were calculated by the time averaging of the experimental ( )t and ( )t
dependencies [Fig. 4] over the last quarter of the corresponding time interval. Before the study of the suspension shear thinning, it is important to inspect the high shear rate response when all the aggregates are expected to be destroyed and the suspension should behave as a Newtonian fiber suspension in absence of non-hydrodynamic interactions. The theoretical and experimental dependencies of the high shear relative viscosity r / 0 on the particle volume fraction is presented in Fig. 5a for PA fibers of both aspect ratios r=18 and 33.
The experimental values of r (symbols in Fig. 5a) were taken at the highest shear rate 102 s-1, while the theoretical values (solid lines) where calculated by Eq. (7), in which the fraction of the free fibers was set to one: 2 1. As is seen from this figure, both experimental and theoretical concentration dependencies are stronger than linear indicating the presence of hydrodynamic interactions between fibers. The pair-wise lubrication interactions between free fibers have been taken into account in our model producing a term quadratic in particle volume fraction [last term in Eq. (7)]. Recall that the theoretical expression (7) contains one adjustable parameter – the gap hH between the free fibers. A
satisfactory fit of the experimental curves was ensured almost in the whole range of particle volume fractions except for the highest concentrations. The disagreement at high concentrations likely comes from the fact that pair-wise lubrication forces between free fibers are insufficient to describe the viscosity of highly concentrated suspensions. The following values of hH were used to ensure the best fits: hH=6 µm for the fibers of the aspect ratio r=33
Fig.5. Experimental and theoretical dependencies of the relative high shear viscosity of the PA fiber suspensions on the particle volume fraction (a) and on the factor (b). Solid curves – theory [Eq. (7) with
2 1
].
It is known that, in the low diffusion, D rr 3/ 1, and high aspect ratio, r1
limits, the relative viscosity of dilute-to-semi-dilute fiber suspensions is approximately proportional to the product r of the particle concentration and the fiber aspect ratio [3, 58].
More precisely, according to Eq. (7), we expect that the relative viscosity r is proportional to the factor rln1/ 2( )r fII/ ln(2 )r in the low concentration limit, (1d h/ H)1, when the lubrication forces between fibers give a negligible contribution to the suspension viscosity. In this case, the data for fibers of different aspect ratios are expected to fit onto a single master curve r f( ) . To check this point, we plot experimental and theoretical dependencies of the relative viscosity on the factor on Fig. 5b for both aspect ratios r=18 and 33. The experimental data for two aspect ratios collapse in a single curve in a relatively wide range of factors , namely 0<<2, while the data diverge at ≈3.
Notice that our aggregation model [Sec. II-C] allows recovering the high shear viscosity [Eq. (7)] due to the fact that, at high applied stresses, the sticking probability tends
to zero [Eq. (26)] such that the fraction of free fibers tends to unity, 2 1 [Eq. (25) with
at 0 0].
IV-C. Steady-state: shear thinning behavior
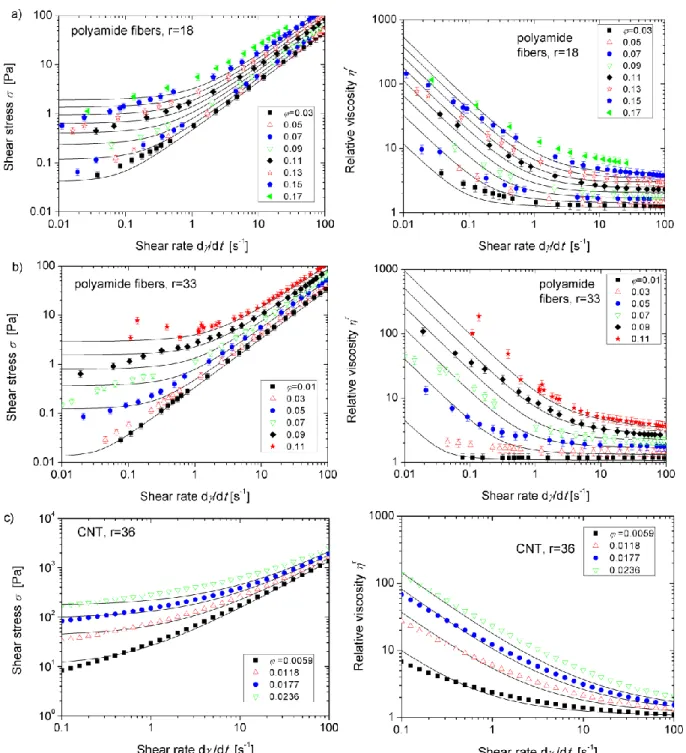
Experimental and theoretical flow curves are shown on the left column of Fig. 6, while the shear rate dependency of the relative viscosity r / 0 is shown on the right column of this figure, for PA fibers with aspect ratio r=18 [Fig. 6a], PA fibers with r=33 [Fig. 6b] and CNT dispersed in a Newtonian epoxy resin [Fig. 6c]. Theoretical ( ) and ( ) dependencies are obtained in parametric form using ( ) / ( ). All the theoretical curves were fitted to experimental data using the set of the adjustable parameters (hH, FA, )
summarized in Table IV of Appendix D. In what concerns the aggregate shape, analysis conducted in Sec. A of Supplemental Materials [42] shows that the aggregate aspect ratio ra
has only a minor influence on the suspension viscosity in the range 1 ra 3 corresponding to our experiments on PA suspensions. Therefore, all the calculations reported in the present paper correspond to the spherical aggregate shape.
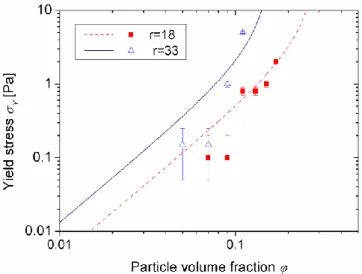
All the theoretical and experimental flow curves shown on the left column in Fig. 6 share the following common features: (a) they show a shear-thinning behavior; (b) they are shifted upwards with increasing the particle concentration signifying an increase of the viscous dissipation. In double logarithmic scale, some experimental flow curves show a two step behavior with an intermediate quasi-plateau (Fig. 6b for r=33 and =0.07 and 0.09). Such a shape is reminiscent for shear banding and/or wall slip in complex fluids [74]. A similar flow curve shape has been observed in flocculated cellulose suspensions for which existence of shear banding and wall slip were confirmed by flow visualization and by measurements of the velocity profiles [11, 62, 75]. However, our preliminary observations under shear did not allow a clear justification for existence of shear banding, while the wall slip usually leads to a gap dependence of the suspension viscosity, which has not been detected for the gaps b>4 mm. Our model (solid lines) better reproduces the experimental flow curves at shear rates 0.1 s-1 and predicts a low shear plateau at 0.1 s-1 reminiscent for the yield stress [Sec. IV-D]. A discrepancy at low shear rates could come from the representation of the suspension structure by spherical aggregates instead of a continuous fiber network.
Fig. 6. Experimental and theoretical flow curves (left column) and viscosity versus shear rate dependences (right column) of different fiber suspensions at different particle volume fractions: PA microfibers
with the particle aspect ratio equal to r=18 (a); PA microfibers with r=33 (b); and CNT with r=36 (c). Symbols correspond to experiments and solid lines – to the theory. The values of the adjustable parameters are
summarized in Table IV in Appendix D.
The observed shear thinning behavior can be better analyzed with the help of the shear rate dependency of the relative viscosity [right column of Fig. 6]. Let us first analyze the curves corresponding to the PA fiber suspensions and then compare them to those corresponding to the CNT suspensions. Qualitatively, for PA fibers, both the theory (solid curves) and experiments (symbols) reveal a rather strong shear thinning with an increase of