HAL Id: inserm-02157599
https://www.hal.inserm.fr/inserm-02157599
Submitted on 17 Jun 2019
HAL is a multi-disciplinary open access
archive for the deposit and dissemination of
sci-entific research documents, whether they are
pub-lished or not. The documents may come from
teaching and research institutions in France or
abroad, or from public or private research centers.
L’archive ouverte pluridisciplinaire HAL, est
destinée au dépôt et à la diffusion de documents
scientifiques de niveau recherche, publiés ou non,
émanant des établissements d’enseignement et de
recherche français ou étrangers, des laboratoires
publics ou privés.
CD28 blockade controls T cell activation to prevent
graft-versus-host disease in primates
Benjamin Watkins, Victor Tkachev, Scott Furlan, Daniel Hunt, Kayla Betz,
Alison Yu, Melanie Brown, Nicolas Poirier, Hengqi Betty Zheng, Agne
Taraseviciute, et al.
To cite this version:
Benjamin Watkins, Victor Tkachev, Scott Furlan, Daniel Hunt, Kayla Betz, et al.. CD28 blockade
controls T cell activation to prevent graft-versus-host disease in primates. Journal of Clinical
Investi-gation, American Society for Clinical InvestiInvesti-gation, 2018, 128 (9), pp.3991-4007. �10.1172/JCI98793�.
�inserm-02157599�
Introduction
Graft-versus-host disease (GVHD) represents a major cause of mortality after hematopoietic stem cell transplant (HCT) (1–4), and despite substantial effort, the control of GVHD remains one of the key unmet needs in the field. Moreover, prevailing calci-neurin-based therapies are associated with significant off-target toxicities (5, 6) and are not associated with immune tolerance induction (7, 8). This has intensified investigation into calci-neurin-free regimens, employing strategies that have been shown in preclinical models to be protolerogenic. Of the new approaches, those targeting T cell costimulation are being increasingly inves-tigated in auto- and alloimmunity (9, 10) and are beginning to be explored to prevent and treat acute GVHD (aGVHD) (11–13). One of the most potent T cell costimulation pathways occurs through CD28:CD80/86 ligation (14). Blockade of the CD80/86 com-ponent of CD28:CD80/86 costimulation with CTLA4-Ig (using
either of the 2 FDA-approved formulations, abatacept or belata-cept) represents the first successful clinical translation of costim-ulation blockade (9, 11, 12, 15–20). However, targeting CD80/86 has not been entirely successful in downregulating auto- and alloimmunity (10, 21–23) and may be associated with untoward immune-activating effects through blockade of CD80/86-depen-dent coinhibitory pathways (24–35). Given these challenges with CTLA4-Ig, there has been growing interest in more selectively tar-geting CD28 (36–41), and these approaches have shown efficacy in selected preclinical models (42–49). Although the molecular mechanisms by which CD28 blockade controls T cell alloactiva-tion have been proposed (50), the comprehensive interrogaalloactiva-tion of the relative efficacy of targeting CD28 versus CD80/86 and associated safety signatures (both alone and when combined with other immunomodulators) have been undetermined, and these aspects, which have not been comprehensively interrogated, rep-resent key questions in the field, given that reagents targeting both CD80/86 and CD28 are now clinically available.
To thoroughly address these mechanistic issues, we used the nonhuman primate (NHP) GVHD model to evaluate a clinically available therapeutic anti-CD28 Fab′, FR104 (42, 43, 45, 46, 48), in order to determine its impact on T cell function, reconstitution, and GVHD, both as a monoprophylaxis and combined with the Controlling graft-versus-host disease (GVHD) remains a major unmet need in stem cell transplantation, and new, targeted
therapies are being actively developed. CD28-CD80/86 costimulation blockade represents a promising strategy, but targeting CD80/CD86 with CTLA4-Ig may be associated with undesired blockade of coinhibitory pathways. In contrast, targeted blockade of CD28 exclusively inhibits T cell costimulation and may more potently prevent GVHD. Here, we investigated FR104, an antagonistic CD28-specific pegylated-Fab′, in the nonhuman primate (NHP) GVHD model and completed a multiparameter
interrogation comparing it with CTLA4-Ig, with and without sirolimus, including clinical, histopathologic, flow cytometric, and transcriptomic analyses. We document that FR104 monoprophylaxis and combined prophylaxis with FR104/sirolimus led to enhanced control of effector T cell proliferation and activation compared with the use of CTLA4-Ig or CTLA4-Ig/sirolimus. Importantly, FR104/sirolimus did not lead to a beneficial impact on Treg reconstitution or homeostasis, consistent with control of conventional T cell activation and IL-2 production needed to support Tregs. While FR104/sirolimus had a salutary effect on GVHD-free survival, overall survival was not improved, due to death in the absence of GVHD in several FR104/ sirolimus recipients in the setting of sepsis and a paralyzed INF-γ response. These results therefore suggest that effectively
deploying CD28 in the clinic will require close scrutiny of both the benefits and risks of extensively abrogating conventional T cell activation after transplant.
CD28 blockade controls T cell activation to prevent
graft-versus-host disease in primates
Benjamin K. Watkins,1 Victor Tkachev,2 Scott N. Furlan,2 Daniel J. Hunt,2 Kayla Betz,2 Alison Yu,2 Melanie Brown,2
Nicolas Poirier,3,4,5 Hengqi Betty Zheng,2 Agne Taraseviciute,2 Lucrezia Colonna,2 Caroline Mary,3,4,5 Gilles Blancho,3,4
Jean-Paul Soulillou,3,4 Angela Panoskaltsis-Mortari,6 Prachi Sharma,7 Anapatricia Garcia,7 Elizabeth Strobert,7
Kelly Hamby,1 Aneesah Garrett,1 Taylor Deane,1 Bruce R. Blazar,6 Bernard Vanhove,3,4,5 and Leslie S. Kean2
1Aflac Cancer and Blood Disorders Center, Children’s Healthcare of Atlanta, Emory University, Atlanta, Georgia, USA. 2Ben Towne Center for Childhood Cancer Research, Seattle Children’s Research Institute;
The University of Washington; Fred Hutchinson Cancer Research Center, Seattle, Washington, USA. 3Centre de Recherche en Transplantation et Immunologie, UMR 1064, INSERM, Université de Nantes,
Nantes, France. 4Institut de Transplantation Urologie Néphrologie (ITUN), Centre Hospitalier Universitaire (CHU) Nantes, Nantes, France. 5OSE Immunotherapeutics, Nantes, France. 6Department of
Pediatrics, Division of Blood and Marrow Transplantation, University of Minnesota, Minneapolis, Minnesota, USA. 7Yerkes National Primate Research Center, Atlanta, Georgia, USA.
Authorship note: BKW and VT contributed equally to this work.
Conflict of interest: NP, CM, JPS, and BV are shareholders in OSE Immunotherapeutics, a
company developing CD28 antagonists.
Submitted: November 21, 2017; Accepted: June 26, 2018. Reference information: J Clin Invest. 2018;128(9):3991–4007.
The Journal of Clinical Investigation
R E S E A R C H A R T I C L E
uated either as monoprophylaxis or in combination with sirolimus for its ability to prevent GVHD in the setting of MHC-haploiden-tical T cell–replete HCT (Figure 1A). Figure 1B shows the resulting FR104 pharmacokinetics (PKs) in the current study. During the period of antibody dosing, the average FR104 trough was 28.6 μg/ml ± 2.3 μg/ml, a level previously shown to successfully block CD28 in healthy controls (HCs) (46). After antibody discontinu-ation at day 54, FR104 levels steadily declined, with a terminal half-life of 5.6 ± 1.0 days, resulting in undetectable FR104 levels after day 66 after transplant (Figure 1B) (45, 46). To directly assess CD28 receptor occupancy with FR104 in the setting of HCT, we measured the crossblocking of CD28 expression flow cytometri-cally using a mouse anti-CD28 antibody (clone CD28.2) prior to each FR104 dose (Figure 1C). This analysis confirmed more than 97.5% and more than 99% CD28 blockade on CD4+ and CD8+ T
mTOR inhibitor sirolimus, and to compare this agent with CTLA4-Ig–based GVHD prevention strategies (51). These experiments pro-vide strong epro-vidence for superior control of T cell proliferation and activation when CD28 is directly targeted, as compared with when CD80/86 is targeted. However, while the combination of anti-CD28 and sirolimus led to superior GVHD-free survival, it did not enhance Treg homeostasis, nor did it improve overall recipient sur-vival as compared with CTLA4-Ig/sirolimus. These studies under-score the complex nature of targeted blockade of cosignaling path-ways and suggest that head-to-head comparisons of these agents are indicated in clinical trials for GVHD prevention and treatment.
Results
CD28 blockade: pharmacokinetics, pharmacodynamics, and donor engraftment. In this study, CD28 blockade with FR104 was
eval-Figure 1. The NHP model of aGVHD, FR104 PK, and pharmacodynamics analysis. (A) Experimental schematic. (B) PK analysis. PK was performed by ELISA on samples collected prior to and 30 minutes after each FR104 dosing and then on days 64, 71, 78, and 85 and at terminal analysis. Data combine FR104 (n = 3) and FR104/sirolimus (n = 9) cohorts. Data are shown as mean ± SEM. The vertical dashed line is drawn at day 66 to indicate the time period after which effective FR104 concentrations were no longer present in the peripheral blood. (C) The relative occupancy of CD28 receptors (number of CD28+
cells detectable with clone CD28.2 antibodies) within CD3+CD14–CD20–CD4+CD8– (top panel) and CD3+CD14–CD20–CD4–CD8+ (bottom panel) T cell
popula-tions measured longitudinally by flow cytometric analysis in FR104 (n = 3) and FR104/sirolimus (n = 9) cohorts. Data are shown as mean ± SEM. Shaded areas represent the time period of FR104 dosing. (D and E) The percentage of CD28+ cells within CD3+CD20–CD4+CD8– (top panels) and CD3+CD20–CD4–CD8+
(bottom panels) T cell populations in blood and tissue from FR104 (n = 3; D) and FR104/sirolimus, euthanized before day 66 after transplant (n = 6) or after day 66 (n = 3). (E) Treated recipients before transplantation and at the time of necropsy measured by flow cytometric analysis.
No Rx (MST = 10 days, P = 0.23 versus No Rx; Figure 2, A and B), and sirolimus monoprophylaxis had a clinically modest, albeit sta-tistically significant impact on GVHD-free survival (MST = 17 days,
P = 0.003 versus No Rxl Figure 2, A and B). As shown in Figure 2, A
and C, CD28 blockade with FR104 as monoprophylaxis delayed the onset of clinical GVHD compared with that in the No Rx cohort and was associated with early control of disease compared with both CTLA4-Ig and sirolimus monoprophylaxis. Thus, at 7 days after transplant, each of the other monoprophylaxis cohorts displayed moderate-to-severe clinical aGVHD, while animals receiving FR104 monoprophylaxis were still significantly controlling disease (Figure 2C). However, as shown in Figure 2, A, D, and E, GVHD did ultimately develop in the FR104 monoprophylaxis cohort. The delay in the onset of aGVHD in the FR104 monoprophylaxis cohort was associated with a survival advantage compared with both the No Rx and CTLA4-Ig cohorts (MST for the FR104 monoprophy-laxis cohort = 21 days, P = 0.003 versus No Rx, P = 0.013 versus CTLA4-Ig, P = 0.95 versus sirolimus; Figure 2B).
Transcriptomic analysis of T cells purified at day 14 from the peripheral blood of recipients in the FR104 monoprophylaxis cells, respectively, in the peripheral blood when recipients were
receiving FR104 as well as blockade of T cell CD28 expression in the bone marrow, gastrointestinal (GI) tract, spleen, and lymph node (LN), with more variable blockade in the liver (Figure 1, D and E). However, as expected from the PK analysis, after day 66 after transplant, we observed desaturation of CD28 occupancy in both blood and tissue T cells (Figure 1E).
Monoprophylaxis with FR104 demonstrates clinical activity against aGVHD with evidence for improved efficacy compared with CTLA4-Ig monoprophylaxis. Figure 2 depicts the clinical and
his-tologic aGVHD outcomes after prophylaxis with FR104 alone as well as with combination FR104/sirolimus when compared with 4 historical cohorts: no prophylaxis (No Rx) (n = 11), sirolimus (n = 4), CTLA4-Ig (n = 4), and CTLA4-Ig/sirolimus (n = 7) (51, 52). As shown and as we previously reported (12, 53), recipients in the No Rx cohort developed severe multiorgan aGVHD concomitant with the first signs of lymphocyte engraftment and expansion and a short median survival time (MST) of 8 days (Figure 2, A and B). Also, as previously described (51, 52), CTLA4-Ig monoprophylaxis did not significantly prolong GVHD-free survival compared with
Figure 2. Clinical aGVHD scoring and aGVHD-free survival. (A and B) Longitudinal clinical aGVHD scoring (A) and GVHD-free survival curves (B) of untreated (No Rx, n = 11; red), CTLA4-Ig (n = 4; pink), sirolimus (n = 6; orange), FR104 (n = 3; blue), FR104/sirolimus (n = 9; navy), and CTLA4-Ig/sirolimus (n = 7; purple) cohorts. Scoring was based on our previously described NHP aGVHD clinical scoring system (12). GI aGVHD scores from FR104/sirolimus recipients with documented enteric infections were censored. Data are shown as mean ± SEM. For GVHD-free survival analysis, FR104/sirolimus recipients with documented graft rejection were excluded from this analysis. The Kaplan-Meier product-limit method was used to calculate survival. (C) Clinical aGVHD scoring in untreated (No Rx, n = 11), CTLA4-Ig (n = 4), sirolimus (n = 6), and FR104 (n = 3) cohorts on day 7. GI aGVHD scores from FR104/sirolimus recipients with documented enteric infections were censored. Data are shown as mean ± SEM. Statistical analysis was performed using 1-way ANOVA with Holm-Šidák multiple-comparison post test. (D) Clinical aGVHD scoring in the following cohorts, each at terminal analysis: untreated (No Rx, n = 11), CTLA4-Ig (n = 4), sirolimus (n = 6), FR104 (n = 3), FR104/sirolimus recipients undergoing terminal analysis before day 66 (n = 6), FR104/sirolimus recipients undergoing terminal analysis after day 66 (n = 3), CTLA4-Ig/sirolimus (n = 7), and autologous controls (n = 3). Data are shown as mean ± SEM. Statistical analysis was performed using 1-way ANOVA with Holm-Šidák multiple comparison post test. (E) Terminal aGVHD histopathologic scores. The scores shown represent the total score for the skin, liver, and GI tract (83). GI aGVHD scores from FR104/sirolimus recipients with documented enteric infections were censored. Data are shown as mean ± SEM. Statistical analysis was performed using 1-way ANOVA with Holm-Šidák multiple-comparison post test. *P < 0.05; **P < 0.01; ***P < 0.001.
The Journal of Clinical Investigation
R E S E A R C H A R T I C L E
cohorts. These included gene sets indicating relative preservation of naive T cells in the FR104 versus No Rx comparison (Figure 3A) and underrepresentation of gene sets associated with cell prolif-eration, T cell antigen–dependent activation, and effector differ-entiation in the FR104 cohort (Figure 3B). In contrast, when com-pared with HCs, the day 14 FR104 monoprophylaxis T cells were clearly not quiescent and demonstrated relative enrichment for these same gene sets (Figure 3C). Thus, while relatively controlled compared with fulminant hyperacute GVHD, immune escape during FR104 monoprophylaxis was nonetheless occurring.
The monoprophylaxis cohorts also permitted a direct compar-ison of the transcriptome of T cells in the setting of CD28 block-ade versus blockblock-ade of CD80/86, and as documented in Figure 3, D–F, and Supplemental Table 2, there were numerous gene sets cohort (Figure 3 and Supplemental Tables 1 and 2; supplemental
material available online with this article; https://doi.org/10.1172/ JCI98793DS1) provided insights into the immune pathways responsible for the bioactivity of FR104 in delaying GVHD as well as the ultimate immune escape that occurred despite anti-CD28 monoprophylaxis. Differential expression analysis highlighted the ultimate similarities in the severity of GVHD in both the FR104 and No Rx cohorts in that there were no differentially expressed (DE) genes between these 2 cohorts using a differential expression threshold of 1.4-fold and a P value of less than 0.05, corrected for multiple testing (Supplemental Table 1). However, despite the lack of individual transcript differences, gene set enrichment analysis (GSEA) (54), revealed relative over- and underrepresentation of multiple gene sets in the FR104 monoprophylaxis versus No Rx
Figure 3. GSEA comparing FR104 versus CTLA4-Ig as monoprophylaxis. (A) GSEA showing a representative enrichment plot of naive T cell–related gene sets comparing T cells isolated from the FR104 cohort at day 14 (n = 3) and T cells isolated from the No Rx cohort at terminal analysis (n = 11). (B) GSEA showing underrepresented traces of cell proliferation–, antigen-dependent T cell maturation–, and effector differentiation–related gene sets between the FR104 cohort at day 14 (n = 3) and the No Rx cohort at terminal analysis (n = 11). (C) GSEA showing representative enrichment plots of cell proliferation–, antigen-dependent T cell maturation–, and effector differentiation–related gene sets between the FR104 cohort at day 14 (n = 3) and the HC cohort (n = 56). (D) GSEA showing underrepresentation of CTLA4-KO–related genes in the FR104 (n = 3) versus CTLA4-Ig (n = 4) comparison at day 14. (E) GSEA showing enrichment of a representative naive T cell signaling pathway in the FR104 (n = 3) versus CTLA4-Ig monoprophylaxis (n = 4) comparison. (F) GSEA showing underrepresented traces of cell cycle, effector T cell, antigen response, and cytotoxicity gene sets in a comparison of FR104 (n = 3) versus CTLA4-Ig (n = 4) cohorts at day 14. FDR for each of these comparisons corresponds to q < 0.05.
detail below, 3 other recipients in this cohort did not reach the planned endpoint: R.222 died at day 21 of a hemorrhagic stroke prior to platelet engraftment (platelet count 14 at terminal anal-ysis); R.213 died at day 66 unexpectedly after anesthesia, in the setting of intercurrent giardia infection; R.250 died at day 72 of culture-negative sepsis. None of these animals had signs of clini-cal GVHD at the time of their deaths.
As shown in Figure 2B, despite the early deaths, the clinical protection from aGVHD resulted in prolongation of GVHD-free survival in the FR104/sirolimus cohort compared with multi-ple other cohorts, including the No Rx, sirolimus, and CTLA4-Ig monoprophylaxis cohorts as well as the CTLA4-CTLA4-Ig/sirolimus cohort (51): P < 0.0001 vs. No Rx (MST = 8 days); P = 0.0001 vs. CTLA4-Ig (MST = 10 days); P = 0.0005 vs. sirolimus (MST = 17 days); P < 0.0014 vs. FR104 (MST = 21 days); and P = 0.004 vs. CTLA4-Ig/sirolimus (MST = 34 days). As shown in Figure 2, D and E, histopathologic GVHD scores for animals in the FR104/ sirolimus cohort were divided into 2 groups: (a) those necropsied during ongoing FR104 exposure (defined as animals necropsied prior to day 66 after transplant, with this cutoff based on the PK analysis depicted in Figure 1B) and (b) those that were necropsied after FR104 washout (Figure 2, D and E). The histopathologic GVHD scores of animals necropsied during ongoing FR104 expo-sure aligned with clinical aGVHD scores, with significantly less GVHD-associated pathology in comparison with the No Rx cohort (2.2 ± 0.5 vs. 6.9 ± 0.6; P = 0.003), which was similar to what was found in autologous transplant controls. Of note, while animals necropsied after FR104 washout did not show significant clinical signs of GVHD at terminal analysis (Figure 2D), histopathologic analysis did indicate subclinical pathology in these animals in the skin, liver, and colon (Figure 2E and Supplemental Table 3), with a total pathologic score of 4.2 ± 0.8 (P = 0.94 compared with No that were significantly different in T cells purified from these
recipients. Importantly, this analysis uncovered evidence for the absence of CTLA4 signaling in the CTLA4-Ig cohort compared with the FR104 cohort (Figure 3D). In addition, GSEA identified significant enrichment for resting/naive T cell gene signatures in the FR104 cohort compared with the CTLA4-Ig cohort (Figure 3E). In contrast, T cells isolated from recipients in the CTLA4-Ig monoprophylaxis cohort demonstrated enrichment for gene sets involved in (a) cell cycle/proliferation, (b) effector T cells, (c) anti-gen response, and (d) cytotoxicity (Figure 3F).
Long-term control of GVHD with FR104/sirolimus combination prophylaxis. While both sirolimus and FR104 as monoprophylaxis
only modestly delayed the onset and lethality of aGVHD (Figure 2, A–D), the combination of these agents synergistically con-trolled disease. Two FR104/sirolimus cohorts were examined. In cohort 1 (short-term, recipients R.26, R.27, R.28, and R.29; Table 1), animals underwent a planned terminal analysis at days 33–35 after transplant, with 3 of 4 recipients reaching the prede-termined experimental endpoint. The single recipient that did not reach the experimental endpoint (R.29) developed an injec-tion site infecinjec-tion with Enterococcus faecalis requiring euthanasia on day 22, at which time he had no signs of skin or liver aGVHD and had mild diarrhea consistent with possible clinical stage I GI aGVHD. In cohort 2 (long-term, recipients R.213, R.222, R.249, R.250, R.251), animals underwent extended observation in the setting of discontinuation of FR104 at day 54 after transplant (with continued sirolimus dosing) and a planned terminal anal-ysis at day 100 or later after transplant. In this extended cohort, only 2 of 5 recipients reached the predetermined experimental endpoint. These 2 animals, R.249 and R.251, underwent termi-nal atermi-nalysis on days 105 and 100, respectively, with no clinical signs of GVHD at the time of necropsy. As will be discussed in
Table 1. FR104 and FR104/sirolimus cohorts: transplant and outcomes summary
Animal ID Day of neutrophil
engraftment associated eventsTransplant- Day of event WBC count (ANC count) at terminal analysis WB chimerism at terminal analysis (%)
Day of death/
euthanasia euthanasiaReason for transcriptomic Inclusion in analysis
R.22 9 None NA 9.3(5.8) × 106/ml 99 21 Skin GVHD Yes
R.23 19 None NA 1.5(1.2) × 106/ml 100 27 Liver GVHD Yes
R.24 12 None NA 2.3(1.3) × 106/ml 100 16 Skin GVHD Yes
R.26 14 GI infection with
E. coli 30 2.9(1.4) × 10
6/ml 100 33 Timed terminal
analysis Yes
R.27 12 Giardiasis 10 4.5(3.4) × 106/ml 100 34 Timed terminal
analysis Yes
R.28 15 None NA 3.7(0.4) × 106/ml 99 34 Timed terminal
analysis Yes
R.29 22 Wound infection 10 1.3(1.0) × 106/ml 88 22 Wound infection Yes
R.213 15 Giardiasis/
unexpected death 44/66 1.98(1.15) × 10
6/ml 58 66 Unexpected death Yes
R.222 11 Hemorrhagic stroke 21 9.7(6.7) × 106/ml 100 21 Hemorrhagic stroke No
R.249 18 None NA 6.1(4.3) × 106/ml 53 105 Timed terminal
analysis Yes R.250 20 Fatal sepsis; loss of
myeloid chimerism 65 18.0(17.3) × 10 6/ml 15 72 Sepsis No R.251 10 Secondary graft failure 61 0.8(0.2) × 10 6/ml 78 100 Timed terminal analysis No
The Journal of Clinical Investigation
Rx). This is an important observation, as it suggests that break-through GVHD remained a risk in FR104/sirolimus recipients. While it is not clear whether the immune pathology noted would have eventually resulted in a clinically significant syndrome, this result suggests that longer-term dosing of FR104 may be required for optimal GVHD control.
Flow cytometric and transcriptomic evidence for synergistic control of T cell effector maturation with FR104/sirolimus. The
prevention of clinical aGVHD during ongoing FR104 exposure in the FR104/sirolimus cohort correlated closely with control of T cell proliferation, cytotoxicity, and effector function. Thus, as we have previously described (12, 53), and in agreement with the transcriptomic data discussed above, the No Rx, sirolimus, and CTLA4-Ig cohorts developed increasing expression of Ki-67 (Ki67hi) that denotes proliferation and overexpression of
gran-zyme B (GZMBveryhi) after transplant (Figure 4A). In contrast,
FR104 monoprophylaxis partially controlled Ki67 expression (but not GZMB overexpression; Figure 4A), while combination prophylaxis with FR104/sirolimus resulted in synergistic control of both proliferation and granzyme B overexpression in the blood and tissues (Figure 4, A and B). This control of proliferation result-ed in restraint of effector maturation and improvresult-ed maintenance of the naive T cell phenotype in the FR104/sirolimus cohort, most prominently in CD4+ T cells (Figure 4C), which persisted
in the FR104/sirolimus cohort for the length of FR104 exposure. However, when FR104 was discontinued, and concomitant with desaturation of CD28 occupancy on donor T cells (Figure 1, C and
E), loss of naive CD4+ T cells did occur (Figure 4, C and D). This
loss of naive cells occurred earlier for CD8+ T cells and did not
correlate with FR104 exposure (Figure 4, C and D).
The impact of FR104/sirolimus on T cell proliferation and effector maturation was also observed transcriptomically. Thus, GSEA performed on T cells purified on day 14 after transplant (or at the time of necropsy if this occurred prior to day 14) confirmed underrepresentation of gene sets involved in the control of cell proliferation and in the control of antigen response and overrepre-sentation of gene sets associated with the naive T cell phenotype in the FR104/sirolimus cohort compared with both the FR104 and sirolimus cohorts (Figure 4E). The complete list of gene sets over- and underrepresented in the day 14 FR104/sirolimus cohort is shown in Supplemental Table 2.
Previous reports have suggested that the control of T cell sig-naling through CD28 blockade may be mediated by coinhibitory 2B4 signaling (44). However, and consistent with the lack of effec-tor maturation in the FR104-prophylaxed cohorts (55) (Figure 4, A–E), we did not observe increased expression of individual coin-hibitory receptors (including PD-1, LAG3, 2B4, CTLA4 and TIM-3; Figure 4F) in the FR104/sirolimus cohort and, indeed, observed decreased expression of these molecules in the FR104/sirolimus versus No Rx cohorts.
Transcriptional consequences of FR104/sirolimus versus CTLA4-Ig/sirolimus for GVHD prophylaxis. T cell transcriptome analysis
allowed us to further interrogate the mechanisms underlying the control of GVHD with FR104/sirolimus and the relative impact of FR104/sirolimus on T cell signaling compared with CTLA4-Ig/ sirolimus. We first probed our data set for pathways that defined the synergistic impact of combining CD28 blockade with mTOR inhibition. To do this, we quantified the number of genes DE in the FR104, sirolimus, and FR104/sirolimus transcriptomes com-pared with those expressed in the No Rx transcriptome (Figure 5A). Gene arrays for this analysis were performed on T cells puri-fied from recipients at day 14 after transplant (or at the time of necropsy, if this occurred prior to day 14). To avoid potential con-founding associated with the secondary graft failure/loss of donor chimerism that occurred in 2 animals in the FR104/sirolimus cohort (recipients R.250 and R.251; Table 1 and discussed in detail below), we excluded the transcriptomes from these recipients from this analysis. As demonstrated in Figure 5A, T cells purified from the FR104/sirolimus cohort demonstrated a distinct gene expression landscape in comparison with the No Rx, sirolimus, and FR104 cohorts. Thus, as shown in this figure and Supplemen-tal Tables 1 and 4, using an absolute fold change cutoff of greater than 1.4, there were no DE genes in the FR104 monoprophylaxis versus No Rx comparison and only 32 DE genes in the sirolimus monoprophylaxis versus No Rx comparison. In striking contradis-tinction, there were 2,162 DE genes in the FR104/sirolimus versus No Rx comparison. Importantly, of these 2,162 transcripts, 2,139 (99%) were uniquely affected by combination prophylaxis, sug-gesting deep synergy between the 2 agents. Next, we performed a similar DE gene analysis comparing the CTLA4-Ig/sirolimus, sirolimus, and CTLA4-Ig transcriptomes to No Rx (as before, gene arrays were performed on day 14 or at the time of necropsy if it occurred earlier than day 14). As shown in Figure 5A, again using an absolute fold change cutoff of greater than 1.4, there were no
Figure 4. Impact of FR104 and FR104/sirolimus on T cell proliferation and effector differentiation. (A) The percentage of Ki-67hi and GZMBveryhi
within CD4+ and CD8+ T cell populations in the No Rx (n = 11), CTLA4-Ig (n =
4), sirolimus (n = 6), FR104 (n = 3), FR104/sirolimus (n = 9), and CTLA4-Ig/sirolimus (n = 7) cohorts. Data are shown as mean ± SEM. *P < 0.05 between the indicated groups and the FR104/sirolimus cohort using the Holm-Šidák–corrected t test. (B) The percentage of Ki-67hi and GZMBveryhi
CD8+ T cells in tissues at terminal analysis in the HC (n = 3), No Rx (n = 10),
sirolimus (n = 4), FR104 (n = 3), and FR104/sirolimus (sacrificed before day 66, n = 6; or after day 66, n = 3) cohorts. Data are shown as mean ± SEM. Bars represent statistically significant differences between groups, with *P < 0.05 using the Holm-Šidák–corrected t test. (C) The relative number of CD45RA+CCR7+CD95– naive CD4+ or CD8+ T cells, normalized to the
corre-sponding pretransplant level in No Rx (n = 11), CTLA4-Ig (n = 4), sirolimus (n = 6), FR104 (n = 3), FR104/sirolimus (n = 9), and CTLA4-Ig/sirolimus (n = 7) cohorts. Data are shown as mean ± SEM. TN, naive T cells. (D) The relative number of CD45RA+CCR7+CD95– naive CD4+ or CD8+ T cells before
and after discontinuation of FR104 in FR104/sirolimus cohort recipients who survived for more than 66 days (R.249, R.250, and R.251). Each line represents a single experiment. Statistical analysis was performed using the paired Student’s t test. (E) Representative GSEA plots. The top and middle panels represent proliferation-related and antigen-dependent immune activation gene sets, respectively. These transcripts are under-represented in the FR104/sirolimus cohort on day 14 (n = 7) compared with FR104 (n = 3) and sirolimus monoprophylaxis (n = 4) cohorts at terminal analysis (FDR q < 0.05). Bottom panel represents naive T cell–related gene sets which are overrepresented in the FR104/sirolimus cohort on day 14 (n = 7) compared with FR104 (n = 3) and sirolimus monoprophylaxis (n = 4) cohorts at terminal analysis (FDR q < 0.05). (F) The relative expres-sion of LAG3, PDCD1 (encoding PD-1), CTLA4, HAVCR2 (Tim3), and CD244 (2B4) transcripts. Horizontal significance bars denote comparisons with a moderated t statistic of *P < 0.05, corrected for multiple testing using the Benjamini-Hochberg method.
The Journal of Clinical Investigation
R E S E A R C H A R T I C L E
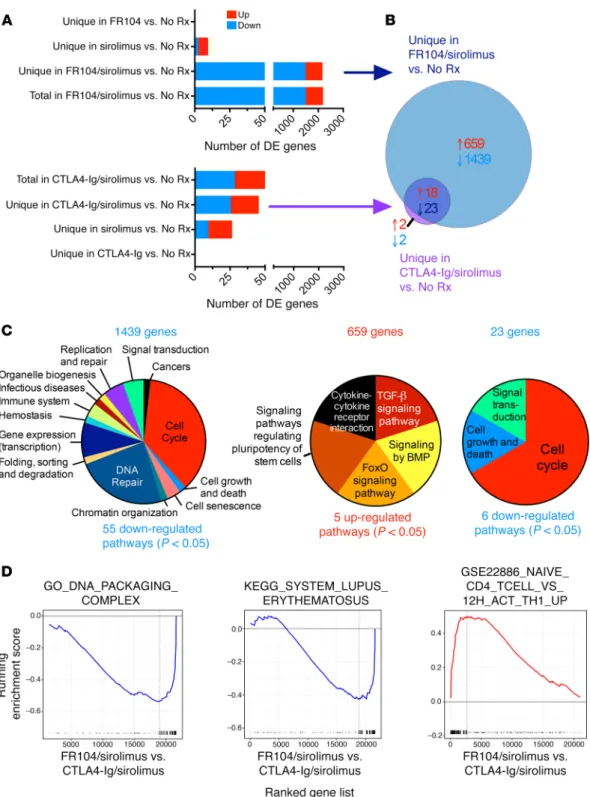
Figure 5. FR104/sirolimus synergistically modulates T cell effector and proliferative transcriptional signals dysregulated during aGVHD. (A) Top panel: number of genes DE in the FR104 (n = 3; at day 14), sirolimus (n = 4; at terminal analysis), and FR104/sirolimus (n = 6; at day 14) cohorts compared with the No Rx cohort at terminal analysis. Each bar represents the number of DE genes that are unique for each comparison. Bottom panel: number of genes DE in the CTLA4-Ig (n = 3; at day 14), sirolimus (n = 4; at terminal analysis), and CTLA4-Ig/sirolimus (n = 6; at day 14) cohorts compared with the No Rx cohort at terminal analysis. Each bar represents the number of DE genes that are unique for each comparison. (B) Venn diagram showing the number of genes uniquely DE in either the FR104/sirolimus or the CTLA4-Ig/sirolimus cohorts compared with the No Rx cohort and the degree of overlap between these 2 DE gene lists. Red text depicts the number of overrepresented transcripts; blue text depicts the number of underrepresented transcripts. (C) Functional characterization of pathways enriched in both the overrepresented and underrepresented genes, defined as shown in B: underrepresented genes unique for FR014/sirolimus vs. No Rx comparison (left); overrepresented genes unique for FR014/sirolimus vs. No Rx comparison (middle); and underrepresented genes shared between FR104/sirolimus vs. NoRx and CTLA4-Ig/sirolimus vs. NoRx comparisons (right). A complete list of the individual pathways iden-tified is found in Supplemental Table 5. Pathway identification used a Benjamini-Hochberg–corrected P value of less than 0.05. (D) Representative GSEA underrepresented plots of cell cycle– and immune response–related gene sets and an overrepresented naive T cell–related gene set in the FR104/sirolimus (n = 6) transcriptome in comparison with the CTLA4-Ig/sirolimus transcriptome (n = 6; transcriptomes derived from T cells isolated at day 28 from both cohorts) with FDR of q < 0.05.
and Supplemental Table 5). The other overrepresented pathways involved cytokine signaling (cytokine-cytokine receptor inter-action and FoxO-signaling pathway). In contrast with the high-ly focused upregulation of TGF-β signaling, we identified many more pathways uniquely downregulated in the FR104/sirolimus versus No Rx comparison. As shown in Figure 5C, these pathways belonged to the following major functional categories: (a) cell cycle (36.4% of pathways); (b) DNA repair (23.6%); (c) gene expression (transcription) (9.1%); (d) replication and repair (5.5%); (e) signal transduction (signaling by Rho GTPase; 5.5%); (f) immune system (3.6%); and (g) cell growth, senescence, and death (5.4%).
This analysis also permitted us to determine which pathways were affected by both FR104/sirolimus and CTLA4-Ig/sirolimus prophylaxis regimens compared with No Rx in or der to deter-mine the mechanisms potentially shared by these 2 GVHD-pre-vention strategies (Figure 5, B and C). This analysis revealed no upregulated and 6 downregulated pathways that were shared by both FR104/sirolimus and CTLA4-Ig/sirolimus versus No Rx. The shared downregulated pathways were predominated by those con-trolling the cell cycle (4 of 6 pathways; Figure 5C and Supplemen-tal Table 5), underscoring the shared impact of both regimens on T cell proliferation and expansion.
While both CTLA4-Ig/sirolimus and FR104/sirolimus down-regulated cell-cycle–related transcripts compared with No Rx (Figure 5, A–C), GSEA comparing these 2 cohorts identified better control of cell-cycle and immune system activation with FR104/ sirolimus compared with CTLA4-Ig/sirolimus (Figure 5D and Supplemental Table 2), with concomitant enrichment in naive T cells in the FR104/sirolimus versus CTLA4-Ig/sirolimus compar-ison (Figure 5D and Supplemental Table 2). These transcription-al results provide important mechanistic associations with the improved control of GVHD documented with FR104/sirolimus versus CTLA4-Ig/sirolimus (Figure 2).
To most rigorously define the transcriptional hallmarks of FR104/sirolimus versus CTLA4-Ig/sirolimus, we applied unsu-pervised weighted gene correlation network analysis (WGCNA) (57, 58) to construct a gene coexpression network from our data set, using the transcriptomes from the FR104/sirolimus (n = 6) DE genes in the CTLA4-Ig monoprophylaxis versus No Rx
com-parison and the same 32 DE genes in the sirolimus monoprophy-laxis versus No Rx comparison. There were far fewer DE genes in the CTLA4-Ig/sirolimus versus No Rx comparison compared with the FR104/sirolimus versus No Rx comparison: 51 DE genes in the CTLA4-Ig/sirolimus versus No Rx comparison, with 45 genes (88%) being uniquely affected by combination CTLA4-Ig/sirolim-us prophylaxis versCTLA4-Ig/sirolim-us No Rx (Figure 5A).
To develop a deeper understanding of the pathways uniquely modified by sirolimus combined with either CD28 or CD80/86 blockade, we determined the unique transcripts that were DE in the FR104/sirolimus versus No Rx comparison compared with the CTLA4-Ig/sirolimus versus No Rx comparison. We identified 2,098 genes that were uniquely DE in the FR104/sirolimus cohort (but not in the CTLA4-Ig/sirolimus cohort) when compared with No Rx (659 transcripts were overrepresented and 1,439 were underrepresented; Figure 5B). There were many fewer transcripts uniquely DE in the CTLA4-Ig/sirolimus compared with No Rx (4 total transcripts, with 2 overrepresented and 2 underrepresent-ed in the CTLA4-Ig/sirolimus versus No Rx comparison; Figure 5B, Supplemental Table 4), with no pathways identified among these 4 transcripts. While the vast majority of DE transcripts com-pared with No Rx were unique between the FR104/sirolimus and CTLA4-Ig/sirolimus comparisons, we did identify 41 transcripts (18 overrepresented and 23 underrepresented) that were DE in both FR104/sirolimus and CTLA4-Ig/sirolimus cohorts (Figure 5B, discussed below).
Pathway analysis using DAVID (56) allowed functional annota-tion of the cellular processes represented by these DE genes, which are depicted in Figure 5C and enumerated in Supplemental Table 5. With respect to pathways uniquely perturbed in the FR104/ sirolimus cohort, we identified 5 overrepresented pathways and 55 underrepresented pathways. Of note, of the 5 overrepresented pathways uniquely identified in the FR104/sirolimus versus No Rx comparison, 2 (TGF-β signaling pathway and signaling by BMP) belonged to TGF-β/Smad-related signaling with an additional pathway (signaling pathways regulating pluripotency of stem cells) that also contained many mediators of TGF-β signaling (Figure 5C
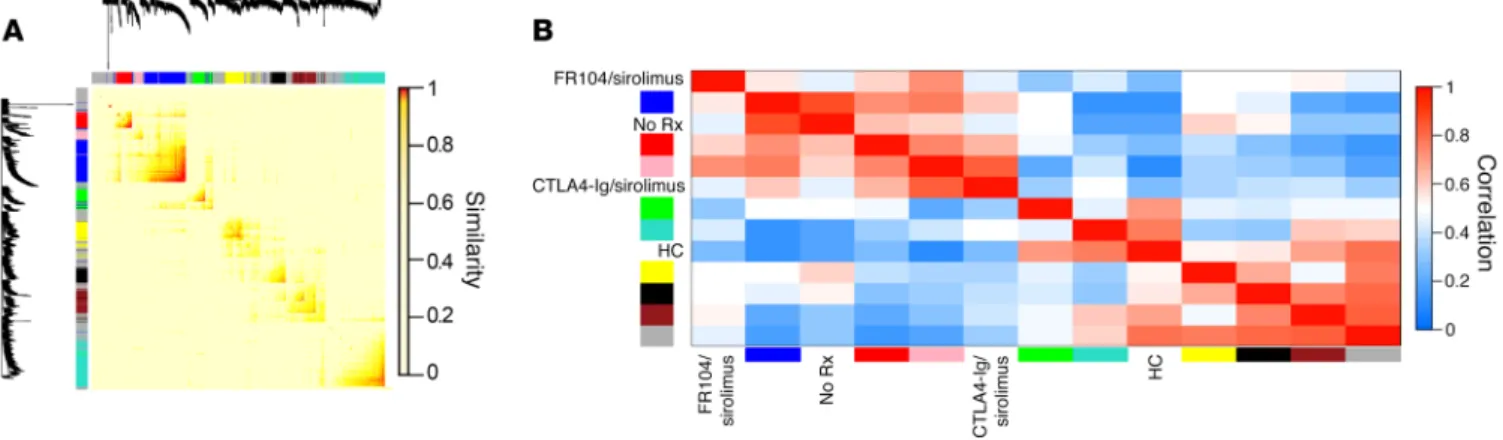
Figure 6. Unsupervised systems analysis demonstrates the unique transcriptomic profile associated with FR104/sirolimus. (A) Topological overlap matrix plot with associated hierarchical clustering tree and the resulting gene modules from a weighted network of T cell transcripts using the transcrip-tomes of the No Rx (n = 11), HC (n = 56), CTLA4-Ig/sirolimus (n = 6), and FR104/sirolimus (n = 8) cohorts. The lists of genes encapsulating each module are shown in Supplemental Table 6. (B) Eigengene adjacency heatmap showing module eigengene similarity to each of the NHP clinical cohorts.
The Journal of Clinical Investigation
R E S E A R C H A R T I C L E
tal Table 6). The module eigengenes (59) were then clustered with the 4 experimental cohorts (No Rx, HC, CTLA4-Ig/sirolimus, and FR104/sirolimus) in order to identify metamodules (Figure 6B). This analysis determined that the No Rx and CTLA4-Ig/sirolim-us cohorts were strongly clCTLA4-Ig/sirolim-ustered in a metamodule with the blue eigengene (Figure 6B) and that this blue eigengene demonstrated no correlation with either the FR104/sirolimus or the HC cohorts (Figure 6B), suggesting that it could reveal genes and pathways and CTLA4-Ig/sirolimus (n = 6) cohorts (microarray data
collect-ed at day 28) in comparison with the No Rx cohort (microarray data collected at terminal analysis, which occurred prior to day 28 for all No Rx animals; n = 11) and with HCs (n = 62). After applying WGCNA, we then performed hierarchical clustering of the matrix, thereby identifying sets of genes that met a predetermined thresh-old of coexpression, which resulted in the identification of 9 dis-crete self-assembling modules (Figure 6, A and B, and
Supplemen-Figure 7. Visualization of the blue gene module. (A) Visualization of gene coexpression network connections between the most connected genes in the blue module using Cytoscape. Shown are nodes with network connections whose topological overlap is above a threshold of 0.1. Edges with network con-nections above the threshold of 0.25 are shown. Mean expression fold change values of the FR104/sirolimus cohort versus HC for each gene are visualized using a false-color scale. Pathways were then identified using the DAVID database, using a cutoff derived from the Benjamini-Hochberg statistic. P < 0.05. In addition, 7 representative submodules containing genes from the top statistically ranking pathways (enumerated with the Reactome Database) are shown. (B) Functional distribution of all pathways enriched in the blue module. A complete list of the individual pathways identified is found in Supple-mental Table 7. Pathway identification used a Benjamini-Hochberg–corrected P value of < 0.05.
and Figure 8), and the pathways encapsulated by the blue module are enumerated in Supplemental Table 7. The resulting pathway analysis using DAVID (interrogating the Reactome, KEGG, and Biocarta databases) revealed that the blue module was enriched in multiple pathways of T cell activation and proliferation (Figure 7, A and B). These prominently included pathways associated with cell cycle and DNA repair, but also included pathways associated with the regulation of gene transcription, cellular senescence, sig-that linked the breakthrough aGVHD sig-that occurred with
CTLA4-Ig/sirolimus with the severe GVHD observed in the No Rx cohort. In contrast, the brown eigengene clustered with the FR104/siroli-mus cohort and with HCs, but not with the No Rx and CTLA4-Ig/ sirolimus cohorts (Figure 6B), suggesting that it may reveal genes associated with the T cell quiescence induced by FR104/sirolim-us. The transcripts and gene correlations identified in the blue and brown eigengenes were visualized using Cytoscape (60) (Figure 7A
Figure 8. Visualization of the brown gene module. Visualization of the gene coexpression network connections between the most connected genes in the brown module using Cytoscape. Shown are nodes with network connections whose topological overlap is above a threshold of 0.1. Edges with network con-nections above the threshold of 0.1 are shown. Mean expression fold change values of the FR104/sirolimus cohort versus HC for each gene are visualized using a false-color scale.
The Journal of Clinical Investigation
R E S E A R C H A R T I C L E
ed noticeable evidence for the impact of FR104/sirolimus on T cell proliferation and activation, it is notable that we did not iden-tify pathways associated with Tregs in this analysis. This may be due to the fact that CD4+FoxP3+
Tregs express CD28 (confirmed in this study; see Supplemental Figure 2A) and that they rely on CD28 signaling for their surviv-al and suppressive function (61). We have previously shown that the development of aGVHD in NHP is associated with a signif-icant decrease in the Treg/Tcon ratio (Figure 9A, Supplemental Figure 2B, and ref. 62), and in the current study, we observed that, consistent with the development of GVHD in the FR104 monopro-phylaxis cohort, these recipients were unable to maintain either their pretransplant numbers of Tregs or the pretransplant Treg/ Tconv ratio. Furthermore, the decay in these parameters coin-cided with the development of clinically significant GVHD (Fig-ure 9A). Importantly, while com-bination prophylaxis with FR104/ sirolimus initially preserved abso-lute Treg numbers as well as the Treg/Tconv ratio, this effect was not durable for the length of the experiment, with peripheral blood Treg counts dropping by approx-imately day 25 after transplant (Figure 9A) and with a decrease in the proportion of Tregs compared with the pretransplant level also observed in the LNs and spleens of FR104/sirolimus recip-ients (Figure 9B). The inhibitory effect on Tregs may have been due to FR104. Thus, in 2 of 3 recipients in the FR104/sirolimus cohort that survived for more than 66 days after transplant, we observed a rebound of the Treg/Tconv ratio after discontinua-tion of FR104, concomitant with the desaturadiscontinua-tion of T cell CD28 occupancy (Figure 9C), as well as a modest increase in the abso-lute number of Tregs after discontinuation of FR104 (Figure 9A). Importantly, we did not observe any negative impact of FR104 on the in vitro suppressive capacity of Tregs, as measured by the sustained ability of Tregs that were pretreated with FR104 to suppress Tconv alloproliferation in a mixed lymphocyte reaction (MLR) assay (Supplemental Figure 2, C and D).
Transplant-related mortality in the FR104/sirolimus cohort. As
noted above, while combination prophylaxis with FR104/sirolim-us was successful in preventing clinical GVHD, the regimen was not uniformly successful in supporting posttransplant survival, nal transduction, cell growth and death, hemostasis, cancer, and
immune system/immune-mediated diseases (See Supplemental Table 7 for a list of all 55 pathways enriched in this module). The results of this highly rigorous, unsupervised analysis closely mir-rored the results shown in Figure 5D, where these pathways were uniquely underrepresented in a comparison of the FR104/siroli-mus cohort versus No Rx, providing independent confirmation of the relatively stronger impact that FR104/sirolimus had on path-ways of T cell proliferation, activation, and functional maturation compared with CTLA4-Ig/sirolimus. The brown module (which was less strongly associated with FR104/sirolimus than the blue module was associated with CTLA4-Ig/sirolimus; Figure 6B) con-sisted of fewer transcripts than the blue module (318 versus 595) and did not include any annotated enriched pathways when ana-lyzed with DAVID. The complete list of genes in the brown module is shown in Supplemental Table 6.
CD28 blockade negatively affects Treg homeostasis after HCT.
While the transcriptional analysis described above
provid-Figure 9. The impact of FR104/sirolimus on Treg homeostasis after transplant. (A) The relative number (percentage of total CD4 T cells; top panel), the absolute number (middle panel), and the Treg/100 Tconv ratio, normalized to the corresponding pretransplant values (bottom panel) were tracked longitudinally by flow cytometry in the No Rx (n = 7), sirolimus (n = 6), FR104 (n = 3), FR104/sirolimus (n = 9), and CTLA4-Ig/sirolimus (n = 7) cohorts. Tregs were defined as CD3+CD4+CD25+CD127loFoxP3+; Tconv cells were defined as CD3+CD8+ and
CD3+CD4+CD25–CD127hi by flow cytometric analysis. Data are shown as mean ± SEM. The solid red threshold
line represents the Treg/100 Tconv ratio in the No Rx cohort at terminal analysis (62), with dotted lines above and below the threshold line representing the SEM interval. (B) The relative number (percentage of total CD4+
T cells) of Tregs in the peripheral (axillary and inguinal) LNs and spleen in HC animals and recipients from KY1005/sirolimus undergoing terminal analysis before or after day 66. (C) The normalized Treg/100 Tconv ratio (left panel) and the percentage of CD28+CD4+ T cells (right panel) before (white circles) and after (black circles)
discontinuation of FR104 in FR104/sirolimus cohort recipients who survived more than 66 days after transplant (R.249, R.250, and R.251). Each line represents a single experiment.
In order to interrogate the possible causes of the increased risk of sepsis and graft loss in the FR104/sirolimus cohort, 2 experi-ments were performed. In the first, we determined whether other immune cells also expressed CD28 in NHP and thus could have been affected by FR104 blockade. While each of 4 distinct anti-CD28 clones labeled T cells, none of the antibodies bound to the surface of B cells, NK cells, dendritic cells, monocytes, or granulo-cytes (Supplemental Figure 3A). Intracellular labeling techniques demonstrated similar results, with only 1 of 4 clones (15E8) label-ing non–T cell leukocytes at low levels after permeabilization. This labeling was likely nonspecific to CD28, however, given that it was only minimally affected by preincubation with FR104 (Sup-plemental Figure 3, A–C). In addition to the expression analyses described above, functional assays were also performed, which demonstrated that short-term preincubation with FR104 did not affect phagocytosis or the respiratory burst of granulocytes (Sup-plemental Figure 3, D and E). Together, these experiments suggest that the impact of FR104 on protective immunity was unlikely to be due to the expression of CD28 on non–T cells.
The second experiment was designed to determine other possible mechanisms of the increased risk of sepsis in transplant We observed the following posttransplant complications in both
the short-term and long-term FR104/sirolimus cohorts (Table 1): (a) 1 episode of hemorrhagic stroke associated with thrombocyto-penia (R.222) and (b) 2 episodes of infection-related death (R.29 and R.250). R.29 developed an injection-site infection that led to necropsy on day 22, and R.250 died of culture-negative sepsis on day 71 in the setting of a high WBC count (18.0 × 10⁶/ml), absolute
neutrophil count (ANC) (17.3 × 10⁶/ml), C-reactive protein (CRP)
count (44.5 mg/l). In addition to these deaths, 1 additional animal (R.213) died unexpectedly during sedation. At the time of death, R.213 had a confirmed GI infection with Giardia.
In addition to the infection-related morbidity and mortality, 2 animals in the 9-animal FR104/sirolimus cohort had signs of loss of engraftment (Figure 10, A and B). Thus, R.250 demonstrated a loss of myeloid chimerism (Figure 10A) and R.251 demonstrat-ed secondary graft failure (Figure 10, A and B). This resultdemonstrat-ed in a dichotomous impact on survival after transplant in the FR104/siro-limus cohort. While GVHD-free survival was improved compared with that in the CTLA4-Ig/sirolimus cohort (Figure 2B), combina-tion FR104/sirolimus prophylaxis did not improve overall survival compared with CTLA4-Ig/sirolimus prophylaxis (Figure 10C).
Figure 10. Transplant-associated events in the FR104/sirolimus cohort. (A) Donor chimerism in the peripheral blood, bone marrow aspirate samples, and flow cytometrically sorted peripheral blood granulocytes and T and B lymphocytes, measured by microsatellite analysis (12, 62, 84) (plotted on the left y axes) and the ANC (plotted on the right y axes) in FR104/sirolimus recipients who survived more than 50 days after transplant. (B) Kaplan-Meier plot show-ing the relative number of hematologically engrafted recipients in FR104/sirolimus (n = 9) and CTLA4-Ig/sirolimus (n = 7) cohorts. (C) Overall survival curves of FR104/sirolimus (n = 9) and CTLA4-Ig/sirolimus (n = 7) cohorts. The Kaplan-Meier product-limit method was used to calculate survival. (D) The concentra-tions of IFN-γ, IL-1RA, IL-6, and IL-12 in serum samples from recipients from the No Rx, sirolimus, FR104, and FR104/sirolimus cohorts. Each line represents a single transplant recipient. Gray boxes above the graph provide the timing of infectious transplant-related events observed in the FR104/sirolimus cohort.
The Journal of Clinical Investigation
R E S E A R C H A R T I C L E
on overall survival when compared with CTLA4-Ig/sirolimus, despite improved GVHD-free survival. While the number of recip-ients analyzed was relatively small (n = 9 total, with 5 followed long term), we did observe fatal sepsis in 2 animals, loss of donor chimerism in 1 animal, and secondary graft loss in 1 animal. These complications occurred in the setting of intact reconstitution of CD4 cells compared with autologous transplant controls, but slower reconstitution of CD8 cells (Supplemental Figure 1). Death from these clinical complications was not observed in any of the 7 animals that we have previously reported in the CTLA4-Ig/siroli-mus cohort (51). While sepsis and loss of chimerism are expected complications associated with transplant, it is also possible that they were directly affected by the impact of combined FR104/ sirolimus on T cell activation. Thus, it is well established that T cells function within an allograft to promote donor engraftment and protection against infection and that both failure to engraft and infectious complications accompany T cell depletion (74–77). The significant control of T cell activation with FR104/sirolimus may blunt these T cell functions, and indeed, previous results in murine models suggested that deficiency of CD28 increased the risk of nonengraftment after allo-HCT (39) and that intact CD28 signaling in T cells was required to mount an effective protective immune response against bacterial infections (78–80). Moreover, and further supporting the hypothesis that FR104/sirolimus-me-diated control of T cell activation may have increased the risk of infection and sepsis in this cohort, we found that FR104/sirolim-us recipients were unable to mount an appropriate (66–68) IFN-γ response to sepsis (Figure 10D). While the ability to discern a pos-itive impact on overall survival may have been limited by a lack of statistical power with the current sample size, given the combined risk of infection and engraftment failure that we encountered in the FR104/sirolimus transplants, it was not feasible to add enough additional animals to provide a more definitive evaluation of this end point. It is important to note, however, that the NHP model may have accentuated the risks of both infection-related death and graft rejection compared with what would be seen in the clinic. Thus, the ability to provide successful prophylaxis and treatment of infection is more challenging in NHP than in patients, which likely contributes to the increased risk of life-threatening sepsis in this animal model. Furthermore, the NHP transplant model employed used only total body irradiation (TBI) for pretrans-plant conditioning; thus, the risk of rejection could be mitigated in patients by augmenting the pretransplant regimen with addi-tional conditioning agents. Given the prominant control of T cell activation and GVHD that we observed, and if clinical risks were mitigated as described above, translation of this regimen would be appropriate and potentially of considerable value to transplant patients at high risk of GVHD.
The striking control of T cell activation when FR104 was com-bined with sirolimus suggests that this combinatorial strategy may be an important approach for clinical translation (81). However, the complications that were also observed in the FR104/siroli-mus cohort suggest that effectively deploying CD28 blockade in the clinic may be complex. Our results suggest that there may be considerable trade-offs associated with the comprehensive down-modulation of conventional T cell activation that occurred with FR104/sirolimus, which may impede functional engraftment if recipients exposed to FR104/sirolimus by determining the
abil-ity of these animals to mount an appropriate cytokine response during infection (Figure 10D and Supplemental Figure 4A). While cytokines classically associated with innate immune responses, including IL-1RA, IL-6, and IL-12 (63–65), were appropriately elevated in the serum during infection in the FR104/sirolimus cohort, it was notable that an infection-associated response by IFN-γ, which represents the major T cell cytokine produced during sepsis (66–68) (and which was elevated in a transplant recipient from a separate costimulatory blockade protocol who also devel-oped sepsis after allogeneic HCT; Supplemental Figure 4B), did not occur. This result is consistent with the transcriptomic analysis shown in Supplemental Figure 4C, which documented substantial control of IFN-γ production/lack of IFN-γ signaling in the FR104/ sirolimus cohort compared with the CTLA4-Ig/sirolimus cohort and suggests that inhibition of an appropriate IFN-γ response may have increased the risk of infection in the FR104/sirolimus cohort.
Discussion
Here, we provide evidence for broad synergy between CD28 blockade and mTOR inhibition in preventing GVHD and, using a systems biology approach, have determined the molecular mecha-nisms associated with disease control. Importantly, this study has also allowed us to measure the comparative impact of targeting CD28 versus CD80/86 in controlling T cell activation and pre-venting GVHD, both in single-agent experiments and in combina-tion with mTOR inhibicombina-tion.
One of the most striking findings in the current study was the depth of synergy between mTOR inhibition and CD28 blockade in controlling aGVHD. The impact was impressive, with 2,098 genes identified that were exclusively normalized in the FR104/siroli-mus cohort compared with the No Rx cohort. The other critical result of this study was the evidence for more complete control of T cell activation, proliferation, and effector maturation with CD28 blockade versus CD80/86 blockade. Two other key observations made in this study deserve special discussion, each of which has important clinical relevance. The first is the impact that CD28 blockade had on Treg reconstitution and homeostasis in the NHP GVHD model. Given the contribution that CTLA4 signaling makes to Treg function, it has long been thought that targeting CD80/86 (and thus potentially blocking signaling from both CD28 and CTLA4) would not be ideal in terms of Treg homeostasis. Howev-er, with regard to the impact that CD28 (and its blockade) has on Treg development, function, and homeostasis, the literature sup-ports complex mechanistic relationships, with evidence for both salutary and inhibitory effects of CD28 deficiency on Tregs (61, 69–73). In the experiments presented here, we provide evidence for the inhibition of Treg homeostasis in the FR104/sirolimus cohort. These results strengthen the inference that control of allo-reactivity in the FR104/sirolimus cohort occurred predominantly through the inhibition of conventional T cell activation rather than the promotion of Treg predominance.
The second critical observation concerns possible drawbacks associated with the substantial control of conventional T cell acti-vation and functional maturation that occurred in the FR104/siro-limus cohort. Thus, we observed a number of transplant-related toxicities in this cohort that resulted in a lack of a beneficial impact
Pad Software). Details of the statistical analysis used for the transcrip-tome studies are described in Supplemental Methods.
Study approval. This study was conducted in strict accordance
with USDA regulations and the recommendations in the Guide for the
Care and Use of Laboratory Animals (National Academies Press, 2011).
It was approved by the Animal Care and Use Committees (IACUC) at Emory University and at the University of Washington.
Author contributions
BKW designed and performed experiments and wrote the paper. VT designed and performed experiments and wrote the paper. SNF analyzed data. DJH performed experiments. KB performed exper-iments. AY performed experexper-iments. MB performed experexper-iments. NP performed experiments and analyzed data. HBZ performed experiments. AT performed experiments. LC performed experi-ments. CM performed experiments and analyzed data. GB ana-lyzed data and wrote the paper. JPS performed experiments and analyzed data. APM performed experiments. PS performed eximents. A Panoskaltsis-Mortari performed expereximents. ES formed experiments. KH performed experiments. A Garcia per-formed experiments. TD perper-formed experiments. BRB analyzed data and wrote the paper. BV analyzed data and wrote the paper. LSK conceived the study, analyzed data, and wrote the paper.
Acknowledgments
This work was supported by the Yerkes National Primate Research Center (base grant RR00165). The work at the Washington Nation-al Primate Research Center was partiNation-ally supported by grant P51 OD010425 from the NIH Office of Research Infrastructure Pro-grams. This work was also supported by NIH grants HL11879, HL56067, and AI 34495 (to BRB) and by NIH 2U19 AI051731, NIH 1R01 HL095791, and a Burroughs Wellcome Fund Career Award (to LSK). The authors gratefully acknowledge the veterinary and animal husbandry staff at the Yerkes National Primate Research Center and the Washington National Primate Research Center. Address correspondence to: Leslie S. Kean, 1 Blackfan Circle, Bos-ton, Massachusetts 02115, USA. Phone: 617.919.6684; Email: leslie. kean@childrens.harvard.edu.
VT, DJH, KB, and LSK’s present address: Division of Hematology/ Oncology, Boston Children’s Hospital and Department of Pedi-atric Oncology, Dana Farber Cancer Institute; Harvard Medical School, Boston, Massachusetts, USA.
PS’s present address: Regeneron Pharmaceuticals, Inc., Tarry-town, New York, USA.
used in the early peritransplant period. Nonetheless, the potency of the control of T cell activation with FR104/sirolimus suggests that it may be of use in settings characterized by refractory T cell pathophysiology, for example, in treating refractory acute or chronic GVHD. Although the current NHP model does not speak directly to either of these clinical entities, the transcriptomic evi-dence for potent downmodulation of effector T cell activation when CD28 blockade was combined with mTOR inhibition sug-gests that this combination may have efficacy in these hard-to-treat scenarios. Given the unique balance of risks and benefits that may be inherent to anti-CD28–based regimens, careful clinical investigation, with robust immunologic analysis linked to clinical outcomes, is warranted.
Methods
Experimental animals and transplant protocol. Transplants were
per-formed as previously described (12, 53), with details of conditioning regimens, immunomodulation regimens, and stem cell infusions described in Figure 1A, Table 1, and Supplemental Methods.
Flow cytometric and immunofluorescence analysis. For phenotypic
analysis and T cell sorting, multicolor flow cytometry was performed on all transplant recipients, as previously described (12). A complete descrip-tion of flow cytometry methods is found in Supplemental Methods.
Microarray and data analysis. CD3+CD20– lymphocytes were
puri-fied flow cytometrically using a FACS Jazz Cell Sorter (BD Bioscienc-es). Following T cell purification, RNA was stabilized in T cell lysates with RLT buffer (QIAGEN) and RNA was purified using the RNeasy Column Kit (QIAGEN). RNA was quantified using a Nanodrop Spec-trophotometer (Thermo Fisher Scientific) and purity confirmed with an RNA 6000 Nano Kit (Agilent). The purified RNA was sent to either the Vanderbilt Technologies for Advanced Genomics Core (Nash-ville, Tennessee, USA) or to the Oregon Health Sciences University Gene Profiling Shared Resource (Portland, Oregon, USA), where RNA quantity and quality were verified. This was followed by cDNA/cRNA synthesis and target hybridization to the GeneChip Rhesus Macaque Genome Array (Affymetrix). The resultant fluorescent signals were processed and normalized using the robust multichip averaging (RMA) method (82). The microarray was performed in 7 batches, with batches containing samples from both HCs and transplanted recipients. Details of microarray statistical analysis and full details of the computational analysis of the transcriptome are found in the Supplemental Methods. The NHP microarray data discussed in this publication were deposited in the NCBI’s Gene Expression Omnibus database (GEO GSE116070).
Statistics. Survival statistics were calculated using Kaplan-Meier
analysis. Other variables were expressed as mean ± SEM, and P val-ues less than 0.05 were considered statistically significant. Statistical analysis was performed using Prism version 6 for Mac OS X
1. Jagasia M, et al. Risk factors for acute GVHD and survival after hematopoietic cell transplantation.
Blood. 2012;119(1):296–307.
2. Lee SJ, et al. High-resolution donor-recipient HLA matching contributes to the success of unrelated donor marrow transplantation. Blood. 2007;110(13):4576–4583.
3. Shaw PJ, et al. Outcomes of pediatric bone marrow transplantation for leukemia and myel-odysplasia using matched sibling, mismatched
related, or matched unrelated donors. Blood. 2010;116(19):4007–4015.
4. Wagner JE, Thompson JS, Carter SL, Kernan NA, Unrelated Donor Marrow Transplantation Trial. Effect of graft-versus-host disease prophylaxis on 3-year disease-free survival in recipients of unrelated donor bone marrow (T-cell Depletion Trial): a multi-centre, randomised phase II-III trial. Lancet. 2005;366(9487):733–741. 5. Rizzo JD, et al. Recommended screening and
preventive practices for long-term survivors after hematopoietic cell transplantation: joint recom-mendations of the European Group for Blood and Marrow Transplantation, Center for Interna-tional Blood and Marrow Transplant Research, and the American Society for Blood and Marrow Transplantation (EBMT/CIBMTR/ASBMT).
Bone Marrow Transplant. 2006;37(3):249–261.
6. Ram R, Storb R. Pharmacologic prophylaxis regimens for acute graft-versus-host disease: