Development of a High Throughput 3D Perfused
Liver Tissue Bioreactor
by
Samuel Walker Inman
Bachelor of Science in Mechanical Engineering Georgia Institute of Technology, 2004
Submitted to the Department of Mechanical Engineering in Partial Fulfillment of the Requirements for the Degree of
MASTER OF SCIENCE IN MECHANICAL ENGINEERING at the
MASSACHUSETTS INSTITUTE OF TECHNOLOGY
February 2006 © 2006 Massachusetts All Rights Institute of Technology Reserved Signature of Author: Certified by:
Department of Mechanical Engineering January 15, 2006
Dr. Linda G. Griffith Professor Bioloaical Eneh1eering and Mechanical Engineering Thesis Supervisor Accepted By: MASSACHUSETTS INSTITUTE. OF TECHNOLOGY
JUL 1
4
2006
Dr. Lallit Anand Protessor of Mechanical Engineering Chairman, Committee for Graduate Students wDevelopment of a High Throughput 3D Perfused
Liver Tissue Bioreactor
by
Samuel Walker Inman
Submitted to the Department of Mechanical Engineering on January 15, 2006 in Partial Fulfillment of the Requirements for the Degree of Master of Science in
Mechanical Engineering
ABSTRACT
This thesis describes the development of a device designed for culturing liver tissue in a 3D perfused environment. Cells form tissue inside miniature channels of a scaffold, and the tissue is perfused with culture medium to create a culture microenvironment that has previously been described by the Griffith lab. In order to support this microenvironment, the reactor needs a pumping system, reservoirs and a controller. Previously, these have all been stand-alone components.
This work focuses on the development of a new, integrated culture system. This system integrates 12 reactor microenvironments, reservoirs and pumping systems onto a single plate with a configuration modeled after standard multi-well plates. Each of the 12 bioreactor units utilize pneumatic pumps driven by a single external controller. This design offers substantial advantages over previous systems as it is far more user-friendly and can be used in a higher throughput capacity.
The thesis describes the design and fabrication of the reactor and controller, including several models that were used during the development process. It also offers mechanical and biological characterizations of the device.
Thesis Supervisor: Linda G. Griffith
ACKNOWLEDGEMENTS
First I would like to thank Linda Griffith, my advisor, for brining me into the lab and for letting me work on this project. Thank you for support throughout my MIT experience.
I would like to thank Karel Domansky and Jim Serdy for their work throughout the
project with the design and development of the bioreactor. The original idea of a multi-well system came from Karel, and Karel developed the first prototype multi-multi-well
bioreactor. Karel, with the help of several others, also developed all of the initial, component based bioreactor systems. Jim was responsible for some of the biggest breakthroughs in the development process. Both the idea for fluidic capacitors, and the breakthroughs that made the valves work properly came from Jim. Jim, with the help of Fred Cote, also taught me how to use the CNC milling machine where all the
bioreactors were manufactured.
Thank you Megan Whittemore and Laura Vineyard for performing biological
experiments. I realize that they are hugely time consuming and there is no way I could have finished this without your help. I would also like to thank Megan for the PCR and Laura for the perfusions.
Bryan Owens and Nadeem Mazen, who shared their time as UROP students, were very helpful with mechanical characterization tests. Bryan also helped developed the 3D
CAD model and Nadeem helped develop the controller.
Thanks go to the entirety of the BPEC lab and Pfizer, including Nate Tedford, Anand Sivaraman, Ben Cosgrove, Keith Hoffmaster and Susan Glynn for advice on
requirements for the system and for helping teach me biology.
Thank you Peter Morely, Andy Gallant and the MIT Central Machine Shop for advice and help manufacturing the bioreactor and its components.
I would like to thank Dave Trumper for advice with the system design, specifically the
scaffolds and the capacitor.
Thank you MITERS for helping developing the controller.
Finally, and most importantly, I would like to thank DuPont and Pfizer for funding the project.
TABLE OF CONTENTS
ABSTRACT ... 3 ACKNOW LEDGEMENTS ... 5 TABLE OF CONTENTS ... 7 LIST OF FIGURES ... 10 LIST OF TABLES ... 15 1. INTRODUCTION ... 17 1. 1 Background ... 17 1.2 T h e L ive r ... 181.3 Previous Bioreactors and the Team Involved in this Work ... 20
2. DEVICE DESIGN ... 22 2 .1 G e n e ra l ... 2 2 2.2 Reactor Unit ... 24 2.2.1 Scaffold Assembly ... 24 2.2.2 Pumping System ... 30 2.2.3 Reactor W ell ... 40 2.3 Bioreactor Plate ... 44 2.3.1 Plate Design ... 44 2.4 Auxiliary Systems ... 50 2 .4 .1 C o n tro lle r ... 5 0 2.4.2 Pneumatic Regulation ... 55 3. FABRICATION ... 57 3. 1 Bioreactor ... 57 3.2 Scaffolds ... 59 3.3 Controller ... 60 4. MODELS ... 61 4.1 Pump Model ... 61
4.2 Static Capacitor Model ... 65
4.3 Dynamic Capacitor Model ... 72
5. MECHANICAL CHARACTERIZATION ... 76
5.2 Experim ental Setup for Flow Tests ... 77
5.3 Pumping Cham ber Volum e ... 79
5.4 Flow Consistency... 79
5.4.1 Flow Cycle Tim ing ... 80
5.4.2 Frequency... 89
5.4.3 Pneumatic Pressures ... 91
5.4.4 Head Pressures... 93
5.4.5 Flow Test After Cell Culture... 97
5.5 Mem brane Characterization... 98
6. BIOLOGICAL APPLICATIONS AND CHARACTERIZATION...100
6.1 Protocol for a Typical Experim ent ... 100
6.1.1 Preparing the Cells...100
6.1.2 Preparing the Reactor ... 101
6.1.3 Seeding Cells ... 101
6.1.4 Cell Attachment ... 102
6.1.5 Extended Culture...102
6.1.6 Controls ... 104
6.2 Other Experim ents ... 105
6.2.1 Metabolism and Induction...105
6.2.2 Variations in Culture Microenvironment...107
6.2.3 Variations in Numbers of Cells and Cell to Medium Ratios ... 113
7. RECCOM ENDATIONS FOR FUTURE W ORK ... 116
7.1 Capacitor... 116
7.1.1 Capacitor Validation ... 116
7.1.2 Capacitor Optimization ... 116
7.2 Pneum atic System ... 117
7.2.1 System Model...117 7.2.2 Quick Connectors ... 118 7.2.3 House Vacuum ... 118 7.2.4 Secondary Channels ... 118 7.3 Controller ... 119 7.4 Retaining Rings...119 7.5 Seeding Cells...120 7.5.1 Cell Isolates...120 7.5.2 Counting Spheroids ... 120 7.6 Scaffold M aterials... 121
7.7 Prim ing the Reactor ... 121
8. SUM MARY AND CO NCLUSIONS ... 124
REFERENCES ... 125
A PPENDIX ... 128
A 1 Dim ensioned Drawings for the Bioreactor ... 128
A2 Calculations for Pressure Across a Mem brane... 150
A3 Bioreactor Program and m ake file ... 151
A4 M achining code for the bioreactor... 154
A5 Tool Paths for Tapered Cuts...167
A6 Scaffold Hole Placem ent ... 169
A 7 M ask for Etching Silicon Scaffolds...170
A8 Sample Capacitance Calculation...171
A9 Dynam ic Capacitor M odel for a Round Capacitor... 172
A 10 Dynam ic Capacitor M odel for an Oblong Capacitor...175
LIST OF FIGURES
Figure 1.1: (a) A section of the liver micro-environment showing hepatocytes, lined on either side with basement membrane-like matrix (BMm), and sinusoidal endothelial cells (SC). Blood flows through the sinusoids (SIN) on either side of the
hepatocytes and bile travels through the bile canaliculi located between adjacent hepatocytes. (b) Alignment of hepatocytes to form plate like structures. Figures
were taken from Stam atoglou [15]... 19
Figure 1.2: The initial prototype bioreactor system*...20
Figure 2.1: The bioreactor system *... 22
Figure 2.2: The reactor unit includes a scaffold, a reservoir and pumping system*...23
Figure 2.3: The fluidic and pneumatic plates are screwed together to make the bioreactor. Each bioreactor contains 12 reactor units. ... 24
Figure 2.4: The scaffold assembly consists of a scaffold, a filter, a filter support, a retaining ring and a gasket ... 25
Figure 2.5: Schematic of a channel cross-section. Cells adhere to the channel walls and are perfused with medium that is pumped either up or down through the s c a ffo ld . ... 2 6 Figure 2.6: A 230 pm thick silicon scaffold with 861 0.09 mm2 channels arranged in a circula r patte rn ... . . 2 6 Figure 2.7: An assortment of scaffold designs and materials: a) silicon with 861 trapezoid channels; b) silicon with 859 hexagon channels; c) silicon with 837 square channels; d) silicon with 631 circular channels; e) Teflon with 631 drilled channels; f) polycarbonate with 631 channels; g) polycarbonate with 127 channels; h) silicon with 97 channels, other channels are blocked with a PEEK insert; i) PEEK w ith 6 1 channe ls... . . 27
Figure 2.8: The filter support keeps the filter in close contact with the scaffold and allows flow to pass through unobstructed... 29
Figure 2.9: Filter supports that prevent flow through the outer edges of scaffolds containing few er channels ... 29
Figure 2.10: Cross section of the reactor pumping system... 31
Figure 2.11: C ross-section of a valve ... 32
Figure 2.12: The pumping sequence can be run in both directions...33
Figure 2.13: Flow from the pump over one pumping cycle ... 34
Figure 2.14: The pum ping cham ber... 35
Figure 2.15: A flexible membrane can seal off a small exit to a pumping chamber ... 36
Figure 2.16: A small pneumatic channel spanning the pumping chamber ensures the complete filling of the pumping chamber with fluid when vacuum is applied ... 36
Figure 2.17: Comparison of thick and thin membranes. Thick membranes can fill the pumping chamber, changing the volume pumped per cycle and thus the flow rate.
... 3 7
Figure 2.18: The fluidic channel... 38
Figure 2.19: Capacitor components include a flow source, a capacitor and a resistor ..39 Figure 2.20: The fluidic capacitor in a) no flow, b) flow up through scaffold, and c) flow
dow n through scaffold ... 39
Figure 2.21: Flow into the capacitor from the pump (red line) compared with flow through the scaffold (blue line). This figure was generated for a 5 mm capacitor
using the dynamic capacitor model described in Chapter 4. ... 40 Figure 2.22: The reactor unit ... 41 Figure 2.23: Ridges on the reactor surface help maintain fluidic isolation of reactor units
... 4 2
Figure 2.24: Contact angle of a fluid turns flat around a corner...42 Figure 2.25: Cross section of a reactor well... 43 Figure 2.26: An insert used to remove inaccessible medium from the system...43 Figure 2.27: The bioreactor assembly consists of a reactor plate, a pumping plate, a
flexible m em brane and a lid... 44 Figure 2.28: Islands are used to isolate pumping systems of adjacent reactor units. This figure shows the pumping system for one reactor unit on the pneumatic plate. .... 45 Figure 2.29: Pneumatic lines route pressure and suction to valves and pumping
c h a m b e r ... 4 6
Figure 2.30: Two sets of pneumatic inputs allow different flows across the bioreactor. 47 Figure 2.31: A secondary channel runs along the fluidic lines underneath the pumping
m e m b ra n e . ... 4 7
Figure 2.32: Circuits comparison of pneumatic leak. The larger resistance between valves prevents a significant drop in pressure at the valve...48 Figure 2.33: Exploded view of the bioreactor showing all bioreactor materials,
manufacturing methods and quantities: a) machined polysulfone fluidic plate; b) punched polyurethane membrane; c) machined acrylic pneumatic plate; d) injection molded polystyrene lid; e) machined PEEK (polyetheretherketone) retaining ring (24); f) scaffolds are either etched silicon or micro-drilled PEEK or polycarbonate
(12); g) punched PVDF filter (24); h) machined polysulfone filter support (24); i)
silicone o-ring gasket (24); j) machined polysulfone filler (12); k) tape; I) stainless stee l screw s (14 ) ... . . 4 9
Figure 2.34: The controller with lid removed to show all components ... 51
Figure 2.35: Circuit diagram of the controller... 52
the top of the board and blue lines run underneath the board...52 Figure 2.37: The pneumatic manifold takes input from pressure and vacuum lines and
outputs to three separate lines ... 54 Figure 2.38: Bioreactor controls diagrammed for the current controller configuration ...55 Figure 2.39: Pneumatic regulators and filters ... 56
Figure 3.1: A schematic showing the tool used to create pumping chambers and valves and the to-scale depth of a pumping chamber. This figure gives perspective to the sensitivity of depth when cutting the pumping chamber. ... 58
Figure 3.2: Cross-section of a valve and the fluidic channels above it ... 59
Figure 4.1: Pressure across a membrane is used to determine radius of deflection ... 63
Figure 4.2: An oblong chamber is divided into regions when calculating average strain ... 6 4
Figure 4.3: A model of the pumping system using electronic components ... 66
Figure 4.4: Volume of fluid 'in' the capacitor... 67
Figure 4.5: Capacitance vs. pressure for capacitors with a variety of different diameters. The pressure required for flow at 1 pL/channel/minute is 0.25 kPa...68 Figure 4.6: A 10 mm diameter capacitor a) is loaded with an initial pressure and is
therefore less able to accept additional volume than capacitor b) that is initially unloaded. This figure is to scale. ... 69
Figure 4.7: Capacitance increases with capacitor diameter because a larger diameter capacitor can accept more volume with a smaller change in pressure. This figure is to s c a le ... 6 9
Figure 4.8: Flow through the scaffold as modeled by the dynamic capacitor model. The red line shows the flow pulses from the pump and the blue is flow through the
s c a ffo ld ... 7 4
Figure 5.1: The bioreactor system developed for flow tests...78 Figure 5.2: Method for measuring flow through the pump: a) a syringe is used to level
fluid in the reactor well; b) the pump is run for a set number of cycles; c) the syringe is again used to level fluid in the well; d) fluid in the syringe is recorded. ... 78
Figure 5.3: Volume of fluid ejected from the pumping chamber during a pumping cycle. The slope of this curve represents the actual rate of flow from the pump. Flow measurements were taken for both directions of the pump. ... 81
Figure 5.4: Volume of fluid that is pulled into the pumping chamber during a cycle of the pump. Flow is measured in both directions... 82
Figure 5.5: Volume of fluid that is pulled into the pumping chamber during a cycle of the pump. As positive driving pressure decreases, the pumping chamber fills sooner after vacuum is applied. a) Direction of the pump moves fluid down through the capacitor, through the pump and into the reservoir. b) Fluid is moved from the reservoir, through the pump and into the capacitor. ... 84
Figure 5.6: Volume of fluid ejected from the pumping chamber during a pumping cycle. Three positive pneumatic pressures are tested with vacuum set to 35 kPa.
Measurements were taken with flow moving from the reservoir through the pump and into the capacitor. ... . . 85 Figure 5.7: Slopes of curves for fluid exiting the pumping chamber in response to three
different positive pneumatic pressures. ... 86
Figure 5.8: Time required to switch the valves in order to fill the pumping chamber. .... 88
Figure 5.9: Time required to switch the valves in order to drain the pumping chamber. Flow was measured in both directions...88 Figure 5.10: Flow rate as a function of frequency when pneumatic controls are set to
±35 kPa. Optimized cycle times are plotted in black and cycles allowing equal
tim es for each step are plotted in red. ... 90
Figure 5.11: Pumping chamber volume in relation to actuation pressures, pumps were driven at low frequencies ... 91
Figure 5.12: Flow rates in relation to actuation pressures, pumps were driven at 15 Hz ... 9 2
Figure 5.13: Test setup for measuring flow vs. head pressure. ... 94
Figure 5.14: Head pressure curves for the pump when operated at 15 Hz with
pneumatics set to +25, 35 & ± 45 kPa. ... 94 Figure 5.15: Head pressure curves for the pump when operated at 8 Hz with
pneumatics set to +25, 35 & ± 45 kPa. ... 96
Figure 5.16: Head pressure curves for the pump when operated with an altered
pum p ing cycle ... . . 97
Figure 5.17: Experimental setup for measuring stress vs. strain in the membrane ... 99
Figure 5.18: Stress-strain curve for the membrane. This curve is normalized to unit width and the actual thickness of the membrane...99 Figure 6.1: Time-lapse pictures of cells forming tissue in the silicon scaffold. Spheroids
were allowed to aggregate for three days prior to seeding in the reactor.*...103 Figure 6.2: Gene expression data from a typical experiment, day 7 post isolation. This
chart compares collagen gel sandwich and bioreactor cultures. Expression levels are normalized to freshly isolated hepatocytes...104 Figure 6.3: Expression of 2B1 mRNA for cultures dosed with midazolam...107 Figure 6.4: A pneumatic plate with 4 sets of inputs. The pumping system on this plate is
from a n ea rlie r prototype . ... 108
Figure 6.5: Cell isolates day 1 after being seeded into the reactor...109 Figure 6.6: Gene expression levels for reactors seeded with cell isolates and reactors
seeded with cells that have aggregated into spheroids ... 110
Figure 6.8: Gene expression for cells cultured on a variety of scaffold materials. PEEK scaffolds were coated with collagen for 30 minutes (Si Coat) and for 2 hours (PC C o a t)...1 1 2
Figure 6.9: Gene expression levels for scaffolds with only 97 and 861 channels...114
Figure Al: The programmed path of the tool used to cut the fluidic channels ... 167
Figure A2: The path of the tool used taper the top of reactor and reservoir wells...167
Figure A3: The path of the tool used to taper the ledge created by the surface channel ... 1 6 8 Figure A4: Hole placement for a drilled scaffold ... 169
Figure A5: Mask for etching silicon scaffolds...170
Figure A6: Order for tightening screws ... 178
Figure A7: Connecting pneumatic lines ... 178
LIST OF TABLES
Table 4.1: Capacitances for several capacitor geometries evaluated at 0.25 kPa...70
Table 5.1: Measuring the time per delay cycle ... 77
Table 5.2: Volume of the pumping chamber measured at each reactor unit...79
Table 5.3: Flow driven by different pressures through a fluidic resistance...86
Table 5.4: Times required to complete each step of the pumping cycle, and delay values used to program the controller... 89
Table 5.5: Cycle timing for 15 Hz, 20 Hz, 25 Hz & 30 Hz pumping cycles...90
Table 5.6: Maximum head pressures against which the pump can drive consistent flows ... 9 5 Table 5.7: Average volume of medium measured at a pumping frequency of 15 Hz for a reactor unit with no scaffolds and a reactor unit with scaffolds, filters and cells ... 98
Table 6.1: Amounts of testosterone absorbed to the reactor surfaces after 1 hour of e x p o s u re ... 1 0 6 Table 6.2: Required flow patterns through the scaffold when culturing cells seeded at d iffe re n t tim e s ... 1 0 9 Table 6.3: Rates of metabolism of testosterone for previously reported systems [19] and estimated depletion of testosterone in the bioreactor plate. ... 115
1. INTRODUCTION
1.1 Background
The liver is the primary site where drugs are metabolized in vivo [1]. As such, an accurate model for the liver is a requirement for predictive data about a candidate drug.
Immense amounts of money, $800 MM, and time, 10 to 15 years are invested in bringing a new drug to market [2]. Even still, only an estimated 1 of 5,000 candidates pass clinical trials [2,3]. Of the lead candidates that are accepted for initial tests on humans, a significant number fail due to liver toxicity [4,5]. It is clear that there is an unmet need for in vitro culture systems that more accurately model biological pathways in the liver.
Drug metabolism is mediated by a set of enzymes that are difficult to maintain in culture. Metabolism that occurs through these enzymes can alter the toxic and therapeutic profile of a drug, and therefore, their in vitro maintenance in a model system is very important. Many methods exist for culturing hepatocytes [6-9], and the benefits and drawbacks to each of these methods are well documented [6-12]. In general, the most relevant assays are more complex and are less ethically acceptable.
This thesis describes the development of a high throughput bioreactor for culturing liver tissue in a three-dimensional, perfused environment. This type of environment has been shown to improve the maintenance of liver specific functions, including the activity of important enzymes involved in drug metabolism [13]. The main focus of this project is to adapt a system previously developed in this lab into a format that is suitable for usage in a high throughput capacity suitable for industrial applications, or research where multiple treatment points are needed.
This chapter provides a background on the liver and its drug metabolizing functions. Bioreactor systems that were previously developed in this lab are also
presented.
1.2 The Liver
The liver is the largest organ in the abdomen and is one of the most important organs in the body. One of the primary functions of liver is the metabolism of food after it is processed by the small intestine. Proteins, fats and carbohydrates are broken down
by the liver, converted to useable sources of energy and either secreted into the blood
or stored as glycogen or fatty acids depending upon the body's demand. The liver is also responsible for manufacturing and secreting bile, which aids in the with digestion of fats in the intestine. The liver is the primary source of albumin, which carries hormones, fatty acids and many drugs in the blood. Another essential function of liver is to filter and process ingested drugs and toxins, including ammonia, which it secretes as urea.
Liver is fed by the hepatic artery, providing a rich supply of oxygen, and by the portal vein which carries digested food directly from the small intestines. The micro-architecture of the liver, shown in Figure 1.1, is composed of parallel, one cell thick, plates of interconnected hepatocytes perfused on either side by blood. Hepatocytes, which comprise over 60% of liver mass [14], are highly polarized cells. Tight junctions between adjacent hepatocytes close off a canalicular space that transports bile in the opposite direction of blood flow. Hepatocytes are lined on either side by extracellular matrix (ECM) and by nonparenchymal cells including stellate cells, Kupffer cells and endothelial cells. The ECM, a basement membrane-like matrix, is composed of types
IV, V and VI collagen, fibronectin, laminin, heparan sulfate proteoglycan and other
matrix proteins [15, 16]. Hepatocytes express many adhesion proteins including the integrins a1p1 and a5P13, asialoglycoprotein receptors, and cell adhesion molecules.
These proteins mediate cell-cell and cell matrix attachment and are involved in signaling pathways.
bile hepatocytes hepatic canalicul L
plates
BMm asinusoids SSIN SC 000'bile canaliculi a. b.Figure 1.1: (a) A section of the liver micro-environment showing hepatocytes, lined on either side with basement membrane-like matrix (BMm), and sinusoidal endothelial cells
(SC). Blood flows through the sinusoids (SIN) on either side of the hepatocytes and bile
travels through the bile canaliculi located between adjacent hepatocytes. (b) Alignment of hepatocytes to form plate like structures. Figures were taken from Stamatoglou [15]
The liver is primarily responsible for the metabolism of xenobiotics in vivo. Xenobiotics, or chemicals that are foreign to the body, can be either man made or natural and can include pollutants, drugs, products in food, and many other substances. Because these substances are lipophilic, they are readily absorbed by the body. In order for them to be secreted, they must be converted into water-soluble chemicals. This process, known as biotransformation, is mediated by a set of enzymes that are generally categorized as either Phase I or Phase 11. Among the most difficult to maintain in vitro are a subset of the Phases I enzymes know as cytochrome P450's. These enzymes are also some of the most important, as they are involved in a very large number of biotransformation reactions [17, 18]. A more detailed description of the liver and the drug development process is provided by Sivaraman [19].
1.3 Previous Bioreactors and the Team Involved in this Work
The microenvironment where cells are cultured in the bioreactor consists of a scaffold containing an array of channels [20-22]. Each of these channels holds one unit of tissue that is perfused with culture medium at a constant rate. The total number of channels in the system is scaleable and thus reactors containing differing numbers of cells were developed. The first reactors were designed for optical interrogation of cells and thus only 40 channels were used [20, 22]. As some experiments require large numbers of cells, the initial system was scaled up and a system containing 1,000 channels was developed [23].
The high throughput aspect of the bioreactor was next assessed. A prototype system, Figure 1.2, was developed in the multi-well format that integrated 5 pneumatic pumps and scaffold systems onto the same plate [23]. A PC based controller drove the pumps in series by actuating 3 three-way pneumatic valves in sequence.
Figure 1.2: The initial prototype bioreactor system
The work described in this thesis is the result of a collaborative project between a large group of people. Dr. Karel Domansky and Jim Serdy were actively involved in all of the decisions that shaped the design of the bioreactor. Dr. Domansky developed the
prototype multi-well system as well as the initial component based bioreactor systems and thus offered a substantial amount of experience in regards to reactor design. Mr. Serdy is experienced in manufacturing and was generous with his expertise in development. Megan Whittemore was tremendously helpful with biological characterization and is responsible for all of the RT-PCR assays. Laura Vineyard was also very helpful with experiments and was responsible for all of the liver isolations. Bryan Owens helped with mechanical characterization and developed a 3D CAD model for the bioreactor. Mr. Owens also did all of the final dimensioning for the component drawings. Nadeem Mazen and the MITERs group helped develop the electronic controller.
2. DEVICE DESIGN
2.1 General
The multiwell bioreactor is a device that allows culture of cells in a perfused, three-dimensional environment. The bioreactor system, shown in Figure 2.1, consists of a bioreactor plate that is connected by three pneumatic lines to a controller. One bioreactor plate contains 12 reactor units where tissue can be cultured. Each of these reactor units are capable of holding ~ 850 thousand cells. This chapter describes the
design of the individual reactor unit, the bioreactor plate used to integrate reactor systems, and the controller.
Controller
Bioreactor Plate
reactor unit
pneumatic Ylines
Each of the reactor units, shown in Figure 2.2, include a scaffold assembly where cells are cultured, and a reservoir that holds culture medium. Medium is perfused through the scaffold using a pneumatic pump and re-circulates across a surface channel back to the reservoir. Each of the 12 reactor units are fluidically isolated and all pumps are driven pneumatically by pressure pulses sent from the controller. The frequency of the controller sets the rate of perfusion in the device. Fluidic capacitors are used to damp pulses of fluid created by the pumps.
Reactor Well & Surface Pneumatic Reservoir
Scaffold Assembly Channel Pump Well
Figure 2.2: The reactor unit includes a scaffold, a reservoir and pumping system
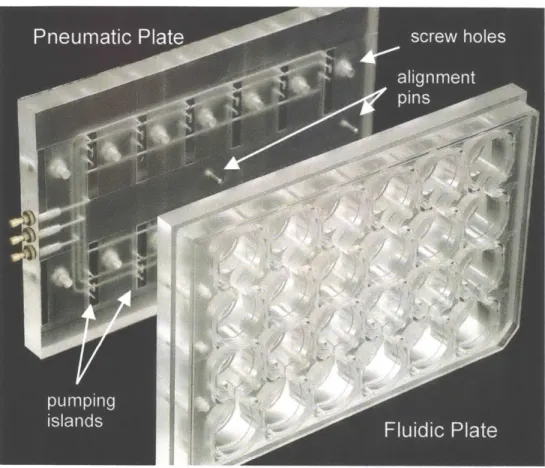
The assembled bioreactor consists of a fluidic plate, a pneumatic plate, and a membrane sandwiched between the two, Figure 2.3. The plates are held together with 14 screws and sandwich the membrane to create a fluidic seal at each reactor unit. The exterior dimensions of the bioreactor conform with the 96 well plate standard set forth
by the Society for Biomolecular Screening [25]. A lid covers the bioreactor in order to
pumping
Figure 2.3: The fluidic and pneumatic plates are screwed together to make the bioreactor. Each bioreactor contains 12 reactor units.
2.2 Reactor Unit
2.2.1 Scaffold Assembly
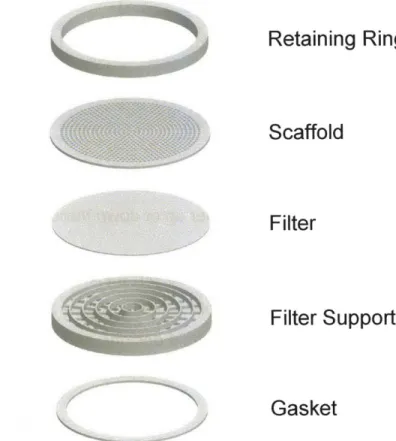
The scaffold assembly is the microenvironment where cells reside in the reactor unit. Shown in Figure 2.4, the scaffold assembly consists of a scaffold, a filter, a filter support, a retaining ring, and gasket. Dimensioned drawings are provided in Appendix
Figure 2.4: The scaffold assembly consists of a scaffold, a filter, a filter support, a retaining ring and a gasket
A scaffold is a thin disk containing channels that hold ~ 1,000 cells; these cells
comprise one unit of tissue. Cells form 3D structures by adhering to the channel walls. Each channel is perfused with culture medium that can be pumped either up or down through the scaffold. An operational diagram that highlights the geometry of the scaffold assembly and localization of cells is shown in Figure 2.5.
Upon initial seeding, a 5 pm microporous filter keeps cells from falling through the scaffold. The number of channels, and thus the number of cells, can vary from scaffold to scaffold, giving the user freedom to define a scaffold design to meet specific experimental needs.
Retaining Ring
Scaffold
Filter
Filter Support
Gasket
scaffold
filter
I
tissue
unit
filter
suDrort
Figure 2.5: Schematic of a channel cross-section. Cells adhere to the channel walls and are perfused with medium that is pumped either up or down through the scaffold.
A typical scaffold, shown in Figure 2.6, is a 230 pm thick, 14.95 mm diameter
disk with a defined pattern of channels. The scaffold is held in place along a 1 mm rim around the outer edge. A multitude of different scaffold designs and scaffold materials are possible. The channel, a 0.09 mm2 through hole corresponding to a 300 x 300 pm square, is the defining feature of the scaffold.
Figure 2.6: A 230 pm thick silicon scaffold with 861 0.09 mm2 channels arranged in a circular pattern
The scaffold shown in Figure 2.6 has 861 channels arranged in a circular pattern. There are 100 pm walls between each of the channels to provide structural support. This scaffold represents the maximum number of channels that can be placed on a scaffold of this diameter. Figure 2.7, shows a variety of other scaffold designs and materials.
Figure 2.7: An assortment of scaffold designs and materials: a) silicon with 861 trapezoid channels; b) silicon with 859 hexagon channels; c) silicon with 837 square channels; d) silicon with 631 circular channels; e) Teflon with 631 drilled channels; f) polycarbonate with 631 channels; g) polycarbonate with 127 channels; h) silicon with 97
Regardless of channel geometry, each channel has a cross sectional area of
-0.09 mm2. Some of these scaffolds are etched silicon, which allows for endless
possibilities of channel geometries. These scaffolds are very chemically resistant and can be sterilized by autoclaving. Unfortunately, they are expensive, brittle, and are not readily adaptable to manufacturing on a large scale. The other scaffolds are polymer disks with micro-drilled channels. These scaffolds are less resistant to chemicals and some cannot be autoclaved. The advantage is that they do not break, are simple to manufacture, and thus are well suited for prototyping. Biological comparisons between cells cultured in different scaffolds are discussed in Chapter 6.
A 5 pm SVPP Durapore ® filter (SVLP09050, Millipore Corp., Bedford, MA) sits
below the scaffold and keeps cells held in place upon initial seeding. The filter is the primary source of fluidic resistance in the scaffold assembly. Hydraulic permeability, the inverse of fluidic resistance, can be calculated by multiplying the published hp value,
73.5 (mL/s)/(N/mm2)/cm2 [20], by the area of the filter through which flow can pass.
This fluidic resistance below the scaffold ensures an approximate even distribution of flow throughout the scaffold, regardless of amount of tissue in each channel [20]. The fluidic resistance is also integral to the function of the capacitor, which is discussed in Section 2.2.2.2 and in Chapter 4.
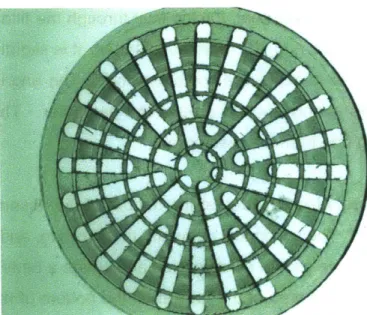
Below the filter is a rigid, 0.75 mm thick disk used for support. The filter support, shown in Figure 2.8, keeps the filter and scaffold in close contact, preventing cells from slipping between the two surfaces. It is comprised of concentric ridges on the upper portion and radial slots on the lower portion. The lower portion provides structural support to the ridges. The ridges keep the filter in place, yet do not restrict flow through any regions of the filter. In order to minimize occlusion of channels in the scaffold, the surface area of the ridges, 18 mm2, is minimal in comparison with the area of the filter,
135 mm2. Spacing between adjacent ridges is maximized while still providing ample support to the filter between ridges. Also, the ridges line up directly with the solid rings between channels on the scaffold in Figure 2.6.
Figure 2.8: The filter support keeps the filter in close contact with the scaffold and allows flow to pass through unobstructed
A modified filter support can be used in combination with scaffolds containing
fewer channels. These modified supports, shown in Figure 2.9, prevent medium from passing through the outer edges of the filter where there are no channels.
Figure 2.9: Filter supports that prevent flow through the outer edges of scaffolds containing fewer channels
A retaining ring is used to hold the scaffold assembly in place. It compresses the
gasket in order to create a fluidic seal, forcing fluid through the filter and scaffold. The retaining ring is a 1 mm thick ring, 15.1 mm in diameter. It is slightly larger than the 15 mm diameter well in order to achieve a compression fit. The ring is 2 mm tall with six
0.8 mm diameter holes evenly spaced around the perimeter. These holes facilitate
removal of the retaining ring from the reactor well.
The o-ring gasket, which resides at the bottom of the assembly, is made using very soft silicone rubber. The cylindrical geometry of the o-ring, and the low durometer,
30A, of the material improve gasket compression and create a better seal. A cylindrical
shape decreases the contact area of the gasket on the bottom of the well; thus, higher compression and a better seal are achieved with a lower holding force. This seal is crucial to reactor operation because without it, flow would bypass the scaffold and there would be no tissue perfusion.
2.2.2 Pumping System
2.2.2.1 Pump
A defining feature of this culture system is the perfusion of tissue with culture
medium. Similar to a capillary bed feeding tissue in the body, perfusion allows sufficient nutrient transport to the tissue contained in the scaffold. Without perfusion, cells in a three-dimensional environment will deplete nutrients faster than nutrients can diffuse through medium. To put this into perspective, there are ten times more cells per cm2 in a scaffold, ~ 500k, than are typically plated on flat surfaces, 50k. Flow is necessary to
support 3D culture; however, too much perfusion can impart large shear stresses that can be detrimental to cells [25, 26]. For these reasons, flow through the tissue must be precisely controlled.
Oxygen is poorly soluble in cell culture medium and is quickly metabolized by active hepatocytes [20]. As such, oxygen is the limiting factor when supplying nutrients to the tissue. A flow rate of 1 pL/channel/minute was chosen because it provides enough oxygen to the cells in a channel while keeping shear stresses below physiological values [20].
The bioreactor utilizes a pneumatic pumping system. This type of system offers several key advantages. Since the pump only requires a flexible membrane for actuation, there is no need for moving parts or electrical components within the bioreactor. Thus, the bioreactor plate is easy to assemble, inexpensive to fabricate on a large scale and could potentially be disposed of after use. Another benefit of this system is the partitioning of sterile and non-sterile surfaces. The more complicated parts, like the controller and the pneumatic pumping plate, do not come into contact with the cell culture medium and thus do not need to be sterile.
A detailed schematic of the pumping system is shown in Figure 2.10. This
system consists of two pneumatic valves, a pumping chamber, and a capacitor to damp fluid pulses. Each reactor unit has its own pumping system that is fluidically isolated from all of the other pumps on the device.
scaffold
& filter membrane
\I
I
I
capacitor pumping chamber valves
Fluid is moved through the pump by actuating the valves and pumping chamber in sequence. A valve, shown in Figure 2.11, is opened or closed when positive or negative air pressure is applied to it. Negative pressure below the valve pulls the membrane down to the surface of the pneumatic plate, filling the valve with fluid, and opening it. Fluid is pumped by opening the valve on one side, filling the pumping chamber, switching the valves and draining the pumping chamber out the other side.
fluidic
channel
Fluidic Plate
membrane
Pneumatic
Plate
pneumatic
access
Figure 2.11: Cross-section of a valve
The pumping sequence, shown in Figure 2.12, can be run in the forward or reverse direction to move fluid up or down through the scaffold. The bi-directional nature of this pump is essential because it allows downward flow during the initial stages of culture when cells are being pulled into the scaffold. Once cells have attached to the scaffold walls, the flow is reversed which prevents cell debris from clogging the filter.
1. Fill Pumping Chamber
2. Switch Valves
3. Drain Pumping Chamber
4. Switch Valves
Figure 2.12: The pumping sequence can be run in both directions
The volume pumped per cycle and cycle frequency determine the flow rate. Figure 2.13 shows the volume output of the pump through one cycle. During the first step of the cycle, there is no output from the pump. In step two, when the final valve opens, fluid is pulled into the pump and the instantaneous flow is temporarily negative. In step three, the volume of fluid in the pumping chamber is ejected from the pump. In step four, the final valve closes and the volume it drew in during step two is sent out. The volume of the pumping chamber sets the volume pumped per cycle.
1.0 -0.8 -'~2 0.6
-3
1
2
3
4
1
( 0.4 -00.2 -0.0 -- --0.2 -0 15 30 45 60 75 Time (ms)Figure 2.13: Flow from the pump over one pumping cycle
The pump can be run up to frequencies of ~ 25 Hz before the consistency of flow
begins to suffer (Chapter 5). This sets an upper bound on the flow rate for a given pumping chamber volume. In order to flow at 1 pL/channel/minute using a scaffold with the maximum number of channels, 861, the pumping chamber must be at least 0.67 pL. As will be discussed in Chapter 4, the volume of the pumping chamber should be kept at a minimum in order to mitigate the effects of fluid pulses. For this reason, a pumping chamber volume of 0.92 pL was chosen, allowing dependable flows up to 1.6 pL/channel/minute in a system with 861 channels.
Since the volume of the pumping chamber determines the flow rate, it is important that this volume is very well-defined. The surfaces in the pumping chamber set a deterministic limit on the deflection of the membrane and the membrane must be able to completely conform to these surfaces.
Figure 2.14: The pumping chamber
The pumping chamber, shown in Figure 2.14, is created by identical, shallow, radiused dimples on either side of the membrane. This radius, 1.575 mm, was set such that the membrane only needs to strain 4.2% in order to contact the top or bottom surface, requiring 12 kPa pressure difference across the membrane. These calculations are further discussed in Chapter 4 and are shown in Appendix A2. This pressure is well below the operating pressure of 35 kPa, which is set in Chapter 5. At
35 kPa, membrane stiffness will have a negligible effect on the pumping volume as the
It is also essential that no fluid is trapped between the membrane and the top of the pumping chamber when positive pressure is applied. This situation is shown in Figure 2.15 a. In order to ensure the complete draining of the pumping chamber, the fluidic channel passes through the entire length of the chamber, Figure 2.15 b.
seal
a.
volume
b.
completely
b.
/drained
Figure 2.15: A flexible membrane can seal off a small exit to a pumping chamber
Along the same lines, when suction is applied, the membrane should not seal off the vacuum source before all the air below the membrane is removed. This risk is mitigated by running a thin channel, Figure 2.16, along the length of the bottom side of the pumping chamber. Along this channel, the final membrane position cannot be deterministically set. Therefore, width of the channel, 0.4 mm, is minimized such that volume doesn't noticeably change with different operating pressures.
Figure 2.16: A small pneumatic channel spanning the pumping chamber ensures the complete filling of the pumping chamber with fluid when vacuum is applied
When the bioreactor is assembled, a fluidic seal is created by squeezing the membrane between the fluidic and pneumatic plates. If the membrane is too thick, it will
compress between the plates, but not in the pumping chamber. When this occurs, Figure 2.17, it is possible the membrane will partially or completely fill the pumping chamber. For this reason, a very thin, 25 pm, membrane was chosen.
Figure 2.17: Comparison of thick and thin membranes. Thick membranes can fill the pumping chamber, changing the volume pumped per cycle and thus the flow rate.
The valves have a different set of design characteristics. It is imperative that the valves open and close reliably, and that they completely seal when closed. The volume of the valve does not influence the pumping cycle volume; however, minimizing valve volume is important because it eliminates the negative flow patterns shown in Figure
2.13.
Valves close by creating a seal across a break in the fluidic channels. When pressure is applied below a valve, the membrane is pushed flat against the bottom of the fluidic plate. When the valve is open, both segments of the fluidic channels are connected.
The fluidic channels, shown in Figure 2.18, are rounded troughs in the bottom of the reactor plate. This trough is sealed at the bottom by the membrane. Channels break at each of the valves for 0.5 mm by sloping down into the valve area. This slope is used to eliminate dead volumes where bubbles can be trapped.
Fluidic Plate
Fluidic Channel
Membrane
Pneumatic Plate
Figure 2.18: The fluidic channel
2.2.2.2 Fluidic Capacitor
When the pumping system operates, Figure 2.13, it creates fluid pulses. Due to the nature of the pump, these pulses, although kept at a minimum, are unavoidable and may be very detrimental to the cells cultured in the bioreactor. When cells are placed in the reactor these pulses cause the cells to visibly shake in the scaffold preventing cell adhesion. A fluidic capacitor is used in order to damp out the flow pulses created by the
pump.
A capacitor effectively converts a volume-driven flow to a pressure-driven flow.
The requirements for an effective capacitor are shown in Figure 2.19, and include a fluidic resistance and a closed fluid volume that can increase and decrease depending on fluid pressure. The fluidic resistance is set such that when a pulse of fluid enters the capacitor region it is more likely to fill the capacitor than pass immediately through the resistor. As the capacitor fills, the pressure increases. Over time, fluid bleeds through the resistor and drains the capacitor, lowering the pressure and making it again ready to absorb flow pulses.
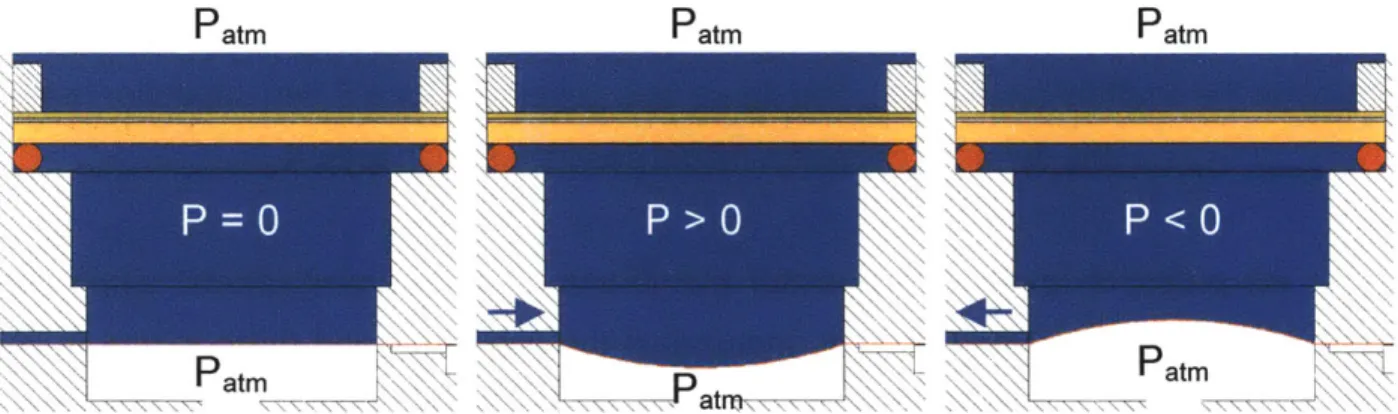
In the reactor unit, the filter in the scaffold assembly supplies fluidic resistance. The capacitor, shown in Figure 2.20, is made by allowing the membrane to bulge up and down in response to positive and negative fluid pressures. The capacitor is located between the pump and the scaffold assembly and damps flow pulses both when the
pump sends fluid up through the scaffold and when fluid is pulled down through the scaffold to the pump. There is no capacitor on the far side of the pump.
Fluidic
Inrut
RsI neOutrput
Deformable Chamber
(Caracitor)
Figure 2.19: Capacitor components include a flow source, a capacitor and a resistor
Patm Patm Patm
Patmat
- 1 at
Figure 2.20: The fluidic capacitor in a) no flow, b) flow up through scaffold, and c) flow down through scaffold
When a pulse of fluid is sent from the pump into the capacitor the increased capacitor volume deflects the capacitor membrane and causes pressure to rise under the scaffold. Flow volume has been converted to a fluidic pressure. As a result of increased pressure, fluid flows through the scaffold and the capacitor deflates. When fluid flows in the reverse direction, from the scaffold into the pump, pressure below the
scaffold is less than atmospheric and the capacitor membrane deflects upwards.
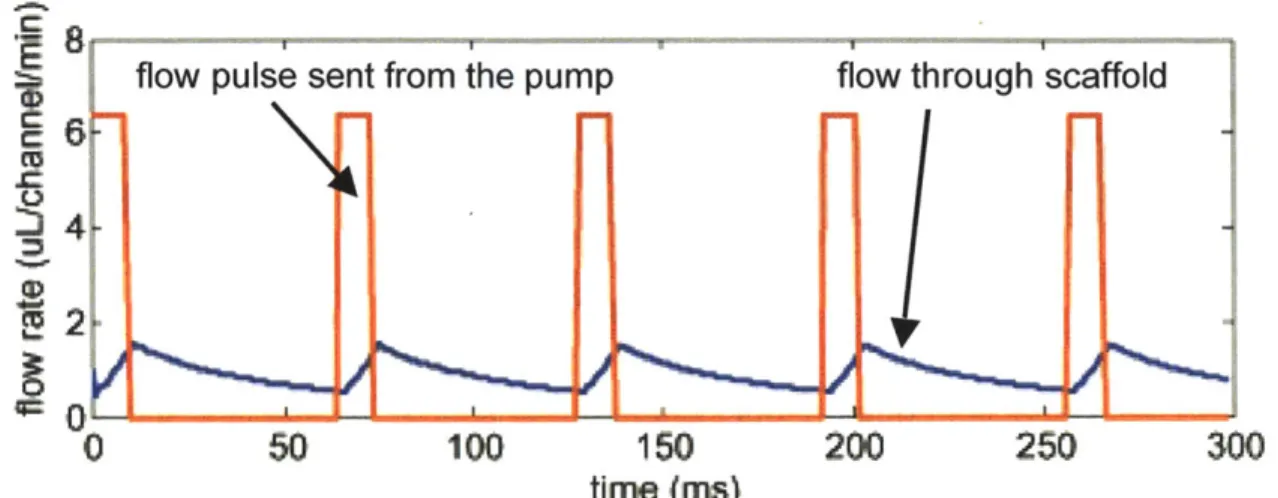
Figure 2.21 compares flow through the scaffold when a capacitor is used, to flow without a capacitor. Without a capacitor, all of the flow through the scaffold occurs during only one of the four cycles of the pump, Figure 2.14. With a properly balanced
capacitor, flow continuously occurs throughout the duration of the pumping cycle. This removes sharp pulses in the flow and brings the maximum flow rate and shear stress closer to the average flow. Chapter 4 goes into more detail on capacitor operation.
flow pulse sent from the pump flow through scaffold
:4,
2
No
o 50 100 150 200 250 300
time (rns)
Figure 2.21: Flow into the capacitor from the pump (red line) compared with flow through the scaffold (blue line). This figure was generated for a 5 mm capacitor using
the dynamic capacitor model described in Chapter 4.
Air pressure under the capacitor membrane is kept at atmospheric using vent ports. There is a vent port directly underneath the capacitor, and there is one in line with the channel. The second vent port helps bleed of any pressure leak that arises from the pumping system pneumatics. Since the bottom of the pneumatic plate is covered in order to seal the pneumatic lines, the openings to atmosphere are routed to the interface between plates.
2.2.3 Reactor Well
One reactor unit, shown in Figure 2.22, consists of two wells connected at the top
by a surface channel and at the bottom by the pump. Medium circulates between these
two wells and is perfused through tissue in the scaffold. Both wells are 12 mm deep and the total volume of medium held in the reactor unit can range between 1.75 and 3.5 mL with an optimal operating volume of 3 mL. Since some of that medium resides
below the scaffold, 1 mL, typically only 2 mL are accessible. The fluid surface of the reactor is open to atmosphere allowing oxygen exchange.
Reservoir Well
surface
Reactor Well
channel
ridges
meniscus
extraction eliminating
pockets edge
Figure 2.22: The reactor unit
The scaffold assembly sits in the 15 mm diameter reactor well and is accessible from above. A filter is used in the reservoir well. Unlike the filter under the scaffold, this filter can be replaced during the culture without disrupting the cells. This filter collects cell debris before it can get trapped on the filter under the scaffold. The reservoir well also contains a filter support, retaining ring and gasket.
Extraction pockets on either side of both wells are used to access the components in the reactor. These components can be inserted or removed from one
reactor without disturbing the other reactor units on a plate.
The surface channel, shown in Figure 2.22, curves smoothly from the reservoir into the reactor well. This curve facilitates priming of the channel. The narrow entrance
on the reactor side helps prevent the scaffold assembly from hanging up on the ledge created at the bottom of the channel.
There are 2 mm tall ridges that line each reactor and the outside of the device. These ridges, shown in Figure 2.23, prevent spillage of fluid from one reactor to an adjacent reactor and help maintain fluidic isolation of reactors across the device.
Ridges
Figure 2.23: Ridges on the reactor surface help maintain fluidic isolation of reactor units
3.5 mm below the top of the ridges there is a ledge that can be used as target
mark for the fluid level. It can also be used to level the fluid above the scaffold assembly, eliminating the meniscus. Without a meniscus there is no optical distortion and the cells are much easier to view. When fluid is filled to the proper height, the contact angle, a, will travel around the corner of the ledge until it becomes horizontal. This phenomenon is shown in Figure 2.24.
SR
Figure
2
ll
oSharp
Corner
Each reactor well is tapered at the top in order to facilitate loading of the scaffold assembly into the reactor. There is also a taper on the ledge created by the surface channel that serves the same purpose. Both of these tapers are shown in Figure 2.25.
ridges
meniscus
eliminating
edge
taper \e / / scaffold assemblFigure 2.25:
Cross section of a reactor well
An insert, seen in Figure 2.26, can be used to reduce the amount of inaccessible medium in the system. This insert is a solid piece of material with slots around the edge that facilitate removal of the piece from the reactor well. Medium flows through a hole in the middle of the part.
extraction slots
Figure 2.26: An insert used to remove inaccessible medium from the system insert for removing
2.3 Bioreactor Plate
2.3.1 Plate Design
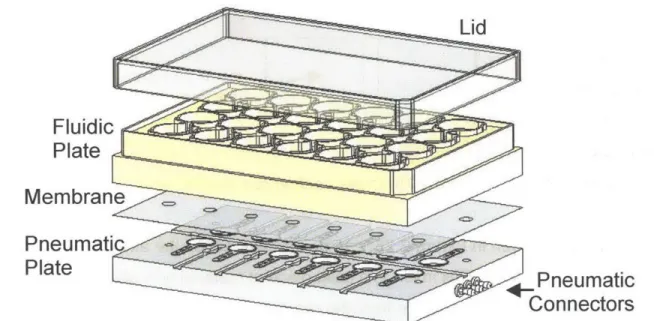
The bioreactor, seen in Figure 2.27, consists of a bottom 'pneumatic plate,' a top 'fluidic plate' and a membrane sandwiched between the two. Fully dimensioned drawings are shown in Appendix Al. The device is covered with a lid that minimizes the possibility of contamination. Three pneumatic lines connect the controller to the
bioreactor and are used to drive the pumps.
Lid
Fluidic
Plate
Membrane
Pneumatic
Plate
Pneumatic
Connectors
Figure 2.27: The bioreactor assembly consists of a reactor plate, a pumping plate, a flexible membrane and a lid
The footprint of the bioreactor plate, 127.8 x 85.5 mm, is identical to that of a standard tissue culture plate and as such, is compatible with existing fluid handling systems. Each bioreactor plate contains 12 individual reactor units. All of the reactor units have their own fluidic system, including a pump, capacitor and reservoir, and all 12 pumps are driven in parallel by one set of pneumatic inputs. Adjacent reactor wells are separated by 18 mm, double the spacing between wells in a 96 well plate. This spacing
was chosen so that a multi-channel pipette can be used with the reactor, and again, so the system is compatible with existing automation technology.
Each of the reactor units are fluidically isolated and in order to maintain that isolation, a complete fluidic seal must be made at the pumping interface of each reactor unit. The reactor and pumping plate are screwed together using 14 screws and must compress the membrane in order to create the seal.
Several important features improve this fluidic seal. First, the top of the pumping plate is recessed so that the membrane is compressed only at islands surrounding each reactor unit. Shown in Figure 2.28, each pumping system is isolated on an island where the fluidic seal is made. The use of islands reduces the area where the membrane is compressed from ~ 10,000 mm2 to
~ 700 mm2, and thus reduces the holding force between plates by more than ten fold. Since the membrane is thin, surface roughness and the flatness of the plate are also important. Achievement of these qualities is discussed in Chapter 3. Placement of the screws that hold the reactor together is also an important consideration. The screws are located along the center of the load created
by compression of the membrane under a row of reactor units. Finally, the bioreactor
plates are relatively thick, 18 mm and 9.5 mm, which minimizes bowing at the edges.
Raised Island
Load
Center
Figure 2.28: Islands are used to isolate pumping systems of adjacent reactor units. This figure shows the pumping system for one reactor unit on the pneumatic plate.
The pumps on each of the 12 reactors are driven in parallel by pressure pulses sent from the controller. Pressure is supplied through one of three pneumatic lines that connect to either all of the pumping chambers, or all of one of the two fluidic valves. These lines, shown in Figure 2.29, run along the bottom of the pumping plate. They are connected to valves on the top side of the pumping plate using through holes. Tape is
used to create a seal along these lines.
Figure 2.29: Pneumatic lines route pressure and suction to valves and pumping chamber
In typical reactor operation, the flow in all reactor units is the same. For this reason, there are only three connectors for pneumatic lines corresponding to the
pumping chamber and the two valves. Some experiments, however, call for different flows across the reactors. For these cases, a pumping plate has been made with two sets of pneumatic inputs, Figure 2.30.
Figure 2.30: Two sets of pneumatic inputs allow different flows across the bioreactor
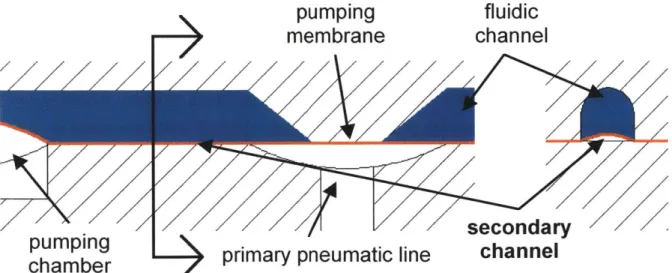
There is a secondary channel that runs along the fluidic lines. This channel, shown in Figure 2.31, causes a slight leak of pressure in the pneumatic system.
pumping
fluidic
membrane
channel
secondary
cm nprimary
pneumatic line
channel
Figure 2.31: A secondary channel runs along the fluidic lines underneath the pumping membrane.
Since the resistance along this secondary channel is very high in comparison with the resistance through primary pneumatic lines the pressure set at the controller is
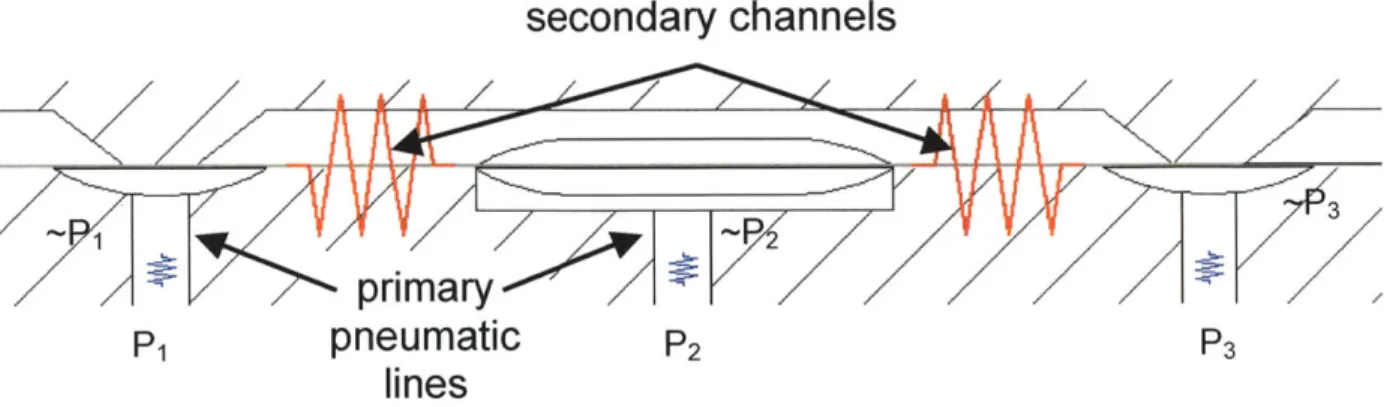
almost identical to the pressure at the valves. This is visually depicted in Figure 2.32 and is confirmed in Chapter 5. Also, because operating pressures are well above those required to move the membrane, this slight leak will not hinder the performance of the bioreactor.
secondary channels
primary
p
1pneumatic
P
2P
3lines
Figure 2.32: Circuits comparison of pneumatic leak. The larger resistance between valves prevents a significant drop in pressure at the valve
Pneumatic lines are run along the bottom of the pneumatic plate to ensure fluidic isolation of reactors. The use of a separate plane eliminates the need to create a seal at the pumping interface. If the pneumatic lines were run along this interface, a secondary channel would connect the fluidic systems of adjacent reactors.
Due to the small sizes and tolerances in the pumping system, alignment of the pumping plate with the reactor plate is important. Dowell pins are used in order to ensure proper alignment of the pumping features. A pin in the center of the pumping plate fits into a cylindrical hole in the reactor plate and is used as a position constraint.
A pin on the edge of the pumping plate fits into a slot in the reactor plate and is used to
constrain rotation.
2.3.2 Materials
Proper material selection is essential for maintaining viable cultures. All reactor components and the materials used to manufacture them are presented in Figure 2.33.
d
Figure 2.33: Exploded view of the bioreactor showing all bioreactor materials, manufacturing methods and quantities: a) machined polysulfone fluidic plate; b) punched polyurethane membrane; c) machined acrylic pneumatic plate; d) injection molded polystyrene lid; e) machined PEEK (polyetheretherketone) retaining ring (24); f)
scaffolds are either etched silicon or micro-drilled PEEK or polycarbonate (12); g) punched PVDF filter (24); h) machined polysulfone filter support (24); i) silicone o-ring
gasket (24);
j)
machined polysulfone filler (12); k) tape; I) stainless steel screws (14)Polysuflone is used for a large number of reactor parts. Polysulfone is a translucent material with an amber tint. This material has good dimensional stability and chemical resistance. It is machineable and can be injection molded. Since most reactor parts come into contact with medium, they must be sterilized before each experiment. The maximum operating temperature for polysulfone is 140 0C making it
shined through the reactor from below. In order to see the cells, all reactor parts underneath the scaffold must be translucent.
The membrane is made using polyurethane sheet, Stevens Urethane ST-625. This polyurethane is very thin, 25 pm, soft, 85A durometer, and flexible. Polyurethane is a very tear resistant material and has a long flex-life. It is made with a minimum number of additives, only 7% by weight. There is an FDA approved food grade antioxidant and an FDA approved clay. There is also some wax.
The pumping plate is made from acrylic because it machines very well, it is optically clear and it is inexpensive. This plate does not come into contact with culture medium and therefore does not need to be sterile.
2.4 Auxiliary Systems
2.4.1 Controller
The controller, shown in Figure 2.34, is used to set the rate and direction of flow in the reactor units. The controller sends pneumatic pulses to the bioreactor plate and runs the valves and pumping chamber in sequence.
power input
pneumatic
inputs
programming
header
valve status
lights
pneumatic
outputs
---
microcontroller
buttons
pneumatic
manifold
direction
indicator
lights
Figure 2.34: The controller with lid removed to show all components
2.4.1.1 Electronic System
A circuit diagram of the controller is presented in Figure 2.35. The controller is
run using an Atmel ATtiny26L. This microcontroller is powered with 5 V, has 16 1/O ports and has a built in clock set to run at 1 MHz. Eight of the ports take input from switches. Three ports output to the pneumatic valves and four are used for in circuit
6 pin header
for in circuit
programming,___
pnE
v
LEDs & transistors microcontroller
switch power supply anc
bank voltage regulatio
I
Figure 2.35: Circuit diagram of the controller
The controller is supplied with 12 V, which is regulated down to 5 V using a 1.5 A voltage regulator. The output from the voltage regulator is oscillatory so 22 pF
capacitors are used to keep the signal steady. Smaller capacitors, 0.1 pF, are used at the microcontroller to further improve the input signal. A large metal pad is used to help dissipate heat from the voltage regulator. A CAD layout of the printed circuit board is shown in Figure 2.36.
LIT-
10-Figure 2.36: A CAD drawing of the controller printed circuit board. Red lines run along the top of the board and blue lines run underneath the board.
umatic alves