HAL Id: hal-02553704
https://hal.archives-ouvertes.fr/hal-02553704
Submitted on 30 Apr 2020HAL is a multi-disciplinary open access
archive for the deposit and dissemination of sci-entific research documents, whether they are pub-lished or not. The documents may come from teaching and research institutions in France or abroad, or from public or private research centers.
L’archive ouverte pluridisciplinaire HAL, est destinée au dépôt et à la diffusion de documents scientifiques de niveau recherche, publiés ou non, émanant des établissements d’enseignement et de recherche français ou étrangers, des laboratoires publics ou privés.
Site Dependence of Tb3+ Luminescence in Double
Perovskite-Type Alkaline Earth Lanthanum Tantalates
Kazushige Ueda, Syuto Tanaka, Ryo Yamamoto, Yuhei Shimizu, Tetsuo
Honma, Florian Massuyeau, Stéphane Jobic
To cite this version:
Kazushige Ueda, Syuto Tanaka, Ryo Yamamoto, Yuhei Shimizu, Tetsuo Honma, et al.. Site De-pendence of Tb3+ Luminescence in Double Perovskite-Type Alkaline Earth Lanthanum Tanta-lates. Journal of Physical Chemistry C, American Chemical Society, 2019, 124 (1), pp.854-860. �10.1021/acs.jpcc.9b09260�. �hal-02553704�
Site dependence of Tb
3+
Luminescence in Double
Perovskite-Type Alkaline Earth Lanthanum
Tantalates
Kazushige Ueda*,†, Syuto Tanaka†, Ryo Yamamoto†, Yuhei Shimizu‡, Tetsuo Honma⊥, Florian
Massuyeau§, and Stéphane Jobic§
†Department of Materials Science, Graduate School of Engineering, Kyushu Institute of
Technology, 1-1 Sensui, Tobata, Kitakyushu 804-8550, Japan.
‡National Metrology Institute of Japan (NMIJ), National Institute of Advanced Industrial
Science and Technology (AIST), 1-1-1 Umezono, Tsukuba, Ibaraki 305-8563, Japan
⊥Japan Synchrotron Radiation Research Institute, 1-1-1 Kouto, Sayou-cho, Sayou-gun, Hyogo
679-5198, Japan
§Institut des Matériaux Jean Rouxel (IMN), Université de Nantes, CNRS, 2 rue de la
Houssinière, B.P. 32229, 44322, Nantes Cedex 3, France
ABSTRACT
Tb3+ doped alkaline earth lanthanum tantalates with the B-site-ordered double perovskite-type
structure (AA’)[BB’]O6 (namely (CaLa1-xTbx)[CaTa]O6 (CLTO:Tb3+) and Ba2[La1-xTbxTa]O6
(BLTO:Tb3+) with x =0.01, 0.10) were prepared and their Tb3+ photoluminescence (PL)
properties were examined and explained based on the occupied crystal sites (A or B sites). The location of Tb3+ activators were elucidated by analyzing powder X-ray diffraction patterns and
X-ray absorption near edge structure at the Tb LIII edge. Tb3+ ions are located at A sites in the
CLTO:Tb3+ and at B sites in the BLTO:Tb3+ as indicated in the nominal compositions. Both
CLTO:Tb3+ and BLTO:Tb3+ exhibited intense PL excitation (PLE) peaks in the UV region due to
the 4f−5d excitation for Tb3+. The PLE peak of Tb3+ in BLTO:Tb3+ showed a marked red shift
compared to that in CLTO:Tb3+ primarily because of the larger crystal field at the B sites than at
the A sites. The main PL peaks associate with the 4f−4f transitions from 5D
4 to 7F5 states are also
influenced by the crystal field and the splitting of the PL peaks for Tb3+ at B sites in BLTO:Tb3+
is more pronounced than for Tb3+ at A sites in CLTO:Tb3+. In addition, owing to a downshift of
the Tb 5d orbitals, the PL in the blue region derived from 5D
3–7FJ transitions are quenched for
1. INTRODUCTION
Green phosphors are of capital importance for white lightening sources where red, green and blue emissions are combined as primary colors of light. Many green luminescent materials exist and give rise to various applications; CeMgAl10O19:Tb3+, (La,Ce)PO4:Tb3+,
(Gd,Ce)MgB5O10:Tb3+ for trichromatic fluorescent lamps, SrGa2S4:Eu2+ and -SiAlON:Eu2+ for
white light emitting diodes (LEDs), Zn2SiO4:Mn2+, BaAl12O19:Mn2+ and (Y,Gd)BO3:Tb3+ for
plasma display panels (PDPs), ZnS:Cu+-Al3+, Y
2SiO5:Tb3+, InBO3:Tb3+ for cathode-ray tubes
(CRTs) and field-emission displays (FEDs). 1-3 Clearly, Tb3+ ions, which are widely used in the
industry, stably show green luminescence irrespective of the host lattices (HLs) because the Tb3+
green luminescence originates from intraconfigurational 4f–4f transitions and the inner 4f orbitals are less sensitive to the surroundings than the outer 5d orbitals.4,5 Therefore, an intense
photoluminescence (PL) peak at approximately 545 nm is usually observed for Tb3+ due to the
radiative 5D
4 − 7F5 transitions. To obtain the Tb3+ green luminescence, Tb3+ is frequently excited
through the 4f−5d transitions under UV irradiation. In contrast to the PL peak position for Tb3+,
the position of the PL excitation (PLE) peak for the Tb3+ 4f-5d transitions changes from one HL
to another because the energy levels of the outer 5d orbitals is much influenced by the local structure that varies with metal − ligands distances, coordination numbers, etc. 5
Recently, site-sensitive luminescence properties of Tb3+ were reported in some distorted
simple perovskite-type oxides (ABO3), namely LaScO3 and LaLuO3.6,7 Even though Tb3+ at both
A and B sites led to a similar green luminescence (5D
4 − 7FJ transitions) under UV excitation,
Tb3+ at B site gave larger splitting of the main PL peak at 545 nm (5D
4 − 7F5 transitions) than
Tb3+ at A site. In addition, Tb3+ at A site gave rise to not only the green luminescence but also a
weak blue luminescence (5D
at B site. Moreover, an intense PLE peak derived from Tb3+ 4f-5d excitation was found at much
longer wavelength for Tb3+ at B site than Tb3+ at A site. These observations suggest that new
phosphors with targeted optical properties could benefit from this site-selective doping concept not only in perovskite-type materials but also in other crystalline materials. The site-selective doping accompanying the changes of Tb3+ 4f and 5d energy levels may enable some adjustments
of excitation wavelengths, defect energy levels for electron trapping, etc. In the specific case of the simple perovskite-type structure, only few candidates for HL oxides are accessible to the large Tb3+ ionic sizes according to Goldschmidt tolerance factor. 8-10 In contrast, double
perovskite-type oxides ((AA’)[BB’]O6) appear suitable HLs to probe for further examination of
the site-sensitive Tb3+ luminescence because they are highly capable to accommodate various
lanthanide (Ln) ions at A and B sites.
Among double perovskite-type oxides,11,12 alkaline earth lanthanum tantalates were selected
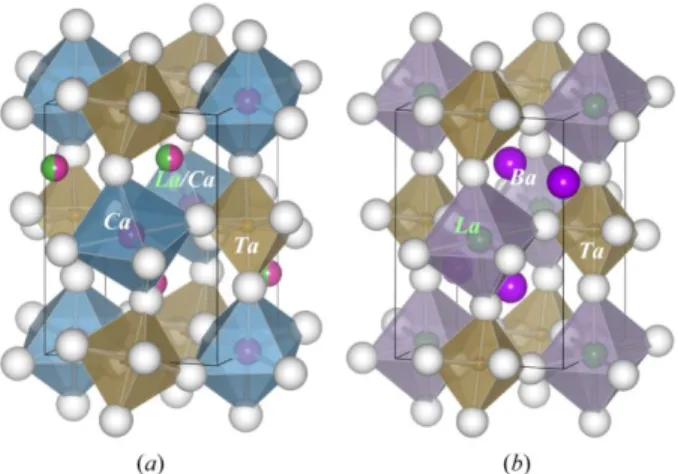
to control Tb3+-doping site. The crystal structures of the Ca
2LaTaO6 (CLTO) and Ba2LaTaO6
(BLTO) are illustrated in Figure 1. Both materials are reported to crystallize in monoclinic phase with the space group of P21/n (No. 14), although the space group of I2/m (No. 12) has been
Figure 1. Crystal structures of double perovskite-type (a) Ca2LaTaO6 and (b) Ba2LaTaO6. La
considered recently for the Ba material. 13-15 In the Ca material, the coordination number for
B-site ions is six, whereas that for A-B-site ions is regarded to be eight rather than twelve because of the large distortion from the ideal cubic structure. The important structural difference between the Ca and Ba materials lies in the atomic position of the La ions; namely, La3+ ions occupy A
sites (eight-folded coordination with site symmetry of ) in the Ca material, while they occupy 1 B sites (six-folded coordination with site symmetry of ) in the Ba material. Therefore, the 1 accurate chemical formula for CLTO and BLTO should be written as (CaLa)[CaTa]O6 and (Ba2)
[LaTa]O6, respectively. Because both materials are B-site ordered double perovskite-types, Ca2+
and Ta5+ in CLTO and La3+ and Ta5+ in BLTO alternately occupy B sites. On the contrary, Ca2+
and La3+ are randomly distributed at A sites in CLTO. Therefore, it can be easily anticipated that
Tb3+ should be located at the A sites in CLTO and at the B site in BLTO when Tb3+ are
substituted for La3+.
In this study, Tb3+ doped alkaline earth lanthanum tantalates, i.e. CLTO:Tb3+ and BLTO:Tb3+,
were synthesized via a conventional ceramic route. The location of Tb3+ activators was
determined by X-ray diffraction (XRD) and X-ray absorption near edge structures (XANES) measurements. Tb3+ luminescence properties were investigated and related to the position of the
emission center in the double perovskite-type structure. Obtained results were compared to the previous ones examined on the LaScO3:Tb3+ and LaLuO3:Tb3+ simple perovskite-type oxides.
2. EXPERIMENTS
Non-doped and Tb3+ doped CLTO and BLTO samples were prepared by solid state reaction
0.10) , respectively. The starting materials, CaCO3 or BaCO3, La2O3, Ta2O5 and Tb4O7 (Kojundo
Chemical Laboratory Co.,Ltd., 99.9%) were weighed in stoichiometric amounts. They were thoroughly mixed with ethanol in an agate mortar and dried. Powders were then pressed into disks and the disks were heated at 1300 °C for 6 h in Ar atmosphere. Disks were ground and refired at 1400 °C for 6 h in Ar atmosphere to obtain pure materials.
The phase analyses of the obtained samples were carried out by XRD measurements using an X-ray diffractometer (Rigaku, RINT-2500) with a rotational Cu target. The powder XRD patterns for the non-doped samples were calculated from reported crystal structural data using the RIETAN code.16 The crystal structures of the double perovskites were visualized using the
VESTA code.17 The XANES spectra for the Tb L
III edges were measured at the BL14B2
beamline of the SPring-8 synchrotron radiation facility. The XANES measurements by a transmission method were carried out on the samples with x = 0.10 to increase the signal/noise ratio along with reference samples. Conventional spectrofluorometers (JASCO FP-6500 and Horiba Fluorolog-3) were used to examine the PL and PLE spectra at room temperature (RT) and liquid nitrogen temperature (LNT). The decay curves of Tb3+ PL were measured to estimate
the lifetimes of radiative transitions at RT and LNT. Diffuse reflectance spectra were measured at RT using a conventional UV-VIS-NIR spectrometer (JASCO V-570) and converted to absorption spectra via a Kubelka-Munk treatment.
3. RESULTS AND DISCUSSION
The XRD patterns of (CaLa1-xTbx)[CaTa]O6 and Ba2[La1-xTbxTa]O6 (x =0.00, 0.01, 0.10)
diffraction patterns in the 2 range of 72−75 degree for CLTO and that of 59−62 degree for BLTO were magnified to highlight peak shifts consecutive to the Tb3+ substitution for La3+. The
peak shifts were observed and conspicuous for x = 0.10 in both the CLTO:Tb3+ and BLTO:Tb3+.
The peak shifts to higher angles indicate a shrinking of the lattice spacing, and the results fully agree with the fact that ionic radii for La3+ ions are larger than those for Tb3+ ions; 1.300 Å and
1.172 Å for La3+ vs. 1.180 Å and 1.063 Å for Tb3+ at eight (A) and six (B) coordinated sites,
respectively.8 Accordingly, the peak shifts evidence the insertion of Tb3+ into the HLs; Tb3+ at A
site in CLTO and at B site in BLTO.
To elucidate the Tb3+ sites in the HLs more accurately, the XANES spectra of Tb L
III edges for
the CLTO:Tb3+ and BLTO:Tb3+ were measured. They are shown in Figure 3 with those of
perovskite-type TbAlO3 and double perovskite-type Ba2TbTaO6 as references for Tb3+ at the A
and B sites, respectively.14,18 Electronic transitions from the 2p core states to the 5d empty states
Figure 2. XRD patterns of (top) (CaLa1-xTbx)[CaTa]O6 and (bottom) Ba2[La1-xTbxTa]O6
(x=0.00, 0.01, 0.10) along with patterns calculated from the structural data. Insets show magnification of some diffraction peaks at high 2 angles.
primarily occur at the LIII edges.19,20 The peak shapes provide the information not only on the
valence states of Tb ions but also on the occupied crystal sites.7,21,22
TbAlO3 shows a main single peak at 7516 eV and two additional broad peaks at 7528 and 7548
eV, while Ba2TbTaO6 exhibits a main peak at 7517 eV with a shoulder at 7514 eV and two broad
peaks at 7533 and 7555 eV. The appearance of the shoulder indicates the splitting of the main peak derived from Tb 5d orbitals in Ba2TbTaO6. The shoulder is regarded as an indicator of a
large splitting (approximately 3 eV) of the empty d states under the action of a crystal field.23,24
The large splitting is attributed to the strong crystal field around Tb3+ in Ba
2TbTaO6 because the
average Tb−O bond length at the B site in this host, dTb−O = 2.25 Å, is much shorter than that at
A sites in TbAlO3 (dTb−O = 2.46 Å).
The XANES spectra of CLTO:Tb3+ and BLTO:Tb3+ show features very similar to those of
TbAlO3 and Ba2TbTaO6, respectively. CLTO:Tb3+ displays a unique and well defined peak at
7516 eV, which is characteristic of Tb3+ at A site. In contrast, BLTO:Tb3+ exhibited a double
Figure 3. XANES spectra of Tb LIII edges for (CaLa0.90Tb0.10)[CaTa]O6 and
Ba2[La0.90Tb0.10Ta]O6 samples along with those for TbAlO3 and Ba2TbTaO6
peak with maxima at 7517 and 7514 eV, which become a fingerprint of Tb3+ at B site,
accompanying two broad peaks at 7533 and 7555 eV. The local structural analysis of Tb3+ by the
XANES measurements led to the reasonable results that are consistent with those by the XRD measurements.
PL and PLE spectra of CLTO:Tb3+ and BLTO:Tb3+ with the Tb concentration of x = 0.01 are
depicted in Figure 4 along with the absorption (Abs) spectra of non-doped HLs. Similar spectra for the Tb concentration of x = 0.10 are given in Figure S1. Although peak intensities depend on the Tb concentration and the concentration dependence in CLTO is larger than in BLTO, the fundamental spectral features are the same for x = 0.01 and x = 0.10.
Based on the non-doped CLTO absorption spectrum, the fundamental absorption is found at the wavelengths below 240 nm. The PLE spectrum of CLTO:Tb3+, which monitored the PL peak
at 550 nm, exhibits an intense peak at 247 nm, just below the absorption edge of the HL. This
Figure 4. PL and PLE spectra of (CaLa0.99Tb0.01)[CaTa]O6 (red lines) and those of
Ba2[La0.99Tb0.01Ta]O6 (blue lines) along with absorption spectra of non-doped samples.
PL, PLE, and absorption spectra are drawn with thin lines, thick lines and dashed lines, respectively.
intense peak is assigned to the allowed 4f –5d transition and matches with Tb3+ at A sites
because Tb3+ at A sites in several Tb3+ doped perovskite-type oxides usually give the 4f –5d
excitation peaks in the range from 220 to 250 nm.5-7,25-29 The crystal site of Tb3+ in this
assignment is consistent with the results obtained by XRD and XANES measurements. In the PL spectra measured under UV excitation at 247 nm, the Tb3+ luminescence is composed with two
series of transitions from 5D
3 to 7FJ (J = 6, 5, 4, 3) and from 5D4 to 7FJ states. Because the
luminescence derived from 5D
3 – 7FJ transitions shows large concentration quenching, the
emission in the blue region decreases considerably at the Tb concentration of x = 0.10 as shown in Figure S1.
Non-doped BLTO is found to show the fundamental absorption below 250 nm. The PLE spectrum of BLTO:Tb3+, which monitored the PL peak at 552 nm, exhibits two intense peaks at
242 and 308 nm. Naturally, the former can be associated to the HL excitation for Tb3+
luminescence, and the latter is to the 4f –5d excitation. Both the HL and 4f –5d excitations result in almost the same PL spectral shapes as shown in Figure S1. In comparison between
CLTO:Tb3+ and BLTO:Tb3+, the red shift of the PLE peak for the 4f –5d on-site transition in
BLTO:Tb3+ is evident. The 5d energy levels of Ln ions, as well as the red shifts, are generally
analyzed in terms of the shift of the centroid energy and the crystal field splitting of the
degenerate levels.30-34 However, the experimental separation of the two factors is not simple in
the present materials because all 4f –5d transitions cannot be observed in the optical absorption or excitation spectra due to the HL absorption. The centroid shifts for oxides (approximately 1 to 2 eV) are usually smaller than those for other compounds such as nitrides and sulfides
(approximately 2 to 3 eV) because of the smaller polarizability of oxide ions.34 On the other hand,
BLTO is as large as 3 eV, which would be larger than the centroid shift. Accordingly, the red shift of the 4f-5d excitation peak in BLTO:Tb3+ is primarily attributed to the larger crystal field
at B sites than that at A sites, which is also observed in some perovskite-type oxides such as LaScO3 and LaLuO3.6,7 The preference of B–site occupation by Tb3+ in BLTO:Tb3+ observed in
the PLE examination is consistent with the results of the XRD and XANES analyses. It is also worth noticing in the PL spectra that only the Tb3+ luminescence derived from the 5D
4 – 7FJ
transitions is observed for BLTO:Tb3+. The absence of the luminescence from the 5D 3 – 7FJ
transitions for BLTO:Tb3+ provides a marked contrast to the PL spectrum for CLTO:Tb3+. These
features are also almost the same with those found in Tb3+ doped LaScO
3 and LaLuO3 and
implying that the 5d levels of Tb3+ at B sites lie more downside in energy than those at A sites.6,7
Figure 5. Magnified PL spectra of (CaLa0.90Tb0.10)[CaTa]O6 (red lines) and those
of Ba2[La0.90Tb0.10Ta]O6 (blue lines) measured at room temperature (thin lines)
Figure 5 shows magnified PL peaks derived from the 5D
4 – 7FJ transitions in CLTO:Tb3+ and
BLTO:Tb3+ observed at RT and LNT. The excitation wavelengths (
ex) were slightly changed at
LNT according to the wavelength shifts of the PLE peak maxima. Although the 5D 4 – 7FJ
transitions are f –f intraconfigurational ones, the peak shapes are influenced by the crystal field at each crystal sites. Because the average La–O distance in CLTO and BLTO are dLa−O = 2.61 Å
and 2.43 Å, respectively, the crystal filed at B site in BLTO is considered to be larger than that at A site in CLTO. Although the main PL peaks derived from the 5D
4 – 7F5 transitions show the
crystal field splitting at RT in both CLTO and BLTO, the splitting in BLTO is larger and more complicated than that in CLTO. The distinctive peak splitting for Tb3+ at B sites is seen in not
only the 5D
4 – 7F5 transition but also 5D4 – 7F6 and 5D4 – 7F4 transitions. These features become
more distinguishable at LNT and the main peaks for the 5D
4 – 7F5 transitions clearly split into
three or more in BLTO:Tb3+.
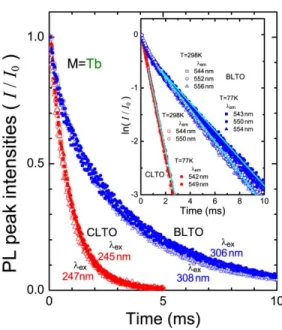
Figure 6. Decay curves of PL peak intensities for (CaLa0.90Tb0.10)[CaTa]O6 (red
symbols) and those of Ba2[La0.90Tb0.10Ta]O6 (blue symbols) observed under 4f-5d
excitation at room temperature (filled symbols) and liquid nitrogen temperature (open symbols). Each symbol corresponds to the wavelength of each PL peak.
The decay curves of the PL peaks for the 5D
4 – 7F5 transitions measured at RT and LNT are
shown in Figure 6. The main two peaks split by the crystal field in CLTO:Tb3+ and those three
peaks in BLTO:Tb3+, which are indicated in Figure 5, were examined at RT and LNT. It was
clearly found that the luminescence of Tb3+ at A site in CLTO:Tb3+ shows much faster decay
than that at B site in BLTO:Tb3+. The decay curves are almost the same between the two split
peaks in CLTO:Tb3+ and between the three split peaks in BLTO:Tb3+. These results indicate that
the 5D
4 – 7F5 transitions for Tb3+ only at A sites are responsible for the two peaks in CLTO:Tb3+
and those only at B sites are responsible for the three peaks in BLTO:Tb3+. The decay curves are
not largely dependent on temperature between at RT and LNT, but the intensities of the PL for Tb3+ in BLTO:Tb3+ are found to decay slightly slower at LNT than at RT. This may suggest that
lattice vibrations affect the Tb3+ luminescence more largely at B sites than at A sites because B–
O bonds generally have more covalent character than A–O bonds in perovskite-type oxides.35
The lifetimes () for the luminescence derived from the 5D
4 – 7F5 transitions are evaluated from
the ln(I/I0)-t plots shown in the inset presuming that the decay curves follow a single-exponential
function. The slopes in the inset give the lifetimes = 0.91 ms for CLTO:Tb3+ both at RT and
LNT and = 3.3 ms for BLTO:Tb3+ at RT and = 3.8 ms at LNT.
Although the lifetimes of Ln3+ in the double perovskite-type oxides have been reported in
some literature, there are few reports on that for Tb3+.36-38 The lifetimes of the luminescence for
Tb3+ at B sites in BLTO:Tb3+ were found to be approximately three times longer than those for
Tb3+ at A sites in CLTO:Tb3+. This feature is the same with that observed for Tb3+ at A or B sites
in orthorhombic perovskite-type LaScO3 and LaLuO3, where only B sites have an inversion
site symmetry at B sites with an inversion center is responsible for the longer lifetimes in these orthorhombic perovskite-type and monoclinic double perovskite-type oxides.
4. CONCLUSION
The Tb3+ luminescence of B-site-ordered double perovskite-type (CaLa
1-xTbx)[CaTa]O6 and
Ba2[La1-xTbxTa]O6:Tb3+ (x =0.01, 0.10) were investigated clarifying Tb3+ doping sites and its
site dependence. XRD patterns and XANES spectra confirmed that Tb3+ are located at A sites in
CLTO:Tb3+ and at B sites in BLTO:Tb3+ in accordance with the nominal compositions. In the
PLE spectra, 4f–5d excitation peaks were observed in both CLTO:Tb3+ and BLTO:Tb3+ and the
4f–5d excitation peak for Tb3+ in BLTO:Tb3+ showed a marked red shift mainly because of the
large crystal field at B sites. In the PL spectra, the splitting of the PL peaks induced by the crystal field was observed even though the PL peaks are derived from inner f-f transitions. The splitting in BLTO:Tb3+ was larger and more complicated than that in CLTO:Tb3+. Two series of
the Tb3+ luminescence derived from 5D
3 – 7FJ and 5D4 – 7FJ (J = 6, 5, 4, 3) transitions were
observed in CLTO:Tb3+, while only the Tb3+ luminescence from 5D
4 – 7FJ transitions were
observed in BLTO:Tb3+. In addition, the lifetime of Tb3+ luminescence in BLTO:Tb3+ was
noticeably longer than that in CLTO:Tb3+. These luminescence properties of Tb3+ at A and B
sites in the monoclinic double perovskite-type oxides are basically consistent with those observed in simple perovskite-type oxides with orthorhombic distortion such as LaScO3 and
ASSOCIATED CONTENT
Supporting Information.
PL spectra of the CLTO:Tb3+ and BLTO:Tb3+ samples with Tb concentration of x = 0.10.
AUTHOR INFORMATION Corresponding Author
*E-mail: kueda@che.kyutech.ac.jp. Phone: +81 93 884 3339.
ORCID Kazushige Ueda: 0000-0002-4527-799X Yuhei Shimizu: 0000-0003-0502-0484 Tetsuo Honma: 0000-0001-6617-3543 Stéphane Jobic: 0000-0002-1900-0030 Notes
The authors declare no competing financial interest.
ACKNOWLEDGMENT
This work was partly supported by the Japan Society for the Promotion of Science (JSPS) KAKENHI (Grant JP16K06724 and JP19K05004). The synchrotron radiation experiments were performed at beamline BL14B2 of SPring-8 with the approval of the Japan Synchrotron
REFERENCES
(1) Yen, W. M.; Shionoya, S.; Yamamoto, H., Eds. Phosphor Handbook; CRC Press: Boca Raton, FL, 2006.
(2) Blasse, G.; Grabmaier, B. C. Luminescent Materials; Springer-Verlag: Berlin, 1994.
(3) Ronda, C., Ed.; Luminescence;Wiley-VCH: Weinheim, 2008.
(4) Hoshina, T. Radiative transition probabilities in Tb3+ and fluorescence colors producible by
Tb3+-activated phosphors. Jpn J. Appl. Phys. 1967, 6, 1203−1211.
(5) Blasse, G.; Bril, A. Investigation of Tb3+-activated phosphors. Philips Res. Rep. 1967, 22,
481−504.
(6) Ueda, K.; Aoki, T.; Shimizu, Y.; Massuyeau, F.; Jobic, S. Luminescence and location of Gd3+ or Tb3+ ions in perovskite-type LaScO
3. Inorg. Chem. 2018, 57, 8718−8721.
(7) Ueda, K.; Tanaka, S.; Yoshino, T.; Shimizu, Y.; Honma, T. Site-selective doping and site-sensitive photoluminescence of Eu3+ and Tb3+ in perovskite-type LaLuO
3. Inorg. Chem. 2019, 58,
10890−10897.
(8) Shannon, R. D. Revised effective ionic radii and systematic studies of interatomic distances in halides and chalcogenides. Acta Crystallogr. 1976, A32, 751−767.
(9) Goldschmidt, V. M. Die gesetze der krystallochemie. Naturwissenschaften 1926, 14, 477−485.
(10) Woodward, P. M. Octahedral tilting in perovskites. II. structure stabilizing forces. Acta
(11) Vasala, S.; Karppinen, M. A2B’B”O6 perovskites: a review. Prog. Solid State Chem. 2015,
43, 1−36.
(12) Hossain, A.; Bandyopadhyay, P.; Roy, S. An overview of double perovskites A2B’B”O6
with small ions at A site: synthesis, structure and magnetic properties. J. Alloys Compd. 2018, 740, 414−427.
(13) Dutta, A.; Saha, S.; Kumari, P.; Sinha, T. P.; Shannigrahi, S. Crystal structure and x-ray photoemission spectroscopic study of A2LaMO6 [A=Ba, Ca; M=Nb, Ta]. J. Sold State Chem.
2015, 229, 296−302.
(14) Doi, Y.; Hinatsu, Y. Magnetic properties of ordered perovskites Ba2LnTaO6 (Ln = Y,
lanthanides). J. Phys.: Condens. Matter. 2001, 13, 4191−4202.
(15) Saines, P. J.; Spencer, J. R.; Kennedy, B. J.; Avdeev, M. Structures and crystal chemistry of the double perovskites Ba2LnB’O6 (Ln = lanthanide B’= Nb5+ and Ta5+): Part I. Investigation
of Ba2LnTaO6 using synchrotron X-ray and neutron powder diffraction. J. Solid State Chem.
2007, 180, 2991−3000.
(16) Izumi, F.; Momma, K. Three-dimensional visualization in powder diffraction. Solid State
Phenom. 2007, 130, 15−20.
(17) Momma, K.; Izumi, F. VESTA3 for three dimensional visualization of crystal, volumetric and morphology data. J. Appl. Crystallogr. 2011, 44, 1272−1276.
(18) Bombik, A.; Leśniewska, B.; Mayer, J.; Pacyna, A. W. Crystal structure of solid solutions REFe1−x(Al or Ga)xO3 (RE=Tb, Er, Tm) and the correlation between superexchange interaction
Fe+3–O−2–Fe+3 linkage angles and Néel temperature. J. Magn. Mag. Mater. 2003, 257, 206−219.
(19) Agarwal, B. K. X-Ray Spectroscopy; Springer-Verlag: Berlin, 1991.
(20) Bunker, G. Introduction to XAFS; Cambridge University Press : Cambridge, 2010.
(21) Saines, P. J.; Kennedy, B. J. ; Elcombe, M. M.; Harris, H. H.; Jang, L.-Y. ; Zhang, Z. Phase and valence transitions in Ba2LnSnxSb1−xO6− (Ln = Pr and Tb). J. Solid State Chem. 2008,
181, 2941−2952.
(22) Ueda, K.; Shimizu, Y.; Nagamizu, K.; Matsuo, M.; Honma, T. Luminescence and valence of Tb ions in alkaline earth stannates and zirconates examined by x-ray absorption fine structures.
Inorg. Chem. 2017, 56, 12625−12630.
(23) de Groot, F. M. F.; Fuggle, J. C.; Thole, B.T.; Sawatzky, G. A. L2,3 x-ray-absorption
edges of d0 compounds: K+, Ca2+, Sc3+, and Ti4+ in O
h (octahedral) symmetry. Phys. Rev. B 1990,
41, 928−937.
(24) Ueda, K.; Yanagi, H.; Hosono, H.; Kawazoe, H. Study on electronic structure of CaTiO3
by spectroscopic measurements and energy band calculations. J. Phys.: Condens. Matter 1999, 11, 3535−3545.
(25) Lee, J.; Lim, J.; Lim, H.; Jang, S.; Wi, S.; Chung, J.-S.; Lee, Y. S. Emission property and energy transfer in Ce3+ and Tb3+ co-doped CaHfO
(26) Gupta, S. K.; Ghosh, P. S.; Yadav, A. K.; Pathak, N.; Arya, A.; Jha, S. N.; Bhattacharyya, D. ; Kadam, R. M. Luminescence properties of SrZrO3/Tb3+ perovskite: host-dopant
energy-transfer dynamics and local structure of Tb3+. Inorg. Chem. 2016, 55, 1728−1740.
(27) Ueda, K.; Shimizu, Y.; Takashima, H. ; Massuyeau, F.; Jobic, S. Photo- and cathodoluminescence of Eu3+ or Tb3+ doped CaZrO
3 films prepared by pulsed laser deposition.
Opt. Mater. 2017, 73, 504−508.
(28) Shimizu, Y.; Ueda, K.; Inaguma, Y. Photoluminescence excitation spectra of lanthanide doped YAlO3 in vacuum ultraviolet region. Opt. Mater. 2017, 66, 327−331.
(29) Raja, A.; Annadurai, G.; Daniel, D. J.; Ramasamy, P. Synthesis, optical and thermal properties of novel Tb3+ doped RbCaF
3 fluoroperovskite phosphors. J. Alloys Compd. 2016, 683,
654−660.
(30) Dorenbos, P. A review on how lanthanide impurity levels change with chemistry and structure of inorganic compounds. ECS J. Solid State Sci. Technol. 2013, 2, R3001− R3011.
(31) Wang, S.; Song, Z.; Kong, Y.; Xia, Z.; Liu, Q. Crystal field splitting of 4fn−15d-levels of
Ce3+ and Eu2+ in nitride compounds. J. Lumin. 2018, 194, 461−466.
(32) Wang, S.; Song, Z.; Kong, Y.; Xia, Z.; Liu, Q. 5d-level centroid shift and coordination number of Ce3+ in nitride compounds. J. Lumin. 2018, 200, 35−42.
(33) Qin, X.; Liu, X.; Huang, W.; Bettinelli, M.; Liu X. Lanthanide-activated phosphors based on 4f−5d optical transitions: theoretical and experimental aspects. Chem. Rev. 2017, 117, 4488− 4527.
(34) Dorenbos, P. Ce3+ 5d-centroid shift and vacuum referred 4f-electron binding energies of
all lanthanide impurities in 150 different compounds. J. Lumin. 2013, 135, 93−104.
(35) Woodward, P. M. Octahedral tilting in perovskites. II. structure stabilizing forces. Acta
Crystallogr. 1997, B53, 44−46.
(36) Galasso, F. S.; Layden, G. K.; Flinchbaugh, D. E. Ba(B0.5Ta0.5)O3 ordered perovskite-type
compounds, possible new laser host materials. J. Chem. Phys. 1966, 44, 2703−2707.
(37) Lal, S. C.; Lalan, V.; Ganesanpotti, S. Structural characterization of B‑site ordered Ba2Ln2/3TeO6 (Ln = La, Pr, Nd, Sm, and Eu) double perovskites and probing its luminescence as
Eu3+ phosphor hosts. Inorg. Chem. 2018, 57, 6226−6236.
(38) Miniajluk, N.; Bondzior, B.; Stefańska, D.; Derén, P. Eu3+ ions in the highly symmetrical
![Figure 2. XRD patterns of (top) (CaLa 1-x Tb x )[CaTa]O 6 and (bottom) Ba 2 [La 1-x Tb x Ta]O 6 (x=0.00, 0.01, 0.10) along with patterns calculated from the structural data](https://thumb-eu.123doks.com/thumbv2/123doknet/8158278.273855/8.918.134.632.460.823/figure-xrd-patterns-cala-cata-patterns-calculated-structural.webp)
![Figure 3. XANES spectra of Tb L III edges for (CaLa 0.90 Tb 0.10 )[CaTa]O 6 and Ba 2 [La 0.90 Tb 0.10 Ta]O 6 samples along with those for TbAlO 3 and Ba 2 TbTaO 6 reference samples.](https://thumb-eu.123doks.com/thumbv2/123doknet/8158278.273855/9.918.259.745.704.971/figure-xanes-spectra-samples-tbalo-tbtao-reference-samples.webp)
![Figure 4. PL and PLE spectra of (CaLa 0.99 Tb 0.01 )[CaTa]O 6 (red lines) and those of Ba 2 [La 0.99 Tb 0.01 Ta]O 6 (blue lines) along with absorption spectra of non-doped samples](https://thumb-eu.123doks.com/thumbv2/123doknet/8158278.273855/10.918.116.648.657.967/figure-spectra-cala-cata-lines-absorption-spectra-samples.webp)
![Figure 5. Magnified PL spectra of (CaLa 0.90 Tb 0.10 )[CaTa]O 6 (red lines) and those of Ba 2 [La 0.90 Tb 0.10 Ta]O 6 (blue lines) measured at room temperature (thin lines) and liquid nitrogen temperature (thick lines)](https://thumb-eu.123doks.com/thumbv2/123doknet/8158278.273855/12.918.162.613.552.942/figure-magnified-spectra-measured-temperature-liquid-nitrogen-temperature.webp)