HAL Id: hal-00368690
https://hal.archives-ouvertes.fr/hal-00368690
Submitted on 17 Mar 2009
HAL is a multi-disciplinary open access
archive for the deposit and dissemination of
sci-entific research documents, whether they are
pub-lished or not. The documents may come from
teaching and research institutions in France or
abroad, or from public or private research centers.
L’archive ouverte pluridisciplinaire HAL, est
destinée au dépôt et à la diffusion de documents
scientifiques de niveau recherche, publiés ou non,
émanant des établissements d’enseignement et de
recherche français ou étrangers, des laboratoires
publics ou privés.
Motion-Blur
Sylvain Tourancheau, Borje Andrén, Kjell Brunnström, Patrick Le Callet
To cite this version:
Sylvain Tourancheau, Borje Andrén, Kjell Brunnström, Patrick Le Callet. Visual Annoyance and User
Acceptance of LCD Motion-Blur. SID International Symposium, Seminar and Exhibition, Jun 2009,
San Antonio, United States. pp.61.3. �hal-00368690�
Visual Annoyance and User Acceptance of LCD Motion-Blur
Sylvain Tourancheau
1, Börje Andrén
2, Kjell Brunnström
2, and Patrick Le Callet
11
IRCCyN, Polytech’Nantes, University of Nantes, 44300 Nantes, France
2
Video and Display Quality Lab, Acreo AB, SE-16440 Kista, Sweden
Abstract
It has been recognized for some time now that LCD displays will introduce blur when showing moving objects or moving images. Common motion-blur measurement methods permit to picture the blurred profile of an edge moving with a constant velocity. A normalized blurred edge width is then measured for several gray-to-gray transitions to give a motion-blur score of the display under test. However, these objective measurements are partly based on the behavior of the human visual system and it is an open question how well they correlate with subjective experience of observers. In this study, we develop a subjective experiment in order to assess the annoyance and the acceptance of motion-blur. Results are given and compare with measurements data.
1.
Introduction
Motion blur is still an important issue for liquid crystal displays (LCD). Recently, efforts have been done in the measurement and the characterization of this artifact, in order to obtain the blurred profile of a sharp edge (defined by its gray-to-gray transition) moving on the display under test. The profile of this edge is referred to as the blurred edge profile and its width is referred to as the blurred edge width (BEW). This is generally measured between 10% and 90% of the amplitude of blurred edge profile. It has been shown from measurements as well as from analysis that, for a given gray-to-gray transition from gray level Ni to gray level
Nj, BEW varies linearly with the velocity V [1][2][3]. As BEW is
expressed in space units and V in space over time units, the slope has a unity of time and is generally referred as the blurred edge time BET:
, , for each
i j i j i j
BEW
=
BET
⋅
V
N
→
N
(Eq. 1) These measurements will give some indication of the blurred edge profile that reaches the retina (if the effects of the optics of the eye are neglected). However, the human visual system is more complex and it needs to be further investigated when the perception of the edges will be different from the measurements or when they will be agree.The goal of this study is to know how the blur is subjectively perceived in terms of acceptance and annoyance. As it has been shown [2][3][4], the quantity of blur varies as a function of the gray-to-gray transition considered and as a function of the velocity of the moving object. Furthermore, it has been shown that the perception of LCD motion-blur varies with the contrast of the edge [5]. The blur of low contrasted edges (i.e. gray-to-gray transitions) is less perceived than the blur of high contrasted edges. Regarding these results, subjective assessment of LCD motion-blur is needed in order to determine a threshold beyond which the quantity of perceived motion-blur is not acceptable.
Only few subjective studies [6][7] have been conducted to determine such acceptability levels. They consisted in the assessment of sequences on different LCDs and the results have been compared with global motion-blur index of the displays such as MPRT. In our study, we decided to assess the motion-blur perception on three liquid crystal displays. Motion-blur has been characterized on these LCDs, for 20 gray-to-gray transitions, through temporal measurements as described by Tourancheau et al. [4]. Moreover, a psychophysical study has been conducted on these three displays in order to determine precisely the quantity of perceived blur for each transition [5].
As we measure the blurred edge width of 20 transitions, we choose to assess specific stimuli in which gray-to-gray transitions were controlled. Thus, we designed some synthetic sequences with gray objects moving on gray backgrounds, along with some sequences with scrolling texts on both uniform backgrounds and natural pictures. Some natural panoramic pictures have been assessed too. For each sequence, observers have to decide if the blur in the sequence is acceptable or not and are then asked to give a quality score (on a five-grade impairment scale). This would permit to explore the motion-blur perception, and to link visual annoyance and user acceptance with both physical measurements and psychophysical evaluation that have been done before. Experiments have been led at IRCCyN (France) for two displays, and at Acreo AB (Sweden) for the third one, with the same conditions and procedure. One of the goals of this study has been to help TCO Development to find a suitable requirement for motion blur.
In the following, the subjective assessment is described in Section 2. Results are given in Section 3 and discussed in Section 4.
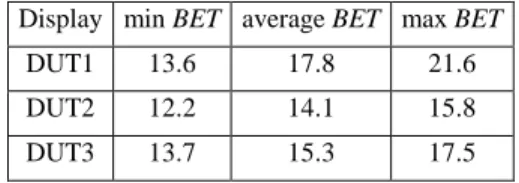
Table 1: Minimum, maximum, and average values of BET (in ms) for the three displays under test.
Display min BET average BET max BET DUT1 13.6 17.8 21.6 DUT2 12.2 14.1 15.8 DUT3 13.7 15.3 17.5
2.
Description of the Experiment
2.1
Displays under test
Stimuli were presented on three liquid crystal displays: • DUT1: 26”, 1920 x 1200@60Hz
• DUT2: 30”, 2560 x 1600@60Hz • DUT3: 37”, 1920 x 1080@60Hz
Blurred edge time (BET) has been measured on each display for the 20 gray-to-gray transitions between gray levels 0, 63, 127, 191, and 255. Measurements have been done according to the temporal method described in a previous work [4]. The minimum, maximum, and average values of BET are given in Table 1.
2.2
Viewing conditions
Experiments were performed in a psychophysics test room, with a surrounding illumination of 20 lux and a D65 chromaticity on the walls. Stimuli were generated in Matlab using the PsychToolbox. All stimuli were presented in an area of 1920 x 1080 pixels at a refresh rate of 60 Hz. On displays with a larger resolution, the sequence was displayed on the center of the screen and the borders of the screen were filled with a mean luminance Lmean
corresponding to the geometric mean of the maximum and minimum luminance of the display, Lmean = sqrt(LminLmax).
The viewing distance was adjusted in such a way that one pixel subtended 1.5 minute of arc of visual angle. In other words, the video sequence subtended an area of 48 x 27 visual degrees in the observer’s visual field. This corresponded to a viewing distance of 2.08H, with H is the height of the picture (1080 pixels). Thus, stimuli had the same size on the retina whatever display which was tested.
2.3
Stimuli
24 stimuli were presented to the observers; they can be classified in three different experiment:
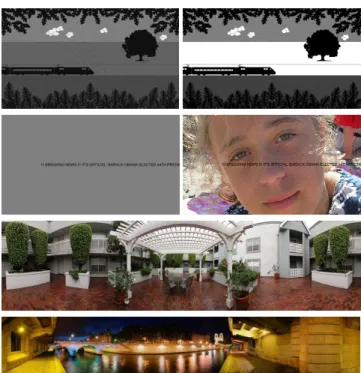
• Train experiment: 10 stimuli representing a synthetic train moving from left to right. Gray levels of train and background were varied from one stimulus to another. The height of the train was set to 2°.
• Text experiment: 10 stimuli representing a text scrolling from right to left. Text was white or black and background was either a uniform area or a natural picture. The text was upper-case and its size has been set to 0.4° which is the average size of scrolling text in news channels.
• Picture experiment: 4 natural panoramic pictures consisting in scenes shot in a 360° angle, these pictures were made scrolling continuously.
Examples of stimuli are given in Figure 1. In these 24 stimuli, the object of interest (train, text, or the whole picture) was moving at a constant speed. 8 speeds were tested: 2, 4, 6, 8, 10, 12, 14, and 16 pixels per frame (resp. 3, 6, 9, 12, 15, 18, 21, and 24 degrees per second). Finally, 192 sequences were assessed by observers. The experiment was split in two sessions with 96 sequences each. The average length of each session was about 20 minutes.
2.4
Procedure
In each session, the observers assessed the quality of 96 sequences: 40 sequences with stimuli Train, 40 sequences with stimuli Text and 16 sequences with stimuli Picture. These 96 sequences were presented in a random order which was different for each observer.
After a sequence had been viewed by an observer, he/she was asked to decide if the blur in the sequence was acceptable or not. Then, he/she was also asked to rate the sequence according to a five-grade impairment scale:
5 - Not Perceptible
4 - Perceptible but not annoying
3 - Slightly annoying 2 - Annoying 1 - Very annoying
Observers had the possibility to replay the sequence as many times as they wanted.
Figure 1: Examples of stimuli used in the experiment. First row: Train experiment (synthetic train), second row: Text experiment (scrolling text), two last rows: Picture experiment
(panoramic scenes).
2.5
Subjects
DUT1 and DUT3 have been tested at IRCCyN. 21 observers have assessed motion-blur on both, 11 observers only on DUT1 and 9 only on DUT3. This led to a total of 32 observers on DUT1 and 30 on DUT3 with an overlap of around two-thirds. Among the 21 observers that have assessed motion-blur on both DUT1 and DUT3, 11 have seen DUT1 first and 10 have seen DUT3 first. DUT2 have been tested at Acreo. 32 observers participated in the experiment.
All subjects possessed normal or corrected-to-normal vision (visual acuity of 0.9 or better on both eyes). They were familiar with the procedure after the training sessions, the results of which have not been considered. All observers have participated in two sessions. Half of them started with one session whereas the other half started with the second session.
A rejection process has been done independently for each stimuli. The linear correlation between each observer’s results and the mean results was computed and the observer who obtain the lower correlation coefficient was rejected if the coefficient was lower than 0.8. Then the mean results were recalculated and the process was repeated until all observers’ results are correlated to the mean results with a coefficient higher than or equal to 0.8.
synthetic train, 1.5 for stimuli with scrolling text, and 1.7 for panoramic pictures. In all cases, more than 25 observers were kept for each stimulus.
3.
Results
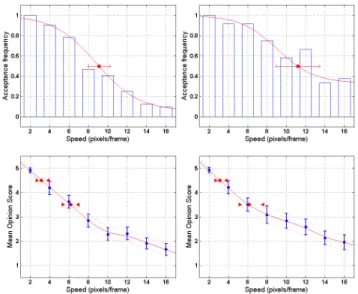
For each of the 24 stimuli, we obtained the acceptance frequency and the mean opinion score (MOS) as a function of the speed. Examples of results are given in Figure 2 with 95% confidence intervals for the MOS. For each stimulus, three thresholds can be computed:
• ThPerc: threshold of perception, i.e. the value for which MOS=4.5 (the stimulus goes from not perceptible to perceptible)
• ThAnnoy: threshold of annoyance, i.e. the value for which MOS=3.5 (the stimulus goes from not annoying to slightly annoying)
• ThAccept: threshold of acceptance, i.e. the value for which the acceptance frequency is 0.5
These three thresholds are represented by red dots in Figure 2. They have been computed by the use of a fitting model on the subjective results. A logistic function has been used for acceptance and a spline has been used for the mean opinion score. Confidence interval of ThAccept is obtained from the fitting since this value is a parameter of the logistic function. For ThPerc and ThAnnoy, we made a fitting on the values of the confidence intervals of subjective data to obtain some bounds on the thresholds values. These bounds are represented by red triangles on Figure 2 (bottom row).
Figure 2: Examples of results for two stimuli. Acceptance frequency (top) and Mean Opinion Score (bottom) for Picture Experiment with Seine picture (left) and for Train Experiment with black train on a white background (right) as
a function of motion speed.
In a previous work [5], it has been shown that observers are less sensitive to motion-blur for low-contrast transitions than for high-contrast transitions. Here, no particular tendency has been found
regarding the confidence intervals of the thresholds. Even for the Train Experiment, in which the gray-to-gray transitions were exactly known, the threshold of acceptance was not higher on low contrast as it could have been expected.
For this reason, we decided in this paper to only consider the average thresholds of each experiment. For each display, these speed values have been converted to blur values according to the measurements performed on the display. For synthetic stimuli, we took the mean between the BET of the rising transition and the BET of the falling transition considered, and for natural pictures we took the mean of all BET values. The blur value has been computed using Equation 1; results are presented in Table 2.
Table 2: Average threshold values for each display and each experiment. These values are blurred edge width (BEW)
values, expressed in minutes of arc.
DUT1 DUT2 DUT3 ThPerc 5.3 4.0 4.4 ThAnnoy. 10.9 8.4 9.3 Train Exp. (av. of 10) ThAccept. 19.3 12.2 16.5 ThPerc. 4.1 3.6 4.1 ThAnnoy. 7.1 6.6 7.1 Text Exp. (av. of 10) ThAccept. 9.8 8.7 9.6 ThPerc. 4.3 3.7 4.4 ThAnnoy. 7.9 7.2 8.1 Picture Exp. (av. of 4) ThAccept. 12.6 10.3 12.4 Results of the train experiment were those with the most important variability intra-observers, particularly for the threshold of acceptance. When asked, some observers explained that for this synthetic sequence motion-blur added naturalness and was acceptable even for high speed, whereas some other observers decided it was not acceptable anymore once it was perceptible. For the two other experiments, results were really more stable. The most obvious evidence of this is the very close thresholds for DUT1 and DUT3 for which the pools of observers were the same at more than 65%.
For the three experiments, it can be noticed than threshold values were always lower on DUT2. This might be due to the difference of observers, and also to the fact that DUT2 were tested at Acreo (Sweden), when DUT1 and DUT3 were tested at IRCCyN-IVC (France). Despite of a lot of care, some small differences in viewing conditions could have happened. It might also be a display related difference, but this was not statistically significant.
4.
Discussion
The experiment shows, see Table 2, that on average the blur was not perceived if its width was less than about 4.2 arc min = 0.07 deg. All three experiments were in agreement with this threshold, which was expected since it is a level where the blur becomes perceivable.
The annoyance threshold and the acceptance threshold were different for the three experiments. The train experiment had the highest threshold, then the picture experiment, and the text experiment showed the lowest values. It is interesting to notice that despite of variability between results, this tendency was always respected. For the text experiment, observers may have
based their judgment of acceptance on the readability of the text, this could explain why this experiment obtained the lowest acceptance thresholds.
The threshold of acceptance was always higher than the threshold of annoyance. This means that observers can accept a slight annoyance due to motion-blur. On average, the threshold of acceptance corresponded to a MOS of 2.6. This value was found to be stable over the three experiments and the three displays. As depicted in Table 2, the average threshold of acceptance for the blur width 12’ = 0.20 deg. In other words, blur was globally not acceptable if it was higher than 0.20 deg. According to Yoshida et al. [8] 10 deg/s is a typical speed limit for movies where there is no camera blur introduced: i.e. for motion speed less than 10 deg/s, observers are not expecting to see blur. According to Equation 1, the BET value of the display must be less than 20 ms for the display to not introduce blur.
Concerning scrolling text on TV, the mean speed is 13.8 deg/s according to Yoshida et al. [8]. The results of the text experiment shows that the average acceptance threshold for this type of content is BEW = 9.4’ = 0.157 deg. This means that BET must be less than 11 ms in order to display scrolling text with an acceptable quantity of blur. Subjects are more sensitive to blur in the text case according the experiment.
Finally, it has been reported that the maximum speed present in TV signal is around 30deg/s (except few cases). In order to be sure to not introduce blur at all, a perfect display would have a
BET value < 6.66 ms. However, these high speeds are not very
common and generally brief in time.
According to these typical speeds values, this would give the following design guidelines concerning LCD motion-blur:
• Acceptable display: BET < 20 ms
• Good display : BET < 11 ms
• Excellent display : BET < 6.6 ms
The discussion is still open concerning the way to compute a global BET value of the display. VESA Flat Panel Display Measurements document [9] recommends to take the average BET value of 42 transitions between 7 gray levels perceptually equidistant from one to another. However, according to our previous work [5], we would recommend to weight BET measurements according to the contrast/dynamic of the tested transitions, since motion-blur is less perceived on low-contrast edges than on high-contrast edges. In accordance with these latter results, a sharpness metric of moving edge has been described by Teunissen and Heynderickx [10] taking in account the contrast of the edge.
Conclusion
In this study, the visual annoyance and the user acceptance of LCD motion-blur has been assessed through subjective experiments. 44 sequences have been tested, with 8 different motion speeds. Stimuli were of three types: synthetic stimuli using measured gray-to-gray transitions, scrolling text sequences and natural scenes. These experiment have permitted to define three thresholds corresponding to the speeds for which blur becomes respectively perceptible, annoying and not acceptable anymore. From the motion-blur measurements performed on the three DUT, it has been possible to convert these thresholds in blur quantities
expressed in visual angles. These values have permitted to give some design guidelines concerning LCD motion-blur, based on the statistical characteristics of TV signal in terms of motion speeds.
Acknowledgements
The authors would like to thank Romuald Pépion and Romain Cousseau who helped to conduct the experiments, as well as all the subjects who participated to the experiments.
The support from TCO Development, Intertek Semko and VINNOVA (The Swedish Governmental Agency for Innovation Systems) is hereby also gratefully acknowledged.
References
[1] X. Feng. “LCD motion-blur analysis, perception, and reduction using synchronized backlight flashing”. Proceedings of the SPIE Conf. Human Vision and Electronic Imaging XI, 2006, 6057.
[2] H. Pan, X. Feng, and S. Daly. “Quantitative analysis of LCD motion blur and performance of existing approaches”. SID Symposium Digest of Technical Papers, SID, 2005, 36, 1590-1593.
[3] A. B. Watson. “The Spatial Standard Observer: A human vision model for display inspection”. SID Symposium Digest of Technical Papers, SID, 2006, 37, 1312-1315.
[4] Sylvain Tourancheau, Kjell Brunnström, Börje Andrén and Patrick Le Callet. “LCD motion-blur estimation using different measurement methods”. Journal of the Society for Information Display, Volume 17, Issue 3, pp. 239-249. March 2009.
[5] Sylvain Tourancheau, Patrick Le Callet, Kjell Brunnström and Börje Andrén. “Psychophysical study of LCD motion blur perception”. Proceedings of the SPIE Conf. Human Vision and Electronic Imaging XIV, 2009, 7240.
[6] Tsunenori Yamamoto, Susumu Sasaki, Yoshinori Tanaka, and Youichi Igarashi. “Guiding principles for high-quality moving picture in LCD TVs”. Journal of the Society for Information Display, 14(10):933–940, October 2006.
[7] Kwang Hoon Shin, Ji Young Ahn, Ki Duk Kim, Hyun Ho Shin, and In Jae Chung. “Acceptable motion blur levels of a LCD TV based on human visual system”. SID Symposium Digest of Technical Papers, volume 37, pages 287–290. SID, June 2006.
[8] T. Fujine, Y. Kikuchi, M. Sugino, Y. Yoshida, "Real-life in-home viewing conditions for FPDs and statistical characteristics of broadcast video signal," Proc. AM-FPD'06 (2006) pp. 85.
[9] VESA. Flat Panel Display Measurements (FPDM2). Technical Report 2.0 Update, Video Electronics Standards Association, May 2005.
[10] Teunissen, K., Li, X., Heynderickx, I. (2007). Measuring motion blur in liquid crystal displays. Information Display, 23 (1), pp. 20-23.