1
Mohammad Salsabili
1, Ali Saeidi
2, Alain Rouleau
21 Ph.D. Student, Département des sciences appliquées, Université du Québec à Chicoutimi, Saguenay (Québec), Canada. 2 Professor, Département des sciences appliquées, Université du Québec à Chicoutimi, Saguenay (Québec), Canada. ABSTRACT
Local geological and geotechnical conditions can have significant effects on the incoming seismic waves and their spatial variation. Commonly referred to as site-effects, certain conditions can significantly amplify the intensity of the seismic shaking and make it more destructive. Site effects are accounted for in national building codes by the selection of amplification factors as functions of soil category, seismic intensity and frequency. The soil type is categorized by considering representative shear-wave velocity, the number of blows in the standard penetration test, and/or undrained shear strength in the top 30 meters. Although soil categorizations based on these geotechnical parameters are more or less similar across earthquake-prone countries, there are some differences, which may result in over- or underestimation of the potential site effects. The Saguenay-Lac-Saint-Jean region (SLSJ) is located in a moderate seismicity zone in Eastern Canada; the last major earthquake in this region occurred in 1988 with a moment magnitude of 5.9. The presence of important deposits of sensitive clays in SLSJ combined with the strong impedance contrast between the unconsolidated deposits and the underlying crystalline bedrock can play an important role in the soil dynamic response. Different soil classification criteria and respective amplification factors are compared: the 2015 National Earthquake Hazards Reduction Program (NEHRP), Eurocode 8, and the 2015 National Building Code of Canada (NBCC). The advantages and disadvantages of each classification approach are discussed.
Keywords: Site-effects, National Codes, The Saguenay region, Site classification, Vs,30 INTRODUCTION
The geological conditions of near-surface deposits have a significant role in variations of observed seismic motion intensities. These variations can affect the amplitude and frequency content of seismic waves at a particular location, which has been known as site-effect [1]. Significant contribution to the observed damage during past destructive earthquakes was attributed to this phenomenon, e.g. 1985 M8.0 Mexico City, 1989 M6.9 Loma Prieta, etc. Borcherdt and Glassmoyer [2] and Borcherdt [3] were the first to propose the implementation of geotechnical and geological parameters as identification criteria to empirically delineate the effect of local site classes and associated spectral-frequency dependent amplification factors. Borcherdt [3] characterized the local site conditions in terms of time-averaged shear-wave velocity of the top 30 meters, 𝑉̅𝑠,30. This parameter
has been generally adopted in national seismic building codes to determine potential amplification ([4-6]). The standard site classification scheme considers four to five site classes ranging from hard rock, rock with moderate fracturing and weathering, stiff or dense cohesionless soil, to soft clayey or loose sandy soil. This type of classification provides a reliable basis for mapping of local site conditions, and consequently can be adopted for seismic microzonation [7]. Generally, this approach provides a useful guidance for assessing the seismic hazard for a site associated amplification factors. However, it has been questioned, first for its non-applicability in some regions outside of the primary study area (California), and secondly the oversimplification of the site effect by considering the stiffness of the surface layers only as contributing factors [8-12]. Seismic microzonation and site categorization in eastern Canada due to the characteristic geology of overlying soft post-glacial sediments on hard crystalline bedrock cannot be compatible to regions where the soil mechanical properties of deposits increase gradually and steadily with depth [11]. In this region, geological modeling of subsurface layers plays a significant role in the determination of shear-wave velocity and thus site categorization. A number of seismic hazard studies have been carried out recently in southern Ontario and Quebec, and selected results are summarized in Table 1 [13-17]. Motazedian et al. [13] identified three main geological layers for the city of Ottawa on the basis of their distinct shear wave velocity, namely post-glacial, firm glacial and bedrock. The shear wave velocity of the post-glacial deposits, which are the surficial sediments in this region, presents gradually increasing values with depth, described as a Vs-depth profile. Rosset et al. [14] developed three different 𝑉̅𝑠,30 models for Montreal using predictive equations for the Vs-depth profile: (1) single-layer model based on the
2
(3) composite model comprising all of the characteristics of the former two models. Nastev et al. [15-16] in the Ottawa and St. Lawrence Valleys, and Foulon et al. [17] in the Saguenay region have implemented similar approach to map the shear-wave velocity and the site fundamental period (𝑇0). Based on the definition of the 𝑉̅𝑠,30 in national codes, this parameter can be
calculated by Eq. (1) for i layers model [14], 𝑉𝑠,30 ̅̅̅̅̅̅ = 30 (∑(ℎ𝑖 𝑉𝑠𝑖)+ (30−∑ ℎ𝑖) 𝑉𝑠𝑟𝑜𝑐𝑘) (1)
where, ℎ𝑖 and 𝑉𝑠𝑖 are the thickness and shear-wave velocity of each i layer, and 𝑉𝑠𝑟𝑜𝑐𝑘 is the bedrock shear-wave velocity in
case of a thickness of deposits less than 30 meters. Consequently, the spatial distribution of site classes and the microzonation can be mapped over a study area. Due to the high variability of the Vs measurements and the thickness of soil layers, however,
the estimated value of 𝑉̅𝑠,30 includes a considerable uncertainty and a smoothing effect, which challenges the reliability of the
averaging process. For example, considering the 𝑉𝑠𝑟𝑜𝑐𝑘 as 2500m/s causes a huge difference in 𝑉̅̅̅̅̅̅𝑠,30 along a site column where
the total thickness of soil layers range are less than 30 meters.
The objective of this paper is to present site microzonation map of the Saguenay region based on three national codes: the 2015 NEHRP provisions [5], the Eurocode 8 [6], and the National Building Code of Canada 2015, NBCC [4]. The spatial distributions of the site classes determined with these methods are compared and discussed. At the end, the effect on the final results of shear wave velocity values of different geologic layers and different 𝑉̅̅̅̅̅̅ site classification ranges are delineated and𝑠,30
evaluated.
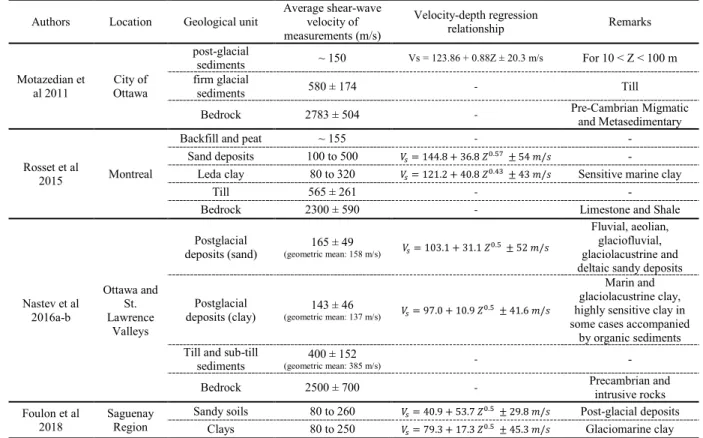
Table 1. Shear wave velocity of major Quaternary deposits and bedrock outcrops of eastern Canada region
Authors Location Geological unit Average shear-wave velocity of measurements (m/s) Velocity-depth regression relationship Remarks Motazedian et al 2011 Ottawa City of post-glacial sediments ~ 150 Vs = 123.86 + 0.88Z ± 20.3 m/s For 10 < Z < 100 m firm glacial sediments 580 ± 174 - Till
Bedrock 2783 ± 504 - Pre-Cambrian Migmatic and Metasedimentary
Rosset et al
2015 Montreal
Backfill and peat ~ 155 - -
Sand deposits 100 to 500 𝑉𝑠= 144.8 + 36.8 𝑍0.57 ± 54 𝑚/𝑠 -
Leda clay 80 to 320 𝑉𝑠= 121.2 + 40.8 𝑍0.43 ± 43 𝑚/𝑠 Sensitive marine clay
Till 565 ± 261 - -
Bedrock 2300 ± 590 - Limestone and Shale
Nastev et al 2016a-b Ottawa and St. Lawrence Valleys Postglacial
deposits (sand) (geometric mean: 158 m/s)165 ± 49 𝑉𝑠= 103.1 + 31.1 𝑍0.5 ± 52 𝑚/𝑠
Fluvial, aeolian, glaciofluvial, glaciolacustrine and deltaic sandy deposits Postglacial
deposits (clay) (geometric mean: 137 m/s)143 ± 46 𝑉𝑠= 97.0 + 10.9 𝑍0.5 ± 41.6 𝑚/𝑠
Marin and glaciolacustrine clay, highly sensitive clay in some cases accompanied
by organic sediments Till and sub-till
sediments (geometric mean: 385 m/s)400 ± 152 - -
Bedrock 2500 ± 700 - Precambrian and intrusive rocks
Foulon et al
2018 Saguenay Region Sandy soils 80 to 260
𝑉𝑠= 40.9 + 53.7 𝑍0.5 ± 29.8 𝑚/𝑠 Post-glacial deposits
Clays 80 to 250 𝑉𝑠= 79.3 + 17.3 𝑍0.5 ± 45.3 𝑚/𝑠 Glaciomarine clay
GEOLOGY OF THE STUDY AREA
The effect of soft surface deposits and lateral heterogeneity can be evaluated for the Saguenay region using the 3D geo-model developed by Foulon et al. [17]. This model has been constructed by integrating and interpreting the surface quaternary maps [18-21] combined with subsurface data mostly based on borehole logs from various sources [22]. The Quaternary units of the Saguenay region can be integrated into 5 major groups, from bottom of the soil column: till, glaciofluvial gravel and sand, fine glaciomarine sediments (clay and silt), coarse glaciomarine sand and gravel sediments, and various loose post-glacial deposits consisting of alluvium, floodplain, organic sediments and landslide deposits [17,21]. The bedrock geology of Saguenay region makes part of the Grenville geological province and is mainly composed of crystalline Precambrian rocks [23]. The surficial geological map of the Saguenay region (Figure 1a) is based on Daigneault et al. [21]. The surface area of each exposed
3
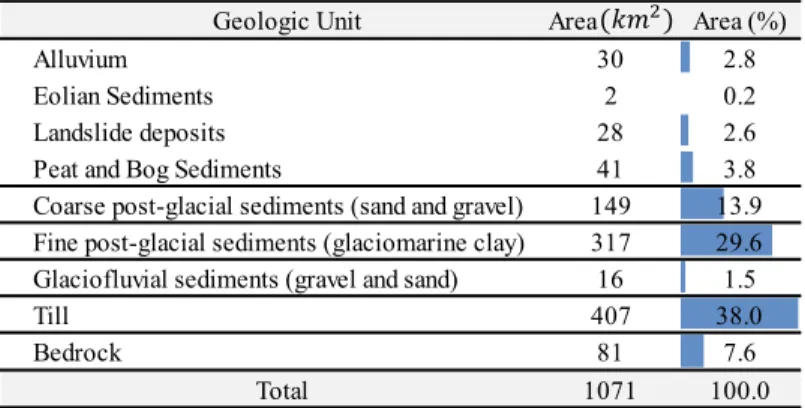
stratigraphic unit present in the region is given in Table 2. It can be seen that the surficial geology in the region mainly consist of till, fine post-glacial, coarse post-glacial sediments and bedrock outcrops, with 38%, 30%, 14% and less than 8 percent respectively. Till, in the lowlands, is compact, consolidated and continuous with a thickness from a few meters to more than 10 meters, and it covers the bedrock; whereas, it is discontinuous in highlands, with a thickness decreasing to 1 meter or less [17]. Fine post-glacial sediments, which are mainly composed of clays, present the thickest and most widespread sediments in the Saguenay region. Bouchard et al. [24] proposed a hypothesis of pre-consolidation for these clays, resulting from partial erosion after their deposition; however, further studies are required for evaluating the reliability of these glaciomarine clays for infrastructural development. Figure1b presents the total thickness of surface-deposits overlying bedrock in the Saguenay region. The thickness of these sediments is mainly in a range of less than 10 meters, but it reaches more than 100 meters in some lowlands area mainly composed of post-glacial sediments.
a b
Figure 1. (a) The simplified surface geological map of Saguenay region (modified from [21]), (b) The thickness map of surface-deposits
Table 2. Major geologic units and the area of surface deposits and bedrock outcrops in Saguenay region
SEISMIC CODE-ORIENTED SITE CLASSIFICATION National Building Code of Canada (NBCC 2015)
Site classification based on NBCC 2015 [4] is divided into 5 categories (Table 3). Class A and Class B in this code are representative of rock, with an average shear-wave velocity more than 760 m/s for the top 30 m; the other classes are defined for soil profiles. It should be noted that for classes A and B, the thickness of the soft materials must be less than 3 meters; for thicker deposits, the time-averaged shear wave velocity is computed only for the soil above the rock. The additional site Class F includes liquefiable soils, sensitive or highly organic clays more than 3 meters in thickness, or plastic clays more than 8 m in thickness. Consequently, considering these criteria, estimating the thickness of soft soil materials plays a significant role and must be evaluated with a precision of less than 1 meter. These conditions can be applied precisely for a small area, for instance a construction site for a building, yet they are difficult to achieve for a large area such as the Saguenay region. Therefore, some generalization and approximation are required in geological modeling to conduct the seismic microzonation over the Saguenay region. In addition to 𝑉̅𝑠,30, soil classifications can be undertaken by considering two other parameters such as standard
penetration test data (𝑁𝑆𝑃𝑇) and undrained shear strength (𝑆𝑢). The site coefficients (amplification factors) can be evaluated
Geologic Unit Area Area (%)
Alluvium 30 2.8
Eolian Sediments 2 0.2
Landslide deposits 28 2.6
Peat and Bog Sediments 41 3.8
Coarse post-glacial sediments (sand and gravel) 149 13.9 Fine post-glacial sediments (glaciomarine clay) 317 29.6 Glaciofluvial sediments (gravel and sand) 16 1.5
Till 407 38.0
Bedrock 81 7.6
Total 1071 100.0
4
based on the site classes and the reference peak ground acceleration for a site. These factors intensify or de-amplify the seismic hazard parameters represented by 5% damped spectral response acceleration values, Sa(T), for six short and long periods to
determine the design spectral acceleration values.
National Earthquake Hazards Reduction Program (NEHRP, 2015)
The current 2015 NEHRP Recommended Provisions for New Buildings and Other Structures [5] are the source of site classifications in the U.S. [25]. The site classes in both ASCE/SEI 7-16 and NBCC are similar; however, there are some differences in additional definition. For instance, the shear-wave velocity for weathered and highly fractured Site Class B shall either be measured on site or classified as Site Class C (the thickness criteria is not clearly identified). In other words, the interpretation of the quality and continuity of rock Classes A and B in the NEHRP provisions can be dependent on the knowledge of a geotechnical engineer or geologist. Regarding ASCE/SEI 7-16, site coefficients (Fa and Fv) are based on the
site shear wave velocity reference of 760m/s (referred to as B/C boundary), and they have been defined for both short and long periods. The site coefficients depend on the intensity of spectral acceleration for two periods (Ss and S1) and the local Site Class. Eurocode 8
The Eurocode 8 consists of six parts dealing with different types of construction procedures and rules. Part 1 and part 5 (En 1998-1 and En 1998-5) include the subjects relevant to seismic and geotechnical issues. The approach for soil classification in Eurocode 8 part1 [6] is similar to NBCC and NEHRP and is based on the mechanical parameters of the ground surface. The time-averaged shear wave velocity of the top 30 meters of soil profiles is the lead parameter. It can also be substituted by the number of blows in the standard penetration test (𝑁𝑆𝑃𝑇) or undrained cohesion (undrained shear strength (𝐶𝑢). In this way, five
Ground Types, denoted A, B, C, D, and E, described by the stratigraphic profiles and classified quantitatively by 𝑉̅𝑠,30 (Table
3). Two special Ground Types, S1 and S2, are similar to Class F of NBCC or NEHRP for which special studies shall be undertaken to define the required seismic action. Ground types A through D vary from Rock to loose cohesionless or soft cohesive soils. Class E denotes an essential characteristic of ground profiles where there is a sharp contrast between soft surface layers and the stiff or hard underlying formations with Vs values greater than 800 m/s.
The Soil Factors (site coefficients) have been defined for two types of spectral responses: Type 1 and Type 2. Type 1 should be used for sites where the contribution of the seismic hazard of earthquakes with surface-wave magnitude (Ms) is greater than 5.5, otherwise Type 2 is recommended. The main difference between these two spectra is the higher intensity of spectral acceleration for longer periods in Type1. Moreover, there is some modification in soil factors due to the nonlinear behavior of soil during strong ground motion with a higher magnitude.
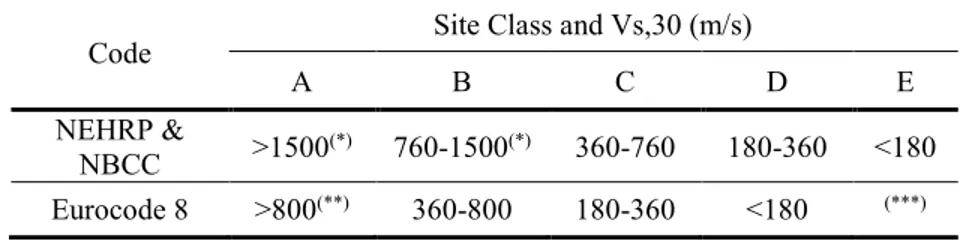
Table 3. Site Classifications and 𝑉̅𝑠,30intervals between the NEHRP, NBCC Provisions and Eurocode 8
Code Site Class and Vs,30 (m/s)
A B C D E
NEHRP &
NBCC >1500(*) 760-1500(*) 360-760 180-360 <180 Eurocode 8 >800(**) 360-800 180-360 <180 (***) * Soft soil must be less than 3 meters.
** Surface weak materials must be less than 5 meters. *** Vs <360 m/s and 5 m<H<20 m
RESULTS AND DISCUSSIONS
Site classification based on NEHRP and NBCC 2015
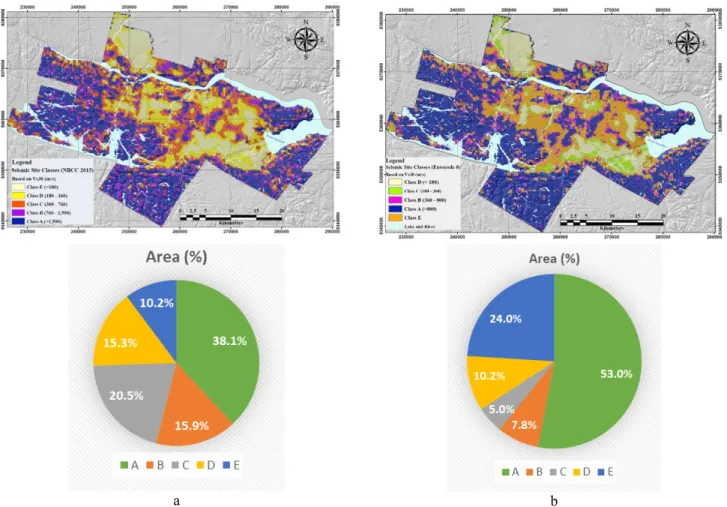
Figure 2 presents the spatial distribution and the percentage area of site classes based on NEHRP, NBCC and Eurocode 8 site classifications. Figure 2a shows that 38.1% and 15.9 % of the study area has been delineated as rock site class A and B respectively. These two site classes cover more than the half of the map surface area and they comprise the area with bedrock outcrops and till. Classes C (dense soil and soft rock) and D (stiff soil) comprise 20.5% and 15.3% respectively; only 10.2% of the study area is classified as soft soil (Class E). In other words, due to the shallow bedrock and the effect of shear wave velocity averaging, the site classification based on the 𝑉̅𝑠,30 results in almost 90% of the area classified as rock, dense and stiff soil with
site coefficient of less than 1.00. Whereas, the impedance contrast between the crystalline bedrock and the upper layers of soft soil such as glaciomarine clays, which cover more than 30% of the region, presumably indicates the underestimation of amplification factors. The impact of averaging on the 𝑉̅𝑠,30 regional distribution is assessed by computing the thickness of each
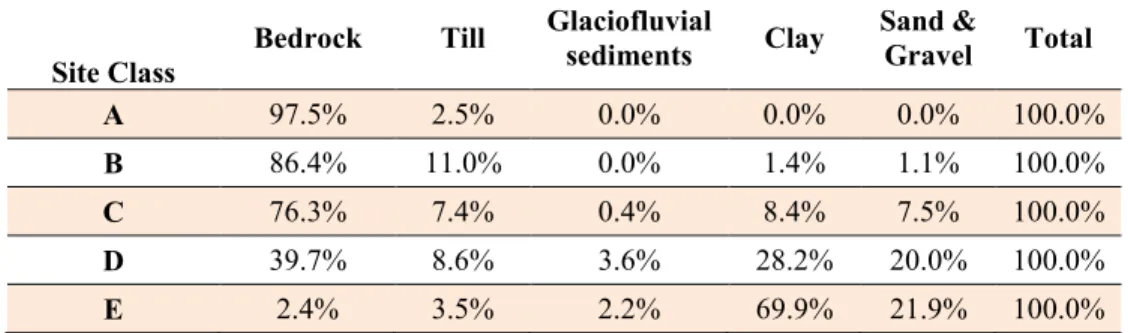
geological unit using the 3D geo-model [17]; then the normalized total thickness is considered as the representative factor in percent (Table 4). The entire thickness of a 30-meter site-column in site classes A to D is mainly composed of bedrock, and the
5
portions vary from 97.5% for site class A to the 39.7% for site class D. As a result, the impact of high shear wave velocity in the bedrock for site classes C and D results in overestimating 𝑉̅𝑠,30, especially for areas with a small thickness of various types
of unconsolidated sediments over a shallow bedrock.
Table 4. The total normalized thickness (in percent) of geological units contributing to the estimation of Vs,30 based on
NEHRP- NBCC 2015 classification approach
Site Class Bedrock Till
Glaciofluvial
sediments Clay Sand & Gravel Total
A 97.5% 2.5% 0.0% 0.0% 0.0% 100.0%
B 86.4% 11.0% 0.0% 1.4% 1.1% 100.0%
C 76.3% 7.4% 0.4% 8.4% 7.5% 100.0%
D 39.7% 8.6% 3.6% 28.2% 20.0% 100.0%
E 2.4% 3.5% 2.2% 69.9% 21.9% 100.0%
Site classification based on Eurocode 8
Figure 2b presents the percentage area of site classes based on Eurocode 8. It shows that 53 % of the area has been delineated as rock site class A. Similarly to the result of classification based on NEHRP and NBCC, this site class covers more than half of the study region; it comprises areas with either bedrock or till outcrops. However, the area coverage of very stiff and stiff material, namely Ground Types B and C, decreases to 7.8% and 5.0% respectively in comparison to Classes C and D of NBCC. 10.2% of the study area is covered by soft soil as Ground Type D, and 24.0% of the area has been delineated as Ground Type E, which represents a soil column underlain by rock. The normalized thickness of geological profiles is considered in the estimation of 𝑉̅𝑠,30 given in Table 5. It can be observed that the normalized portion of bedrock thickness is limited only in the
estimation of the Ground Types A and B, which corresponds to the definition of these site classes. The main geological unit in Ground Type C is sand & gravel, and in Ground Type D, it is clay. Based on the definition of Ground Type E, the determination of Vs is only based on the soft materials overlying the bedrock or very stiff soil; therefore, the effect of shallow depth bedrock
has been alleviated by outlining this Ground Type.
Table 5. Total normalized thickness (in percent) of geological units contributing to the estimation of Vs,30 of site classes
based on Eurocode 8 classification approach
Ground Type Bedrock Till
Glaciofluvial
sediments Clay Sand & Gravel Total
A 94.5% 4.8% 0.0% 0.4% 0.3% 100.0% B 81.6% 7.4% 0.1% 6.2% 4.7% 100.0% C 14.4% 11.6% 8.4% 22.6% 43.1% 100.0% D 2.4% 3.5% 2.2% 69.9% 21.9% 100.0% E* - 21.5% 2.4% 51.7% 24.4% 100.0% Vs estimation
6
a b
Figure 2. Relative surface area for seismic site classes in the Saguenay region: (a) NEHRP and NBCC 2015, (b) Eurocode 8
Comparison
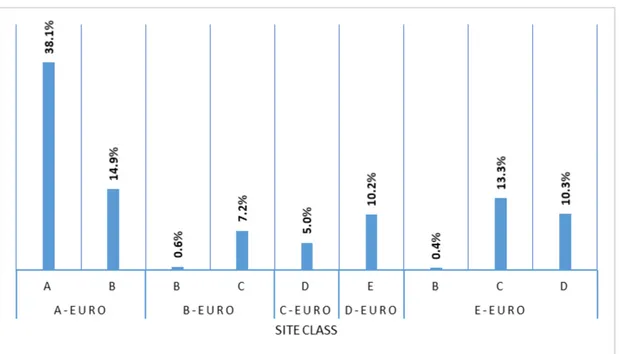
To obtain a better insight on the differences and consistencies of the two site classification approaches that are NEHRP (or NBCC) and Eurocode 8, the percentage area covered by each site class is shown in a bar chart in Figure 3. It indicates that 53.0 % of the regional surface area is denoted as Class A (Eurocode 8, Figure 2b), that is 38.1% of Class A and 14.9% of Class B (NEHRP & NBCC). Correspondingly, the other Eurocode 8 site classes, including B, C, and D, are consistent with C, D, and E of NEHRP site classes, which are in accordance with the 𝑉̅𝑠,30 thresholds for each site class (Figure 3). The main difference
can be observed in the percentage of Ground Type E of Eurocode 8, which is mainly composed of Class C (very dense soil), and Class D (stiff soil) of NEHRP site classification. This difference in classification is a direct consequence of averaging high shear wave velocity of rock and low shear wave velocity of soil.
7
Figure 3. Comparison between Eurocode 8 and NBCC 2015, (NEHRP 2015), site classification for the Saguenay region (the percentage values are based on the area portion of each site class)
CONCLUSION
With respect to the seismic hazard parameters, NEHRP defines the site-specific design spectral acceleration parameter for two periods, namely for short period 0.2 s (Ss) and for long period of 1.0 s (S1). Spectral response acceleration values, Sa(T), has been
defined in NBCC for six definite periods, while Eurocode 8 defines seismic hazard only for a single parameter which is the value of the reference peak ground acceleration (agR).
Due to the potential nonlinear behavior of soils, site coefficients are also dependent on seismic intensity. This effect is accounted for by using different amplification factors for short and long periods in NEHRP (Fa and Fv) and NBCC (F(T)). Whereas
Eurocode 8 proposes only two types of response spectra based on the seismicity hazard level at the site.
In terms of site classification, the comparisons presented above between the three considered national codes suggest the following remarks.
Eurocode 8 is missing the hard-rock site condition, such as the Site Class A in NBCC and NEHRP. Due to the effect of weathering on the rock-outcrop, classification of rock site in two categories can help to better predict the site effect in weathered-fractured rock sites.
Class E of Eurocode 8 encompasses the impedance contrast between the overlying soft or loose material, and the underlying rock. The thickness of soft material in this category ranges from 5 to 20 meters, which is the case over a fairly significant area of the Saguenay region.
Regarding NBCC and NEHRP site classifications, for a site column presenting various layers of rock and soil, an overestimation of the 𝑉̅𝑠,30 value is caused by averaging the shear wave velocity of the rock-classified site combined with
soil classes; this effect has been relatively mitigated by defining Ground Type E in Eurocode 8.
Defining a distinct site class, which considers sharp impedance contrasts between soft soils and underlying hard rock, should result in a more consistent site classification for the characteristic geology of Eastern Canada.
ACKNOWLEDGMENTS
The authors would like to thank the members of CERM-PACES project for providing access to the database and their fruitful cooperation. This research has been partially funded by the NSERC and Hydro-Quebec under project funding no. RDC 521771 – 17.
REFERENCES
[1] Seed, H. B., Ugas, C., & Lysmer, J. (1976). “Site-dependent spectra for earthquake-resistant design”. Bulletin of the Seismological society of America, 66(1), 221-243.
8
[2] Borcherdt, R. D., & Glassmoyer, G. (1992). “On the characteristics of local geology and their influence on ground motions generated by the Loma Prieta earthquake in the San Francisco Bay region, California”. Bulletin of the seismological society of America, 82(2), 603-641.
[3] Borcherdt, R. D. (1994). “Estimates of site-dependent response spectra for design (methodology and justification)”. Earthquake spectra, 10(4), 617-653.
[4] NRC (2015). “National Building Code of Canada- 14th ed.” Canadian Commission on Building and Fire Codes, National Research Council of Canada, Ottawa, Ontario, Canada.
[5] Building Seismic Safety Council- BSSC (2015). NEHRP Recommended Seismic Provisions for New Buildings and Other Structures, FEMA P-1050-1/2015 Edition.
[6] CEN (2004) -Eurocode 8: Design of structures for earthquake resistance-part 1: general rules, seismic actions and rules for buildings. European Standard EN 1998-1:2004, Comité Européen de Normalisation.
[7] Bard, P.-Y. and Riepl-Thomas J. (2000). "Wave propagation in complex geological structures and their effects on strong ground motion," Wave Motion in Earthquake Engineering, E. Kausel and G. Manolis (Editors), WIT Press, Southampton, Great Britain, pp. 37-95
[8] Castellaro, S., Mulargia, F., & Rossi, P. L. (2008). “VS30: Proxy for seismic amplification?”. Seismological Research Letters, 79(4), 540-543.
[9] Gallipoli, M. R., & Mucciarelli, M. (2009). “Comparison of site classification from VS 30, VS 10, and HVSR in Italy”. Bulletin of the Seismological Society of America, 99(1), 340-351.
[10] Luzi, L., Puglia, R., Pacor, F., Gallipoli, M. R., Bindi, D., & Mucciarelli, M. (2011). “Proposal for a soil classification based on parameters alternative or complementary to Vs,30”. Bulletin of Earthquake Engineering, 9(6), 1877-1898.
[11] Braganza, S., & Atkinson, G. M. (2017). “A model for estimating amplification effects on seismic hazards and scenario ground motions in southern Ontario”. Canadian Journal of Civil Engineering, 44(6), 441-451.
[12] Pitilakis, K., Riga, E., Anastasiadis, A., Fotopoulou, S., & Karafagka, S. (2018, in press). “Towards the revision of EC8: Proposal for an alternative site classification scheme and associated intensity dependent spectral amplification factors”. Soil Dynamics and Earthquake Engineering, https://doi.org/10.1016/j.soildyn.2018.03.030.
[13] Motazedian, D., Hunter, J. A., Pugin, A., & Crow, H. (2011). “Development of a VS30 (NEHRP) map for the city of Ottawa,
Ontario, Canada”. Canadian Geotechnical Journal, 48(3), 458-472.
[14] Rosset, P., Bour-Belvaux, M., & Chouinard, L. (2015). "Microzonation models for Montreal with respect to VS30". Bulletin
of Earthquake Engineering, 13(8), 2225-2239.
[15] Nastev, M., Parent, M., Ross, M., Howlett, D., & Benoit, N. (2016). “Geospatial modelling of shear-wave velocity and fundamental site period of quaternary marine and glacial sediments in the Ottawa and St. Lawrence Valleys, Canada”. Soil Dynamics and Earthquake Engineering, 85, 103-116.
[16] Nastev, M., Parent, M., Benoit, N., Ross, M., & Howlett, D. (2016). “Regional VS30 model for the St. Lawrence Lowlands, Eastern Canada”. Georisk: Assessment and Management of Risk for Engineered Systems and Geohazards, 10(3), 200-212. [17] Foulon, T., Saeidi, A., Chesnaux, R., Nastev, M., & Rouleau, A. (2018). "Spatial distribution of soil shear-wave velocity and the fundamental period of vibration–a case study of the Saguenay region, Canada”. Georisk: Assessment and Management of Risk for Engineered Systems and Geohazards, 12(1), 74-86.
[18] Lasalle, P., and G. Tremblay. (1978). "Dépôts meubles du Saguenay‒Lac-Saint-Jean". Québec: Direction générale de la recherche géologique et minérale, Ministère des Ressources Naturelles.
[19] Dion, D. J. (1986). "Levé géotechnique de la région de Jonquière-Chicoutimi-La Baie". Québec: Direction générale de l’exploration géologique et minérale, Ministère de l’énergie et des ressources, MB 86–51. 136
[20] Paradis, S. J., M. Parent, D. Perret, and C. Gegin. (1998). Géologie des formations superficielles, Saint-Fulgence et La Baie, Québec, document public 3710, carte avec notes marginales. Commission géologique du Canada.
[21] Daigneault, R.-A., P. Cousineau, E. Leduc, G. Beaudoin, S. Millette, N. Horth, D. W. Roy, M. Lamothe, and G. Allard. (2011). Rapport final sur les travaux de cartographie des formations superficielles réalisés dans le territoire municipalisé du Saguenay-Lac-Saint-Jean. Quebec City: Ministère des Ressources naturelles et de la Faune du Québec.
[22] CERM-PACES. 2013. Résultat du programme d’acquisition de connaissances sur les eaux souterraines de la région Saguenay-Lac-Saint-Jean. Chicoutimi: Centre d’études sur les ressources minérales, Université du Québec à Chicoutimi. [23] Davidson, A. 1998. "Geological Map of the Grenville Province: Canada and Adjacent Parts of the United States of
America”. Map 1947A. Québec: Geological Survey of Canada.
[24] Bouchard, R., D. J. Dion, and F. Tavenas. 1983. “Origine de la préconsolidation des argiles du Saguenay, Québec.” Canadian Geotechnical Journal 20: 315–328.
[25] American Society of Civil Engineers- ASCE. (2017). Minimum Design Loads and Associated Criteria for Buildings and Other Structures. ASCE standard, ASCE/SEI 7-16.
View publication stats View publication stats