Département de génie civil
PERFORMANCE AND STRUT EFFICIENCY FACTOR
OF CONCRETE DEEP BEAMS REINFORCED WITH
GFRP BARS
Performance et facteur d'efficacité de la bielle de poutres profondes en béton armé avec des barres de PRFV.
Thèse de doctorat Spécialité : génie civil
Khaled Ahmed AbdelRaheem Mohamed
A dissertation submitted in partial fulfillment of the requirements for the degree of
Doctor of Philosophy (Civil Engineering)
Jury: Prof. Brahim BENMOKRANE (directeur de recherche) Prof. Kenneth W. Neale (co-directeur de recherche) Prof. Abdeldjelil BELARBI
Prof. Adel EL SAFTY Prof. Ammar YAHIA
i
ABSTRACT
Deep reinforced concrete beams are commonly used as transfer girders or bridge bents, at which its safety is often crucial for the stability of the whole structure. Such elements are exposed to the aggressive environment in northern climates causing steel-corrosion problems due to the excessive use of de-icing salts. Fiber-reinforced polymers (FRP) emerged as non-corroded reinforcing materials to overcome such problems in RC elements. The present study aims to address the applicability of concrete deep beams totally reinforced with FRP bars. Ten full-scale deep beams with dimensions of 1200 × 300 × 5000 mm were constructed and tested to failure under two-point loading. Test variables were shear-span depth ratio (equal to 1.47, 1.13, and 0.83) and different configurations of web reinforcement (including vertical and/or horizontal web reinforcement). Failure of all specimens was preceded by crushing in the concrete diagonal strut, which is the typical failure of deep beams. The test results indicated that, all web reinforcement configurations employed in the tested specimens yielded insignificant effects on the ultimate strength. However, strength of specimens containing horizontal-only web reinforcement were unexpectedly lower than that of specimens without web reinforcement. The web reinforcement’s main contribution was significant crack-width control. The tested specimens exhibited reasonable deflection levels compared to the available steel-reinforced deep beams in the literature. The development of arch action was confirmed through the nearly uniform strain distribution along the length of the longitudinal reinforcement in all specimens. Additionally, the basic assumption of the strut-and-tie model (STM) was adequately used to predict the strain distribution along the longitudinal reinforcement, confirming the applicability of the STM for FRP-reinforced deep beams. Hence, a STM based model was proposed to predict the strength of FRP-reinforced deep beams using the experimental data, in addition to the available experimentally tested FRP-reinforced deep beams in the literature. Assessment of the available STMs in code provisions was conducted identifying the important parameters affecting the strut efficiency factor. The tendency of each parameter (concrete compressive strength, shear span-depth ratio, and strain in longitudinal reinforcement) was individually evaluated against the efficiency factor. Strain energy based calculations were performed to identify the appropriate truss model for detailing
FRP-reinforced deep beams, hence, only four specimens with vertical web reinforcement exhibited the formation of two-panel truss model. The proposed model was capable to predict the ultimate capacity of the tested deep beams. The model was also verified against a compilation of a data-base of 172 steel-reinforced deep beams resulting in acceptable level of adequacy. The ultimate capacity and performance of the tested deep beams were also adequately predicted employing a 2D finite element program (VecTor2), which provide a powerful tool to predict the behavior of FRP-reinforced deep beams. The nonlinear finite element analysis was used to confirm some hypotheses associated with the experimental investigations.
Keywords: Concrete, FRP bars, deep beams, web reinforcement, arch action, strut-and-tie
iii
RÉSUMÉ
Les poutres profondes en béton armé (BA) sont couramment utilisées comme poutre de transfert ou coude de pont, comme quoi sa sécurité est souvent cruciale pour la sécurité de l’ensemble de la structure. Ces éléments sont exposés à un environnement agressif dans les climats nordiques causant des problèmes de corrosion de l’acier en raison de l’utilisation excessive de sels de déglaçage. Les polymères renforcés de fibres (PRF) sont apparus comme des matériaux de renforcement non corrodant pour surmonter ces problèmes dans les BA. La présente étude vise à examiner la question de l'applicabilité des poutres profondes en béton complètement renforcées de barres en PRF. Dix poutres profondes à grande échelle avec des dimensions de 1200 × 300 × 5000 mm ont été construites et testées jusqu’à la rupture sous chargement en deux points. Les variables testées comprenaient différents ratios de cisaillement porté/profondeur (égal à 1.47, 1.13 et 0.83) ainsi que différentes configurations d’armature dans l’âme (incluant un renforcement vertical avec ou sans renforcement horizontal). La rupture de tous les spécimens a été précédée par l’écrasement du béton dans le mât diagonal, ce qui est la rupture typique pour les poutres profondes en BA. Les résultats ont révélé que toutes les configurations de renforcement de l’âme employées dans les spécimens d'essais avaient un effet négligeable sur la résistance ultime. Toutefois, la résistance des spécimens contenant uniquement un renforcement horizontal était étonnamment inférieure à celle des spécimens sans renforcement. La contribution principale du renforcement de l’âme était dans le contrôle de la largeur de fissuration. Les spécimens examinés présentaient une déflexion raisonnable par rapport à ce qui est disponible pour les poutres profondes renforcées en acier dans la littérature. Le développement de l'effet d'arche a été confirmé par la distribution quasi uniforme des déformations le long du renforcement longitudinal dans tous les spécimens. En outre, l'hypothèse de base du modèle des bielles et tirants (MBT) a été utilisée adéquatement pour prédire la distribution de déformation le long du renforcement longitudinal, confirmant l'applicabilité du MBT pour les poutres profondes armées de PRF. Par conséquent, un modèle basé sur un MBT a été proposé afin de prédire la résistance des poutres profondes renforcées de PRF en utilisant les données expérimentales en plus de la mise à l'épreuve expérimentalement des poutres profondes renforcées de PRF trouvées dans la littérature. Une
évaluation des MTB disponibles dans les dispositions des codes a été menée afin de déterminer les paramètres importants affectant le facteur d'efficacité de la bielle. La tendance de chaque paramètre (la résistance à la compression du béton, le ratio de cisaillement porté/profondeur, et la déformation dans le renforcement longitudinal) a été évaluée individuellement contre le facteur d'efficacité. Des calculs basés sur l’énergie des déformations ont été effectués pour identifier le modèle de treillis approprié afin de détailler les poutres profondes renforcées de PRF. Par conséquent, seulement quatre spécimens avec un renforcement vertical dans l’âme présentaient la formation de modèles avec deux panneaux de treillis. Le modèle proposé a été capable de prédire la capacité ultime des poutres profondes testées. Le modèle a également été vérifié contre une base de données de 172 poutres profondes renforcées en acier aboutissant en un niveau acceptable de pertinence. La capacité ultime et la performance des poutres profondes testées ont été également adéquatement prédites employant un programme d'éléments finis en 2D (VecTor2), ce qui fournira un puissant outil pour prédire le comportement des poutres profondes renforcées de PRF. L'analyse non linéaire par éléments finis a été utilisée afin de confirmer certaines hypothèses associées à l'étude expérimentale.
Mots-Clés : Béton, barres de PRF, poutre profonde, renforcement de l’âme, effet d’arche,
v
ACKNOWLEDGEMENTS
Thanks to Almighty ALLAH for the gracious kindness in all the endeavors I have taken up in my life.
The author would like to express his gratefulness to the valuable advices and patience of his supervisor, Prof. Brahim Benmokrane, and for giving him the opportunity to conduct such research in Sherbrooke University and providing him support at times when it was most needed. The gratefulness is also extended to the support and assistance of Prof. Kenneth W. Neale who is the co-director of this thesis.
To Dr. Ahmed S. Farghaly, your passion to structural engineering has been an inspiration to me. I cannot thank you enough for the countless sit-downs, late-night conversations and technical brainstorming. This is beside the hand-by-hand work with dedication and devotion in every single step during the whole project. Many thanks also go to my jury Prof. Abdeldjelil Belarbi, Prof. Adel El Safty, and Prof. Ammar Yahia.
A special thanks goes to our group technical staff; Mr. Martin Bernard and Mr. Simon Kelley; who provided valuable assistance during the laboratory work. The author also appreciates the support and encourage of his colleague Dr. Nayera Mohamed. Thanks also go to his entire colleagues in civil engineering department, and the help of Yanis Tighiouart during specimen’s preparation.
I am grateful for the scholarship granted to me by the Canada Research Chair in Advanced Composite Materials for Civil Structures and Natural Sciences and Engineering Research Council of Canada (NSERC-Industry Research Chair program).
To my parents, thank you for your commitment to my education and for making me the person that I am today. To my wife Shaimaa and my son Ziad, thank you for your unconditional love and encouragement, your patience and supporting made this possible.
Khaled Ahmed AbdelRaheem Mohamed September 2015
vi
TABLE OF CONTENTS
ABSTRACT i RÉSUMÉ iii ACKNOWLEDGEMENTS v TABLE OF CONTENTS vi LIST OF TABLES ix LIST OF FIGURES x CHAPTER 1: INTRODUCTION 1 1.1 General Background 11.2 Objectives and Scope 4
1.3 Methodology 4
1.4 Thesis Organization 6
CHAPTER 2: LITERATURE REVIEW 8
2.1 Introduction 8
2.2 Strength and Behavior of Deep Beams 8
2.3 Strut-and-Tie Model 12
2.4 Code Provisions for Deep Beam Design 17
2.4.1 Provisions of CSA S806 (2012) and CSA A23.3 (2014) 17 2.4.2 Provisions of ACI 318 (2014) – Steel Reinforced Deep Beams 19 2.4.3 Provisions of AASHTO LRFD - Steel Reinforced Deep Beams 21
2.4.4 Literature Assessment for Code Provisions 21
2.5 Web Reinforcement Effect on Deep Beams’ Strength 26
2.6 Fiber Reinforced Polymer 34
2.6.1 FRP reinforcement type 35
2.6.2 Properties of FRP Bars 37
2.6.3 Deep Beams Reinforced with FRP Bars 40
CHAPTER 3: EXPERIMENTAL PROGRAM 44
3.1 Introduction 44
3.2 Testing Program 44
3.3 Fabrication of Tested Specimens 48
3.3.1 Reinforcement 48 3.3.2 Concrete 49 3.3.3 Specimens’ Construction 49 3.4 Test Setup 52 3.5 Instrumentation 55 3.5.1 Strain Measurements 55
3.5.2 Displacement and Crack Measurements 58
CHAPTER 4: EXPERIMENTAL RESULTS AND ANALYSIS 60
4.1 Introduction 62
4.2 Crack Pattern and Mode of Failure 63
4.3 Ultimate load and Failure Progression 69
4.4 Load-Deflection Response 71
4.4.1 Specimens with Horizontal-Only Web Reinforcement 73 4.4.2 Specimens with Vertical-Only Web Reinforcement 75 4.4.3 Specimens with Horizontal and Vertical Web Reinforcement 76 4.5 Development of Arch Action in the Tested Specimens 77
4.6 Relative Displacement-Induced Deformation 80
4.6.1 Effect of Horizontal Bars on Relative Displacement 84 4.6.2 Effect of Vertical Bars on Relative Displacement 85 4.6.3 Effect of Horizontal and Vertical Bars on Relative Displacement 85
4.7 Crack Width 85
4.8 Conclusion 88
CHAPTER 5: STRUT EFFICIENCY BASED DESIGN 91
5.1 Introduction 93
5.2 Strut-and-Tie Model 94
5.2.1 Provision of ACI 318 (2014) 95
5.2.2 Provision of CSA S806 (2012) 96
5.2.3 Assessment of the Design Provisions 97
5.2.4 Other Existing ST-Based Models 99
5.3 Strut Efficiency Factor 103
5.3.1 Parameters Affecting Strut Efficiency Factor 104
5.3.2 Proposed Development of βs 106
5.4 Assessment of Proposed Model 107
5.4.1 Strain Energy Concept 109
5.5 Conclusion 113
CHAPTER 6: NONLINEAR ANALYSIS OF TESTED DEEP BEAMS 115
6.1 Introduction 117
6.2 FEM Numerical Simulation 118
6.2.1 Applied FE Models 118
6.2.2 Crack Pattern and Failure Mode 120
6.2.3 Load-Deflection Response 122
6.2.4 Strain Levels 124
6.3 Analysis Based on FE Simulation 128
6.3.1 Deformation Behavior of Deep Beams 128
6.3.2 Effect of Web Reinforcement on Ultimate Capacity 132
6.4 Conclusions 133
CHAPTER 7: CONCLUSIONS AND RECOMMENDATIONS 135
7.2 Recommendations for Future Work 138
7.3 Conclusion 140
7.4 Recommandation pour des Travaux Futurs 144
REFERENCES 146
ix
LIST OF TABLES
Table 2.1 – Efficiency factors for CSA S806 (2012) and AASHTO LRFD (2007) 18
Table 2.2 – Efficiency factors for ACI 318 (2014) 20
Table 2.3 – Usual tensile properties of reinforcing bars (ACI 440.2R, 2008) 38
Table 3.1 – Series I beams’ details 45
Table 3.2 – Series II beams’ details 47
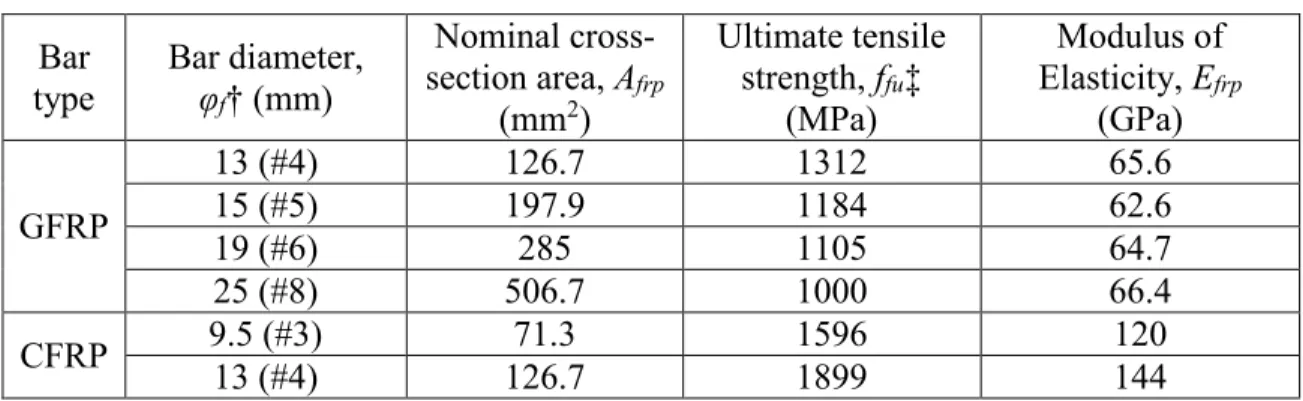
Table 3.3 – Mechanical properties of used FRP bars 49
Table 4.1 – Summary of experimental results 71
Table 4.2 – Measured and predicted tie strain at ultimate 80
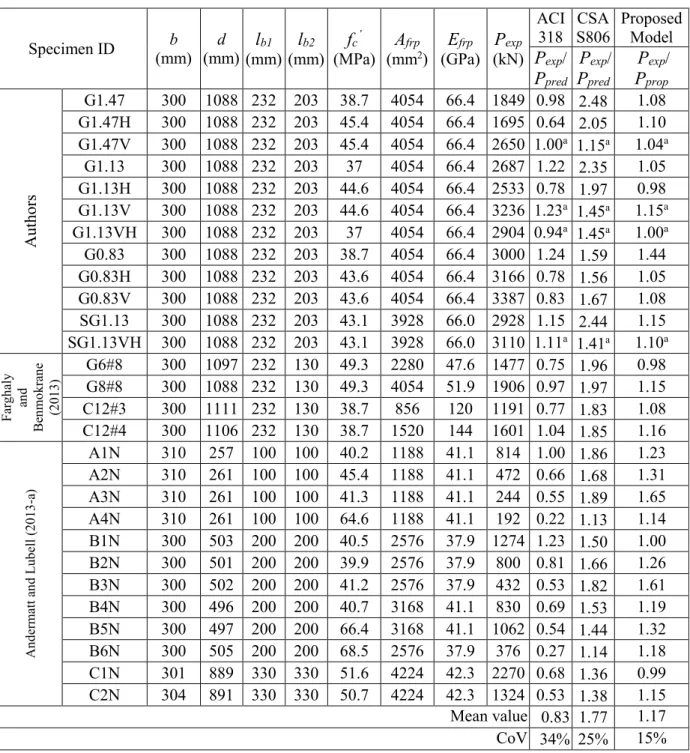
Table 5.1 – Capacity prediction of tested FRP-reinforced deep beams 98
x
LIST OF FIGURES
Figure 1.1 – Deep beams as transfer girder in bridges 2
Figure 2.1 – Strain distribution in deep and slender portion of RC beams 9
Figure 2.2 – Shear failure of deep beams without stirrups (Collins and Kuchma 1999) 10
Figure 2.3 – Beam action and arch action in RC beams 11
Figure 2.4 – Effect of a/d ratio on the shear stress (Wight and MacGregor 2009) 12
Figure 2.5 – Different component of strut-and-tie model 13
Figure 2.6 – Types of STM nodes 14
Figure 2.7 – One and two-panel truss models 15
Figure 2.8 – Prismatic shapes of struts 15
Figure 2.9 – Examples of D-region in several structures 16
Figure 2.10 – Calculation of reinforcement ratio in ACI 318 (2014) 20
Figure 2.11 – Evaluation of code provision with steel-reinforced deep beams 23
Figure 2.12 – Experimental/predicted capacity of steel-reinforced deep beams 24
Figure 2.13 – Effect of web reinforcement on strut strength (Brown and Bayrak 2006) 27
Figure 2.14 – Details of web reinforcement tested by Kong et al. 1970 28
Figure 2.15 – GFRP straight and bent bars 36
Figure 2.16 – CFRP straight and bent bars 36
Figure 2.17 – Stress-strain curve for steel bar #4, GFRP bar #4 and CFRP bar #4 38
Figure 2.18 – Beam geometry for specimens tested by Andermatt and Lubell 2013-a 42
Figure 2.19 – Deflection response of specimens tested by Andermatt and Lubell 2013-a 43
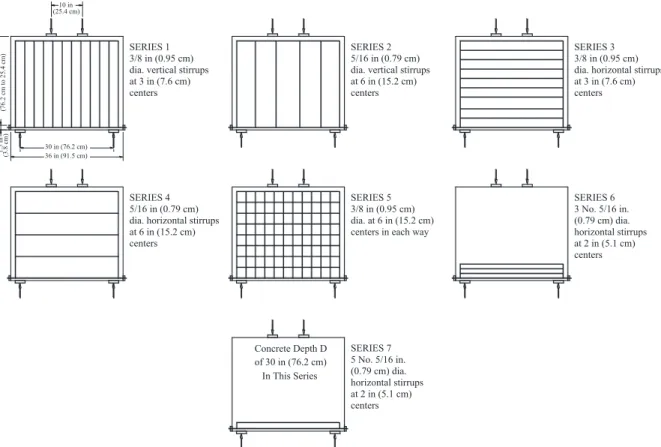
Figure 3.1 – Beams geometry of series I 45
Figure 3.2 – Beams geometry of series II 46
Figure 3.3 –Description of beams’ ID naming system 47
Figure 3.4 – Overview of specimens’ cages 50
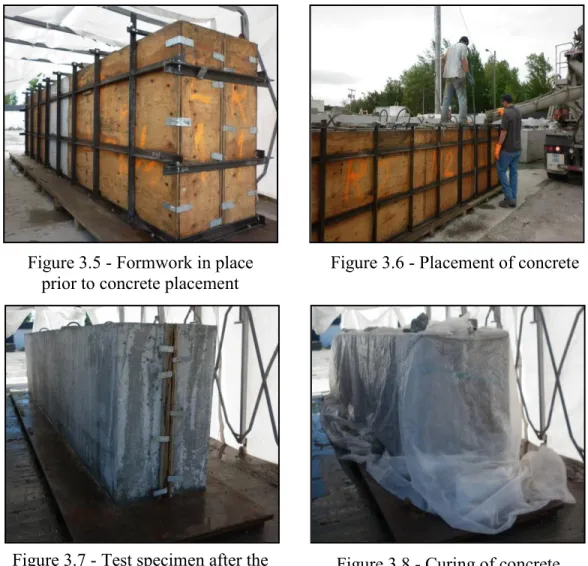
Figure 3.5 – Formwork in place prior to concrete placement 51
Figure 3.6 – Placement of concrete 51
Figure 3.7 – Test specimen after the removal of forms 51
Figure 3.8 – Curing of concrete 51
Figure 3.9 – De-molding of specimens using 25-ton crane truck 51
Figure 3.10 – Elevation view of test setup 53
Figure 3.11 – Section view of test setup 54
Figure 3.12 – Overview of test setup 55
Figure 3.13 – FRP strain gauge for GVH-1.13 56
Figure 3.14 – Typical FRP strain gauge location 56
Figure 3.15 – Concrete strain gauge locations for Series I 57
Figure 3.16 – Typical location for concrete strain LVDTs in Series II 57
Figure 3.17 – Location of displacement LVDTs 58
Figure 3.18 – Location of crack measurements LVDTs 58
Figure 4.1 – Crack pattern of deep beams with a/d ratio of 1.47 64
Figure 4.2 – Crack pattern of deep beams with a/d ratio of 1.13 65
Figure 4.3 – Crack pattern of deep beams with a/d ratio of 0.83 67
Figure 4.4 – Mode of failure of all tested specimens 68
Figure 4.5 – Failure-associated degradation 68
Figure 4.6 – Effect of a/d on normalized ultimate load capacity 70
Figure 4.7 – Normalized ultimate load–deflection response 72
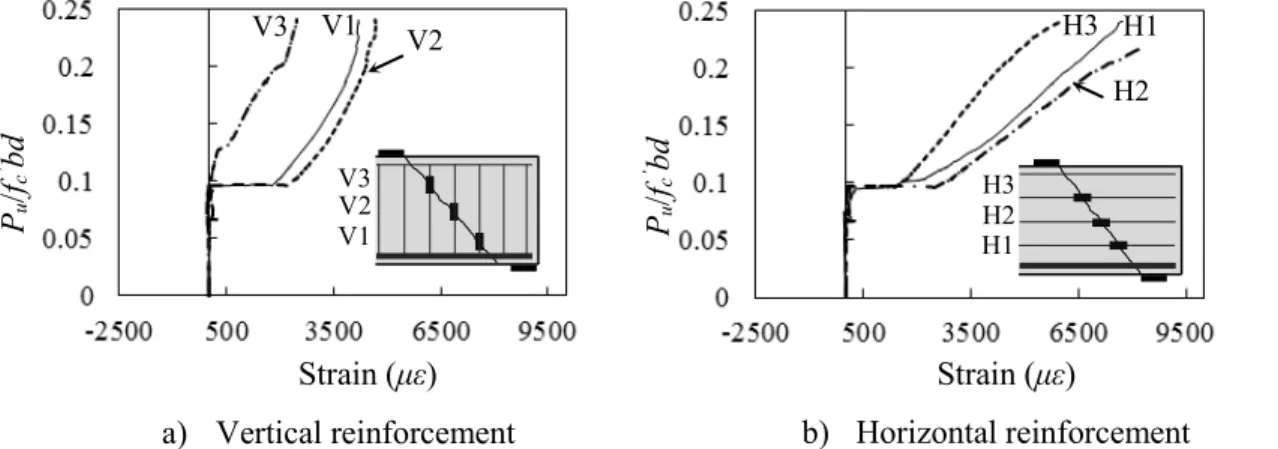
Figure 4.8 – Horizontal bars’ strain for specimens with horizontal-only web bars 73
Figure 4.9 – Softening of compressive strut due to transverse tensile strains 74
Figure 4.10 – Concrete strain at the concrete diagonal strut 75
Figure 4.11 – Vertical bars’ strain for specimens with vertical-only web bars 76
Figure 4.12 – Measured strains in the web reinforcement in G1.13VH 77
Figure 4.13 – Strain distribution in the main longitudinal reinforcement 78
Figure 4.14 – Strut-and-tie model 79
Figure 4.15 – Relative displacement in the deep beams 81
Figure 4.16 – Horizontal and vertical relative displacement 82
Figure 4.17 – Failure progression 83
Figure 4.18 – Concrete strain at the horizontal strut 84
Figure 4.19 – Crack width 87
Figure 4.20 – Crack width at 33% of the ultimate load 88
Figure 5.1 – Strut-and-tie model (one-panel) 94
Figure 5.2 – STM nodal geometry 95
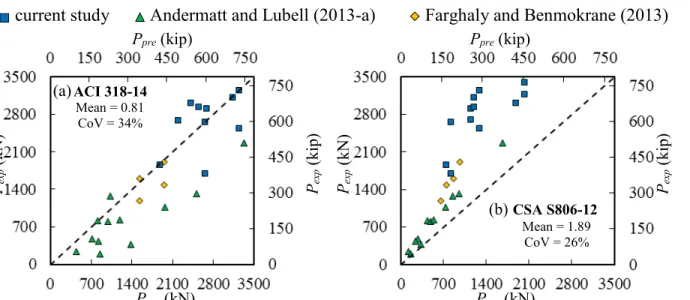
Figure 5.3 – Predicted/experimental capacity using STM in; (a) ACI and (b) CSA 97
Figure 5.4 – Predicted/experimental capacity using ST-based models 100
Figure 5.5 – Factors affect the measured efficiency factor 105
Figure 5.6 – Evaluation of the proposed model (one-panel) 107
Figure 5.7 – Two-panel truss model 107
Figure 5.8 – Nodal geometry of two-panel truss model 108
Figure 5.9 – Formation of two-panel STM in tested deep beams with vertical stirrups 108
Figure 5.10 – Calculated strain energy verses area under load-deflection curve 110
Figure 5.11 – Strain energy ratio for tested FRP-reinforced deep beams 111
Figure 5.12 – Evaluation of the proposed model based on one- and two-panel trusses 111
Figure 5.13 – Predicted verses experimental capacity for steel-reinforced deep beams 113
Figure 6.1 – Typical FE meshing (G1.13VH) 119
Figure 6.2 – Concrete pre- and post-peak response 119
Figure 6.3 – Crack pattern and failure mode from experimental observation and FE 120
Figure 6.4 – Experimental versus FE normalized load-deflection response 123
Figure 6.5 – Experimental versus FE longitudinal GFRP-reinforcement strain at ultimate 125
Figure 6.6 – Experimental versus FE strains at web reinforcement 126
Figure 6.7 – Experimental versus FE concrete strain at the diagonal strut 127
Figure 6.9 – Experimental and FE relative displacement 128
Figure 6.10 - Failure progression 129
Figure 6.11 - Concrete strain distribution around the virtual hinge 131
1
CHAPTER 1
INTRODUCTION
1.1 General Background
Infrastructure in northern climate is deteriorating due to the corrosion of steel bars resulted from the large amount of deicing salts used during winter months. The repair and rehabilitation costs consider a constant strain on the available public funds, however, even in hard economic times public infrastructure remains a top spending priority. The fédération international du béton (fib, 2006) estimated that the worldwide infrastructure maintenance and repair exceeds 100 billion euros annually. In Canada, the replacement cost of Ontario’s bridges and highways is estimated to be approximately 57 billion dollars (MTO, 2009).
That notwithstanding, fiber reinforced polymers (FRP) mitigated the potential durability concern associated with steel reinforcement and propagated as internal reinforcement for concrete structures in aggressive environment. Because of the advantages of FRP bars, they have found their way into numerous construction elements such as beams, one-way and two-way slabs, and, recently, columns and shear walls (Kassem et al. 2011, Bakis et al. 2002, El-Salakawy et al. 2005, Sharbatdar and Saatcioglu 2009, Tobbi et al. 2012, Mohamed et al. 2014). Successful application of FRP-reinforcing bars as concrete reinforcement in a wide variety of construction elements has reached an acceptable level (ACI 440 2007, fib Task Group 9.3 2007, ISIS Canada Design Manual No 3 2007). However, only the CSA-S806 (2012) provided guidelines for designing deep beams reinforced with FRP. These guidelines developed based on previous knowledge of steel-reinforced concrete deep beams. That is because there have been very limited research and experimental investigations on FRP-reinforced concrete deep beams, particularly for deep beams without web reinforcement (Farghaly and Benmokrane, 2013, Andermatt and Lubell, 2010).
Reinforced concrete deep beams are considered a major component in the superstructure of bridges. They are used mainly for load distribution such as transfer girders and/or bent caps
(Figure 1.1). Other applications of deep beams are pile caps, folded plates, foundation walls, raft beams, walls of rectangular tanks, hoppers, floor diaphragms and squat walls. Deep beams are characterized as being relatively short and deep with shear spans less than their effective depth. Hence, deep beams mechanism differs from longer beams (slender beams).
Figure 1.1 - Deep beam as transfer girder in bridges
The transition from slender beams behavior to that of deep beams is imprecise. For instance, while the ACI 318 (2014), AASHTO LRFD (2007) and CIRIA Guide (1977) use the span-depth (le/d ≤ 4.0) and the shear span-depth ratio (a/d ≤ 2.14) limits to define RC deep beams, the Canadian code CSA-S6 (2006) employs only the concept of shear span-depth ratio (a/d ≤ 2.0). This variation in deep beam definitions among provisions is due to the different definitions of B-region (Bernoulli or Beam) and D-region (distributed or discontinuity) lengths (Schlaich et al. 1987). D-regions are located at approximate distance equal to the member depth; d, from discontinuity points, such as concentrated loads and supports. Beams with only overlapping D-regions are identified as deep beams, while those with D- and B-regions are slender beams.
Several possible modes of failure of deep beams have been identified from physical tests but due to their geometrical dimensions shear strength appears to control their design. Unlike flexural failures, reinforced concrete shear failures are relatively brittle and, particularly for members without stirrups, can occur without warning. Therefore, standards for designing
reinforced concrete structures specify a minimum percentage for web reinforcement, as strength and/or serviceability requirements.
Previous research on steel-reinforced concrete deep beams has indicated that web reinforcement is considered essential for crack control (Tan et al. 1997). Nevertheless, there is disagreement between researchers, as well as in code provisions, about the effect of web reinforcement on the strength of steel-reinforced deep beams. For instance, Mihaylov et al. (2010) reported that web reinforcement improved the strength of the inclined strut and, hence, the shear strength of deep beams. Other experimental observations, however, indicated that web reinforcement had no impact on strength (Birrcher et al. 2013). Moreover, providing the minimum web reinforcement in a steel-reinforced deep beam designed according to ACI 318 (2014) would yield a beam 1.67 times greater than a deep beam without web reinforcement. Canadian codes for steel-RC and FRP-RC (CSA A.23.3-04, and CSA S806-12, respectively), however, require the minimum web reinforcement solely for crack control and consider it has no effect on deep-beam strength. To the authors’ knowledge, no investigations have been conducted to examine the effect of web reinforcement on the strength of FRP-reinforced concrete deep beams.
Historically, reinforced concrete deep beams were designed with empirical methods or simple approximations. Within the last decades, strut-and-tie model (STM) has become the preferred method for designing deep beams in codes and standards. A STM idealizes the complex flow of stresses in a structural member as axial elements in a truss member. Struts and ties intersect at nodes. Strut, ties and nodes are the three elements of STM. Concrete struts resist the compressive stress fields, and the reinforcing ties resist the tensile stress. All elements of STM must be proportioned to resist the applied forces.
The current study was aimed to investigate the behavior of FRP-reinforced deep beams, with and without web reinforcement. Experimental and analytical investigations were conducted, and then guidelines for designing of FRP-reinforced deep beams were proposed.
1.2 Objective and Scope
Due to the lack of experimental data for the deep beams reinforced with FRP bars, the current study aims to induce the use of FRP bars as internal reinforcement in reinforced concrete deep beams. Based on this study, recommendations for FRP-reinforced deep beams were given and design guidelines were proposed.
The main objective of the current study was to investigate the behavior of FRP-reinforced concrete deep beams with and without web reinforcement. Moreover, examining the applicability of the strut-and-tie model for FRP-reinforced concrete deep beams, which has been recommended in several RC provisions, was of significant important.
Basically, the objectives of the current study are:
1. Generate more data on the shear behavior of concrete deep beams (a/d < 2.0) and reinforced with FRP bars to better understand their performance,
2. Study the effect and role of the web reinforcement on the strength, deformation and serviceability of FRP-reinforced deep beams,
3. Investigate the applicability of the STM for FRP-reinforced deep beams, and
4. Evaluate the parameters affecting the strength of the concrete strut and determine the effect of each parameter, then propose a new strut-and-tie based model for designing FRP-reinforced deep beams.
1.3 Methodology
Based on the objectives of this study, an experimental program was conducted. The results of ten (10) full-scale FRP-reinforced deep beams were analyized to better understand their performance and behavior. All the deep beams were fabricated and tested at the Structure Laboratory of the University of Sherbrooke. To meet the objectives of the this study and to best identify the behavior and performance of FRP-reinforced deep beams, it was necessary to test specimens that were of comparable size to typical deep beams used in reality. Comparable
to the tested deep beams in the literature, the tested specimens considers among the largest tested FRP- or steel-reinforced deep beams. All the tested specimens in the current study were designed according to the Canadian Code CSA-S806 (2012) and American standards ACI 318 (2014) and ACI 440.1R (2006) to satisfy the design guidelines of deep beams, in addition to the details and anchorage lengths for FRP bars.
The experimental program was divided according to objectives of the current study as follows: three specimens were having three different a/d ratio (1.47, 1.13, and 0.83); and seven specimens contained different configuration of web reinforcement (horizontal-only, vertical-only, or vertical and horizontal web reinforcement).
The experimental results were analyzed identifying the effect of a/d ratio and different web reinforcement configurations on the crack pattern and failure mode, the load-deflection response, the ultimate capacity, the crack widths, and the relative displacement measurements of the FRP-reinforced deep beams. The formation of arch action and the development of STM were also investigated. Then, the experimental results were compared to the STMs proposed by CSA S806 (2012), ACI 318 (2014), and other existing STMs for steel-reinforced deep beams. Hence, a new strut-and-tie based model was proposed, yet validated with the experimental results in the current study as well as the test results for FRP- and steel-reinforced deep beams found in the literature.
Finally, numerical simulation of tested deep beams was performed using finite element analysis program (VecTor2; Wong and Vecchio 2002) to predict the deep beam’s response. The predictions were then compared to the experimental results. The comparison aims to provide insight to designers about the assumptions and limitations while utilizing FE application to overcome the inherent intricacies of nonlinear finite element analysis and to validate some hypotheses associated with the experimental results.
1.4 Thesis Organization
The thesis consists of seven chapters. The contents of each chapter can be summarized as follows:
Chapter 1 of this thesis presents background information on the research topic, the work
objective and the adopted methodology.
Chapter 2 introduces a literature review reporting the past known mechanism of
steel-reinforced deep beams. Additionally, the code provisions and the analytical models for steel— reinforced deep beams, in addition to code provision assessment using 470 deep beam tests from the literature are demonstrated. The effect of web reinforcement with different configuration on the behavior of steel-reinforced deep beams is presented. Finally, the background of reinforcing with FRP bars is provided.
Chapter 3 gives the details of the experimental program and the testing procedure. The
geometry and reinforcement details of the test specimens, web reinforcement configuration, test setup and procedure, and the instrumentation details are presented. In addition, detailed characteristics of the used materials are provided in Chapter 3.
Chapter 4 addresses the results the experimental investigation conducted in the research
program. The general behavior of the tested specimens is described in terms of cracking pattern and mode of failure, ultimate load and failure progression, and load-deflection response. The measured strains in longitudinal reinforcement are discussed to provide evidence on the formation of arching action and the applicability of STM. The effect of each configuration of web reinforcement on strength, deformability and serviceability of the tested specimens is also discussed.
Chapter 5 provides the derivation producer for the strut-and-tie based model. The STMs in
ACI and CSA provision were first used to predict the capacity of the tested deep beams, providing inappropriate estimation for the capacity. Additionally, the strut-and-tie based models derived for steel-reinforced deep beams based on theoretical fundamentals were used to predict the ultimate capacity of the tested deep beams. The affected parameters on the strut
efficiency factor were then detailed identifying their tendencies. Then, assessment of the proposed model against FRP- and steel-reinforced deep beams was presented.
Chapter 6 gives details about the finite element simulation for the tested FRP-reinforced deep
beams in terms of materials, models and meshing. The results from the FE simulation are compared to the experimental results regarding the load-deflection response, the ultimate capacities, crack pattern, mode of failure, and strain levels in reinforcement and concrete. Analysis based on the FE simulation was discussed to confirm some experiment findings reported in Chapter 4.
Chapter 7 presents a general conclusion of the results obtained from the experiments and
analyses with respect to the problems and observations discussed throughout the thesis in addition to recommendations for future work.
It worth mentioning that, Chapter 4, 5, and 6 were corresponding to three submitted technical papers in scientific journals as follows:
- Chapter 4: Mohamed, K., Farghaly, A. S., Benmokrane, B., “Effect of Vertical and Horizontal Web Reinforcement on the Strength and Deformation of Concrete Deep Beams Reinforced with Glass-FRP Bars,” Journal of Structural Engineering, ASCE, (submitted 30 December 2014).
- Chapter 5: Mohamed, K., Farghaly, A. S., Benmokrane, B., “Strut Efficiency Based Design for Concrete Deep Beams Reinforced with FRP Bars,” ACI Structural Journal, (submitted 4 March 2015).
- Chapter 6: Mohamed, K., Farghaly, A. S., Benmokrane, B., Neale K. W., “Nonlinear Finite Element Analysis of Concrete Deep Beams Reinforced with GFRP Bars,” Engineering Structures, (submitted 13 June 2015).
8
CHAPTER 2
LITERATURE REVIEW
2.1 Introduction
Numerous test investigations have been devoted to study the behavior of steel-reinforced deep beams. Results of these studies agreed that; strut-and-tie model is a rational method for the design of steel-reinforced deep beams, but with different limitations and exclusions. Strut-and-tie model (STM) has been incorporated in several codes and guidelines for practice, including the Canadian code (CSA S806 2012, CSA A23.3 2014 and CSA S6 2006) and the USA codes (AASHTO LRFD 2007 and ACI 318 2014).
A number of parameters affecting shear behavior have led to understand the shear failure mechanisms and predict the shear strength of deep beams. These parameters include concrete span-depth ratios, amount of longitudinal and web reinforcement, concrete compressive strength, and loading and support conditions. Different researchers have different techniques to identify these parameters. The current chapter will outline some of these researchers’ studies on steel- as well as FRP-reinforced deep beams.
2.2 Strength and Behavior of Deep Beams
Deep beam is defined by MacGregor (1997) as a beam in which a significant amount of load is carried to the supports by a compression thrust joining the load and the reaction. This occurs if a concentrated load acts closer than about 2d to the support, or for uniformly loaded beams with a span-depth ratio, ln/d, less than about 4 to 5; where: d is the depth of the member, ln is the total span of the member, and a is the distance between a concentrated load and the support.
The basis for this definition is that within a distance of d from a disturbance such as a concentrated load or support, the strain distribution in the member is nonlinear (Schlaich et al., 1987). Plane sections do not remain plane. Regions of nonlinear strain distribution along the
5/7 P
2/7 P d d D-Region d
P
d B-Region 3d D-Region D-Region
D-Region
a≤2d a>2d
Deep beam behavior Slender beam behavior
d
Principle tensile strain trajectory Principle compression strain trajectory
height of the cross-section are called D-regions where ‘D’ stands for discontinuity or disturbed. Regions of linear strain distribution are called B-regions where ‘B’ stands for Bernoulli or beam. The B- and D-regions of an asymmetrically loaded beam are shown in Figure 2.1 with the principal strain trajectories. In Figure 2.1, the portion of the beam to the right of the concentrated load is comprised entirely of D-regions and meets the deep beam definition given by MacGregor (1997). While the portion of the beam to the left of the concentrated load contains variety of D- and B-region, and explains the main behavior of slender beams.
Figure 2.1 - Strain distribution in deep and slender portion of RC beams
Paiva and Siess (1965) were early researchers investigating the shear strength and behavior of moderately (span-depth ratios from 2 to 6) steel-reinforced concrete deep beams. From the results of the tests, they concluded that an increase in the span-depth ratio has no effect on the beam failing in flexure but increases the shear strength of the beam particularly at low span-to-depth ratios. Further researchers found that strength of deep beams controlled by shear rather than flexural strength due to the small value of shear span-to-depth ratio (a/d) (Collins and Kuchma 1999; Oh and Shin 2001; Collins et al. 2008). The same results were reported for deep members with different span-depth ratio (L/d) (Manuel et al. 1971) and different load configurations including single point loading, two point loadings and distributed loads (Ramakrishnan and Ananthanarayana 1968, Brown and Bayrak 2007). Unlike flexural failures, reinforced concrete shear failures are relatively brittle and, particularly for members without stirrups, can occur without warning (Collins et al. 2008). An understanding of the
shear strength behavior of deep beams is an essential prerequisite for achieving optimum design and proportioning of such members.
Figure 2.2 - Shear failure of deep beams without stirrups (Collins and Kuchma, 1999) In general, reinforced concrete beams without web reinforcement resist shear stresses by means of five possible mechanisms: 1) shear resistance of the uncracked concrete compression zone, 2) aggregate interlock, 3) dowel action of the longitudinal reinforcement, 4) residual tensile stresses across cracks, and 5) arch action (ACI-ASCE Committee 1998, Razaqpur and Isgor 2006). The first four mechanisms are principal shear resistance mechanisms in slender beams, which commonly recognized as a truss mechanism (beam action). While the arch action occurs in deep beams in which the load is transferred directly from the load point to the support (ACI-ASCE Committee 1998, Aoyama 1993).
The expected failure mechanisms for beam shown in Figure 2.1 are illustrated in Figure 2.3. The left side of the beam represents the beam action while the right side for the arch action. As shown Figure 2.3(a), the beam action relies on diagonal tensile stresses in the web of the member. The tension in the cracked part of the beam is explained by the ability of the cracks to transfer shear through aggregate interlock. The stresses in the web reduce the tension force T in the bottom chord from its maximum value at mid-span to almost zero near the supports. The member fails when the interlocking of the cracks breaks down and diagonal crack propagates towards the loading point. Deep beams are able to make transition from beam
b) Arch action in deep beams T Crushing zones a=2d T=T max 5/7 P 5/7 P
a) Beam action in slender beams T=0 a=5d Dowel action Breakdown of aggregate interlock Diagonal crack T d 2/7 P 2/7 P
action to arch action, which consists of direct compression between the loading and support points, and constant tensile stresses in the longitudinal reinforcement (Figure 2.3(b)).
Figure 2.3 - Beam action and arch action in RC beams
Fenwick and Paulay (1968) explained that, because of the geometric incompatibility of the two mechanisms, with beam action typically being much stiffer than arch action, nearly all of the shear would be carried by beam action until this mechanism failed. After failure of the beam mechanism, an internal redistribution of stresses could occur and the remaining arch mechanism could then carry even higher shears if the distance between the applied load and the support was sufficiently short (Breña and Roy 2009).
In an attempt to identify the transition point between the beam and arch actions, Kani et al. (1967 and 1979) conducted 362 shear tests on concrete beams without stirrups. Using deep specimens contained a large quantity of longitudinal reinforcement (ρw = 2.8%), the study concluded that, when shear span-to-depth ratio (a/d) was less than approximately 2.5, however, a small decrease in shear span caused failure shear to greatly increase. These differences result from longer specimens being controlled by the breakdown of beam action while crushing of a concrete strut controls the shear strength of shorter spans. Figure 2.4 shows the effect of a/d ratio on shear behavior for simple supported beams without web reinforcement and subjected to two concentrated loads at third points as presented by Wight and MacGregor (2009).
Figure 2.4 - Effect of a/d ratio on the shear stress (Wight and MacGregor 2009) Reinforced concrete element subjected to shear stress would develop diagonal cracks at an angle inclined to the steel bars (Hsu, 1988). These cracks would separate the concrete into a series of diagonal concrete struts, which are assumed to resist axial compression. Together with the steel bars, which are assumed to take only axial tension, they form a truss action to resist the applied shear stresses. Hence, a truss model theory was proposed to simplify the forces transition in the truss action. With more investigations and studies for steel reinforced deep beams, the truss model was improved and simplified to be used for design of reinforced concrete deep beams, known later as strut-and-tie model.
2.3 Strut-and-Tie Model
The elastic theory is considered by researchers and practitioners to be the rational and appropriate basis for the design of cracked reinforced concrete beams loaded in bending, shear and torsion (Schlaich et al. 1987). Since all parts of a structure are of similar importance, an acceptable design concept must be valid and consistent for every part of any structure. Furthermore, since the function of the experiment in design should be restricted to verify or dispute a theory but not to derive it, such a concept must be based on physical models which can be easily understood and therefore are unlikely to be misinterpreted. For the design of structural concrete it was, therefore, proposed to generalize the truss analogy in order to apply it in the form of strut-and-tie model to every part of any structure (Schlaich 1987, Hsu, 1988). In the elastic stress distribution of deep members, significant shear is transmitted directly to
a a h d ha da l P P P P wst strut Tie θ Loading plate Supports plate node Strut Strut
the support by diagonal compression. This means that less redistribution is required after cracking, and it seem reasonable to apply strut-and-tie model to deep beams (Schlaich 1987). The use of strut-and-tie model (STM) allows for easy visualization of the flow of forces. In addition, these truss models represent all internal force effects and do not require separate flexure and shear models, as is the case for slender members analyzed with sectional approaches. STM is based on the lower-bound theory of plasticity and the capacity of the model is always less than the true capacity if the truss is in equilibrium and has sufficient deformation capacity to allow redistribution of forces into the assumed truss elements.
Strut-and-tie model was recommended by design provisions and among researchers to design discontinuity regions (D-region) in reinforced concrete structures. STM reduces complex states of stress within a D-region of a reinforced concrete member into a truss comprised of simple, uniaxial stress paths. Each uniaxial stress path is considered a member of the STM (Figure 2.5). Members of the STM subjected to tensile stresses are called ties; and represent the location where reinforcement should be placed. STM members subjected to compression are called struts. The intersection points of truss member are called nodes. Knowing the forces acting on the boundaries of the STM, the forces in each of the truss members can be determined using basic truss theory.
ha lb sinθ + ha cosθ θ lb CCT Node C T C ha lb sinθ + ha cosθ θ lb CTT Node T T C lb CCC Node C C C C lb lb sinθ + db cosθ db CCC Node C C
Most design specifications recognize three major node types: CCC, CCT, and CTT nodes. Figure 2.6 illustrates the different types of nodes. A node that connects only compressive forces is called CCC node; while CCT is a node under the action of one tension force and two (or more) compression forces. A CTT node connects one compression force and two (or more) tension forces. Finally, the node under tension forces only is called TTT node. The regions around the nodes are called nodal zones. An extended nodal zone can be used for the analysis of the stresses in the region, including determination of reinforcement anchorage requirements. The ACI 318 (2014) defines a nodal zone as a portion of a member bounded by the intersection of effective strut and tie widths.
Figure 2.6 - Types of STM node
Two truss models for the right side of the applied load (arch action) for the beam depicted in Figure 2.1 are provided in Figure 2.7. As noted previously, the left side of the beam presents the beam action and would be designed with sectional approach. The first model is a called a single- or one-panel truss model; the second is called a multiple- or two-panel truss model. Either model (or a combination of the two) is acceptable provided that equilibrium condition is met. The choice of the model is left to the designer provision. To avoid compatibility problems and for efficiency, it is good practice for the STM to agree well with the dominant
a) One-panel truss model 5/7 P 2/7 P 5/7 P a Tension tie Compression strut Node 5/7 P 2/7 P 5/7 P a Tension tie Compression strut Node
b) Two-panel truss model
a) Prism
strut b) Bottle-shaped strut
c) Fan strut Idealized
straight-line strut
mechanism of force transfer in the structure. However, the one-panel model was found to be the preferred mechanism for resisting loads in deep beams with limited amount of web reinforcement (Brown and Bayrak 2008).
Figure 2.7 - One- and two-panel truss models
Most research and design specifications specify the limiting compressive stress of a strut as the product of the concrete compressive strength, fc’, and an efficiency factor. The efficiency factor is often a function of the geometric shape (or type) of the strut and the type of the node. As discussed by Schlaich and Schäfer (1991), there are three major geometric shape classes for struts: prismatic, bottle-shaped, and compression fan (Figure 2.8). Prismatic and bottle shaped struts are the most basic type of strut, while fan truss are more practical for deep beams with distributed loading. Prismatic struts have uniform cross-sections.
1 0 1 1) Bent Cap 2) Corbel 3) Transfer
Beam 4) Pile Cap
Typically, prismatic struts are used to model the compressive stress block of a beam element as shown in Figure 2.8. Bottle-shaped struts are formed when the geometric conditions at the end of the struts are well defined, but the rest of the strut is not confined to a specific portion of the structural element. The geometric conditions at the ends of bottle-shaped struts are typically determined by the details of bearing pads and/or the reinforcement details of any adjoined steel. The best way to visualize a bottle-shaped strut is to imagine forces dispersing as they move away from the ends of the strut as in Figure 2.8.
One of the primary advantages of STM is its widespread applicability. In theory, any structural concrete member can be represented by a truss model of compression and tension elements and designed with STM principles. However, in cases where flexural theory and sectional approaches are valid, the use of STM is generally too complicated. It is most useful for applications where complicated states of stress exist such as deep beams, corbels, dapped-ends, post-tensioned anchorage zones, or other structural components with loading or geometric discontinuities. Some examples of structures with D-regions are provided in Figure 2.9. Additional background information on STM can be found in several references (Schlaich et al. (1987), Bergmeister et al. (1993), Collins and Mitchell (1997), and fib, (1999)).
2.4 Code Provisions for Deep Beam Design
Over the past several decades, new approaches to the shear design of structural concrete have been implemented in codes of practice. The current CSA S806 Code (2012), CSA S6 (2006), CSA A23.3 (2014) and AASHTO LRFD (2007) Bridge Design Specification adopt the use of STM for analysis and design for the shear strength of deep beams. In addition, ACI 318 (2014) depends on the same theory with different applying equations. This section provide a brief description for the STM based procedure used to design of deep beams implemented in each code provison.
2.4.1 Provisions of CSA S806 (2012) and CSA A23.3 (2014)
CSA-S806 (2012) adopted the equations used by CSA-A23.3 (2014) for steel-reinforced deep beams to design FRP-reinforced deep beams. Therefore, equations, limitations and definitions presented in this section are identical in both codes.
CSA-S806 (2012) defines deep beams as a member with a shear span-to-depth ratio of less than 2.0. CSA-S806 (2012) uses the STM to determine internal force effects near supports and the points of application of concentrated loads. Depending on the truss mechanisms, a series of reinforcing steel tensile ties and concrete compressive struts interconnected at nodes was recommended to be idealized to investigate the strength of the concrete structure, components, or region. According to the CSA-S806 (2012), the compressive force of the strut shall not exceed ϕc Ac fc’, where ϕc is the concrete resistance factor (ϕc=0.60), Acs is the effective cross-section area of the strut (Figure 2.6) and fcu is the limiting compressive strength of the strut. The value of fcu based on the modified compression field theory (MCFT) developed by Vecchio and Collins (1986). The MCFT uses equilibrium, compatibility, and stress-strain relationships to predict the shear response of cracked reinforced concrete elements. For members with only longitudinal reinforcement, the theory predicts that failure will occur when the shear stress on the crack faces required for equilibrium reaches the maximum shear stress that can be transmitted by aggregate interlock. The predicted failure shear stress decreases as the predicted width of the inclined crack increases. Thus, failure shear decreases as tensile
strain in the longitudinal reinforcement increases, which is called the strain effect, and as crack spacing near mid-depth increases, the size effect (Collins et al. 2008). The CSA-S806 (2012) equations for STM are presented as follows:
' 1 ' 85 . 0 170 8 . 0 c c cu f f f (2.1)
F
s F 2 1 0.002 cot (2.2) Where αs is the smallest angle between the compressive strut and the adjoining tie, εF is the tensile strain in the concrete in the direction of the tension tie and fc′ is the concrete strength. The stress limits in nodal zones depends on the nodal boundary conditions (Table 2.1).Table 2.1 - Efficiency factors for CSA-S806 (2012) and AASHTO LRFD (2007)
Strut and node efficiencies ( fc′) Efficiency factor
Struts
Strut with uniform cross section over its length Eq. (2.1) and (2.2) Bottle-shaped struts with minimum web reinforcement Eq. (2.1) and (2.2) Bottle-shaped struts without web reinforcement Eq. (2.1) and (2.2)
Struts in tension members Eq. (2.1) and (2.2)
All other cases Eq. (2.1) and (2.2)
Node
s Nodes bounded by compression or bearing CCC node 0.85
Nodes anchoring one tie CCT node 0.75
Nodes anchoring more than one tie CTT and TTT nodes 0.65
According to CSA-S806 (2012), structures, members, or regions (other than slabs or footings) that have been designed in accordance with STM shall contain an orthogonal grid of reinforcing bars near each face. The ratio of reinforcement area to gross concrete area shall be not less than 0.004 for GFRP and AFRP, and 0.003 for CFRP in each direction. The spacing of this reinforcement shall not exceed 200 mm for GFRP and AFRP, and 300 mm for CFRP bars. If located within the tie, the crack control reinforcement may also be considered as tie reinforcement.
It worth mentioning that, the CSA-A23.3 (2014) for the design of steel reinforced deep beams specify lower amount of web reinforcement (minimum ratio of steel web reinforcement shall be more than 0.003 in each direction). The relatively large amount of web reinforcement specified by CSA S806 (2012) is recommended to control the crack width, considering that
FRP-reinforced structures exhibit wider cracks compared to steel-reinforced structures. However, no experimental investigations were conducted to identify the appropriate amount of FRP web reinforcement required for control the crack width within the appropriate limits. The angle between the strut and any adjoining tie is explicitly considered in the CSA-S806 (2012) STM provisions. Therefore, no limit is placed on that angle. As the angle between the strut and the tie approaches zero, the strength of the strut also approaches zero. Although very small angles are allowed by CSA-S806 (2012), they become impractical due to the diminished efficiency factor of the strut. The diminished efficiency factors and the associated reductions in the allowable strength of struts encourage the design engineer to seek a more refined truss mechanism without such shallow angles.
2.4.2 Provisions of ACI 318 (2014) – Steel Reinforced Deep Beams
According to ACI 318 (2014), deep beams are members loaded on one face and supported on the opposite face so that compression struts can develop between the loads and the supports. In addition, deep beams should have either clear spans equal to or less than four times the overall member depth; or regions with concentrated loads within twice the member depth from the face of the support. Beginning in 2002, the ACI building code stated that deep beams should be designed using either nonlinear analysis or using the STM. Provisions for the use of STM were added as an appendix to the main body of the ACI Building Code in 2002. The ACI 318 (2014) provision, in Chapter 23, provides nominal capacities of the struts of a STM as a fraction of the specified compressive strength of the concrete
fce =0.85βsfc’ (2.3)
where βs is the strut efficiency factor (Table 2.2), fc′ is the concrete compressive strength, and fce is the effective compressive strength. For Eq. (A-4) in Section A.3.3 of ACI 318 (2014); (Eq. 2.3); reinforcement that crosses the anticipated crack is included. Struts that meet the minimum reinforcement criterion (Eq. 2.3) make up the second class of struts and those that do not meet the minimum reinforcement criterion make up the third classes of struts
sin i 0.003i si
bs
Strut α 1 As1 Axis of strut Strut boundary α2 As2 s2 s1
where Asi is the area of surface reinforcement in the i-th layer crossing a strut, si is the spacing of reinforcing bars in the i-th layer adjacent to the surface of the member, b is the width of the strut perpendicular to the plane of the reinforcing bars, and αi is the angle between the axis of the strut and the bars in the i-th layer of reinforcement crossing that strut as in Figure 2.10.
Table 2.2- Efficiency factors for ACI 318 (2014)
Strut and node efficiencies (0.85 fc′) βs
Struts
Strut with uniform cross section over its length 1.00 Bottle-shaped struts with reinforcement satisfying
Section A.3.3 (Eq. 2.22) 0.75
Bottle-shaped struts without reinforcement satisfying
Section A.3.3 (Eq. 2.22) 0.60
Struts in tension members 0.40
All other cases 0.60
Node
s Nodes bounded by compression or bearing CCC node 1.00 Nodes anchoring one tie CCT node 0.80 Nodes anchoring more than one tie CTT and TTT nodes 0.60
Additionally, ACI 318 (2014) place limits on the allowable stresses at the faces of the nodes (Table 2.2). The nodal efficiency factors are based on the elements that intersect to form the node and are listed in Table 2.2. The strength of a strut must be checked at its minimum cross-sectional area. For a strut, especially a bottle-shaped strut, the minimum area will occur at the ends of the strut where it abuts a node.
ACI 318 (2014), Chapter 23, also provides one more restriction on the modeling process. The angle between the axis of any strut and any tie entering a common node may not be less than 25 degrees. This provision stems from the idea that struts will lose capacity as they approach the direction of a tie. Clearly, a strut that is coincident with a tie will have no compressive capacity. The angle of 25 degrees was chosen to eliminate potential problems with struts that form a slight angle with a tie.
2.4.3 Provisions of AASHTO LRFD – Steel Reinforced Deep Beams
In 1994, the first edition of AASHTO LRFD Bridge Design Specifications (1994) referred to using the STM for the design and detailing of certain structural concrete members. The “AASHTO LRFD Bridge Design Specifications 2007” like ACI 318 (2014) places limits on the allowable stress at the faces of the nodes and struts. The AASHTO approach for the allowable stress in a strut, however, is also based on the modified compression field theory (MCFT) developed by Vecchio and Collins (1986) rather than the reinforcement ratios used by ACI 318 (2014). The compressive strength of the strut fcu calculated using the same equation of the CSA-S806 (2012) (Eq. 2.1 and 2.2). For the nodal stress limits, AASHTO LRFD (2007) also specifies factors based on the type of node (Table 2.1).When AASHTO LRFD (2007) strut-and-tie provisions are used, minimum horizontal and vertical shear reinforcement must be provided. Specifically, AASHTO LRFD (2007) requires that the ratio of reinforcement area to gross concrete area must be no less than 0.003 in each direction (horizontal and vertical).
2.4.4 Literature Assessment for Code Provisions
In the previous three sections, the STM design provisions of CSA A23.3 (2014), ACI 318 (2014), and AASHTO LRFD (2008) were listed. In this section, the implications of using each set of provisions to estimate the capacity of a deep beam are discussed. For the discussion, results obtained from the experimental strength of 470 deep beam tests from the literature were compared to the calculated strength using a single-panel STM with each set of design
provisions. The value of φ was equal to 1.0 in all calculations since the tests were conducted under laboratory conditions.
The assessment of the code provision was performed using the data reported in the following investigations: Clark (1952); De Pavia (1965); Kong et al. (1970); Kani et al. (1979); Fukuhara and Kokusho (1980); Niwa et al. (1981); Smith and Vantsiotis (1982); Kung (1985); Anderson and Ramirez (1989); Walraven and Lehwa (1994); Tan et al. (1995); Tan et al. (1997a); Tan et al. (1997b); Shin et al. (1999); Adebar (2000); Oh and Shin (2001); Aguilar et al. (2002); Lertsrisakulart (2002); Yang et al. (2003); Brown et al. (2006); Quintero-Febres et al. (2006); Zhang and Tan (2007a); Birrcher et al. (2009); and Mihaylov et al. 2010.
Only those references that provided sufficiently complete information on the test setup and material properties were used. This database is considered to be sufficiently large to enable a fair assessment of code provisions. The deep beams that were considered in this assessment include a/d ratios ranging from 0.27 to 2.50, concrete strengths that range from 13.8 to 99.4 MPa, and various combinations of web reinforcements. Beams that were described by the original authors as having a failure mode other than shear (anchorage and flexural failure) were not included in the database. A summary of deep beams is presented in Appendix A. In the STM, diagonal strut width, wst, was calculated from the geometry of the nodal regions according to the location of the node. The depth of the tie, ha, was defined by the location of the longitudinal reinforcement and was taking twice the distance between the soffit of the beam to the centroid of the longitudinal reinforcement. To calculate the depth of the top horizontal strut, hn; and thus the diagonal strut angle, α, an iterative process was done to choose the critical admissible solution and, hence, the maximum predicted shear strength. The iterative process included checking of the stresses at the node.
The results obtained from the steel-reinforced deep beam database are presented in Figure 2.11. The experimental strength was divided by the calculated capacity and plotted in a histogram. A value less than 1.0 implies that the experimental strength was unconservatively estimated. Contrary, a value greater than 1.0 implies a conservative estimate. The mean and coefficient of variation (COV) of the results for CSA A23.3 (2014) and ACI 318 (2014) provisions are presented as well.
Figure 2.11 - Evaluation of code provisions with steel-reinforced deep beam database The results indicate that the CSA A23.3 (2014) provisions provided uneconomically conservative estimations of strength; while the ACI 318 (2014) provided unsafe estimation for the strength of the deep beams. The mean experimental/predicted capacity value (Pexp/Ppred) in CSA A23.3 (2014) provision was 1.52, and the COV was 0.38. While the mean experimental-to-calculated capacity value (Pexp/Ppred) in ACI 318 (2014) was 0.87, and the COV was 0.40. The unconservative percentage was 16% and 65% for CSA A23.3 (2014) and ACI 318 (2014), respectively. These values indicate that the equations used by both provisions do not catch all the factors affecting the behavior of steel-reinforced deep beams, and led to unsatisfactory estimations of the capacity. The same conclusions were reported by Bahen and Sanders (2009), Brown and Bayrak (2008), and Collins et al. (2008).
The experimental-to-calculated capacity according to the two code provisions were compared by the percentage of the longitudinal reinforcement ratio (ρ%), concrete compressive strength (fc’) and percentage of web reinforcement (
i si
bs
A ) in Figure 2.12(a), (b) and (c), respectively. As can be notice from Figure 2.12(a), the ACI 318 (2014) gave more scatter estimations for the deep beam capacities associated with the longitudinal reinforcement strains compared to CSA A23.3 (2014) provision. This was mainly attributed to the STM according to ACI 318 (2014), unlike CSA A23.3 (2014), do not accounts for the effect of the longitudinal reinforcement ratio. 1 72 213 100 45 30 9 0 50 100 150 200 Pexp/Ppred
Conservative CSA A23.3 (2014)
0 1 2 3 4 5 N um be r of S pec im ens Min=0.42 Max=3.32 Mean=1.52 COV=38% 16% unconservative 165 138 5567 21 19 4 0 0 0 50 100 150 200 0 1 2 3 4 5 N um be r of S pec im ens Min=0.31 Max=4.62 Mean=0.87 COV=40% 65% unconservative ACI 318 (2014) Conservative Pexp/Ppred 1
0 1 2 3 4 5 0 1 2 3 4 5 6 7 8 0 1 2 3 4 5 0 1 2 3 4 5 6 7 8 C onse rv at ive ρ% Pexp /Ppr ed C onse rv at ive ρ% Pexp /Ppr ed 0 1 2 3 4 5 0 50 100 0 1 2 3 4 5 0 50 100 C onse rv at ive ACI 318 (2014) fc’ (MPa) Pexp /Ppr ed C onse rv at ive CSA A23.3 (2014) fc’ (MPa) Pexp /Ppr ed 0 1 2 3 4 5 0 1 2 3 4 5 0 1 2 3 4 5 0 1 2 3 4 5 C onse rv at ive ACI 318 (2014) i si bs A Pexp /Ppr ed C ons er vat ive CSA A23.3 (2014)
i si bs A Pexp /Ppr eda) Longitudinal reinforcement ratio (ρ%)
b) concrete compressive strength (fc’)
c) Web reinforcement ratio (
i si
bs A )
Figure 2.12 - Experimental/calculated capacity for the steel-reinforced deep beams in the database
Figure 2.12(b) shows that the two provisions gave very conservative estimation for deep beams with high strength concrete, for a compressive strength more than approximately 50
MPa. However, the level of conservatism was more pronounced in case ACI 318 (2014). Bahen and Sanders (2009) indicated that the estimations of ACI 318 (2011) and AASHTO LRFD (2008) were very conservative for concrete strengths greater than 48 MPa and 41 MPa, respectively. As mention before, AASHTO LRFD (2007) provision uses the same equations, limitations and exclusions as CSA A23.3 (2014).
In order to assess the adequacy of the two code provisions for the steel-reinforced deep beams with web reinforcement, specimens without web reinforcement were excluded from the database in Figure 2.12(c), resulting in a total number of 319 specimens. Unlike ACI 318 (2014), CSA A23.3 (2014) requires minimum web reinforcement in steel-deep beams for crack control only without any effect on the ultimate strength of the deep beams. On the other hand, ACI 318 (2014) specifies a percentage of minimum web reinforcement to increase the load carrying capacity of the deep beams in addition to the crack control. However, CSA A23.3 (2014) gave more accurate predictions for deep beams’ capacity with web reinforcement compared to ACI 318 (2014). Nevertheless, ultimate strength estimations for deep beams with web reinforcement using both codes still very conservative.
Specifications of Canadian codes (CSA S23.3 2014, CSA S806 2012, and CSA S6 2014) calculate the strut strength based on the Modified Compression Field Theory (MCFT) (Vecchio and Collins, 1986). The conducted testing scheme (Vecchio and Collins, 1982) made the compressed concrete – in the direction of the compressive stresses – subjected to tensile strain in the perpendicular direction, which was distributed along the length of the panel edge. During testing, compressive and tensile strains were measured using perpendicular LVDTs attached to the panels along its length to measure the smeared/average strain across the formed cracks.
Accordingly, to accurately predict the ultimate capacity of the deep beams, the average strain along the diagonal strut should be determined through a series of LVDTs attached across the diagonal strut and along its length, which is impractical and could be achieved only through experimental testing.
Therefore, the Canadian specifications assume the tensile strain in the concrete is equal to the tensile strain in the main longitudinal reinforcement (tie). The commentary on CSA S6 (2014) Clause C8.10.3.3 and CSA A23.3 (2014) Clause C11.4.2.3 explained that the tie reinforcement is surrounded by the concrete in the diagonal strut, and if these tensile strains increased, fcu will decreased. This was also observed in FRP-reinforced deep beams (Farghaly and Benmokrane 2013) as increasing the axial stiffness of the tie increased the efficiency of the diagonal strut by increasing the ultimate strength. In addition, the Canadian specifications require a minimum web reinforcement to be placed to act as ties for the diagonal strut and distribute the forces along the strut (Commentary on CSA S6 (2014) Clause C8.10.2 and CSA A23.3 (2014) Clause C11.4.1, and CSA S806 (2012) Clause C8.5.1.
These assumptions over-estimate the average strain, however, it under-estimate the ultimate capacity of the deep beams and lead to conservative, yet safe, predictions. Generally, more investigation is necessary to elaborate over determination of the strain along the diagonal strut length specifically close to the upper node as the deep beams fail mainly due to crushing in the diagonal strut close to the upper loading node.
2.5 Web Reinforcement Effect on Deep Beams’ Strength
Researchers are disagreeing regarding the exact effect of web reinforcement on strength of steel-reinforced deep beams. For instant, previous experimental and analytical researches noted that the presence of conventional web reinforcement in the form of vertical stirrups or horizontal bars had little, if any, effect on the strength of the inclined strut. Such reinforcement may delay the cracking process, and this may cause only a small increase in the load carrying capacity of the inclined strut (Mihaylov et al. 2010, Tan et al. 2003, Smith and Vantsiotis 1982). Other researchers reported that web reinforcement is not required for enhancing the efficiency of the concrete strut (Birrcher et al. 2013, Tuchscherer et al. 2010, Brown and Bayrak 2007). This section briefly describes the conducted investigations for the effect of web reinforcement on strength of steel-reinforced deep beams.
Notwithstanding, the use of nominal web reinforcement is considered essential for crack control purposes, because it reduces the likelihood of ‘instability’ failures due to the