This is an author-deposited version published in:
http://oatao.univ-toulouse.fr/
Eprints ID: 4905
To link to this article: DOI:10.1016/j.jelechem.2010.06.007
URL
:
http://dx.doi.org/10.1016/j.jelechem.2010.06.007
To cite this version:
Sekli-Belaidi, Fadhila and Temple-Boyer, Pierre and Gros,
Pierre Voltammetric microsensor using PEDOT-modified gold electrode for the
simultaneous assay of ascorbic and uric acids. (2010) Journal of Electroanalytical
Chemistry, 647 . pp.159-168. ISSN 1572-6657
O
pen
A
rchive
T
oulouse
A
rchive
O
uverte (
OATAO
)
OATAO is an open access repository that collects the work of Toulouse researchers and
makes it freely available over the web where possible.
Any correspondence concerning this service should be sent to the repository
administrator:
[email protected]
Voltammetric microsensor using PEDOT-modified gold electrode for the
simultaneous assay of ascorbic and uric acids
Fadhila Sekli-Belaidi
a,b, Pierre Temple-Boyer
c,d, Pierre Gros
a,b,*aUniversité de Toulouse, 15 rue des Lois, 31000 Toulouse, France
bLaboratoire de Génie Chimique UMR CNRS/INP/UPS 5503, Université Paul Sabatier, 31062 Toulouse cedex, France cCNRS – LAAS, 7 avenue du colonel Roche, F-31077 Toulouse, France
dUniversité de Toulouse, UPS, INSA, INP, ISAE, LAAS, F-31077 Toulouse, France
Keywords:
Electrochemical microsensor PEDOT film
Electrocatalytic behavior Ascorbic and uric acids assay
a b s t r a c t
A voltammetric microsensor has been developed for the simultaneous assay of ascorbic (AA) and uric (UA) acids in aqueous solution. The electrode surface has been modified by means of electropolymerized conduc-tive poly(3,4-ethylenedioxythiophene) PEDOT organic films. The electrocatalytic activity of the interface was dependent on the electropolymerization parameters inducing change in the structure and the mor-phology of the resulting polymer. The PEDOT thickness was optimized in order to maximize the peak poten-tial separation between both acids oxidation to more than 400 mV. By using differenpoten-tial pulse voltammetry (DPV), the sensitivity of the microsensor was 0.87lAlMÿ1cmÿ2and 4.05lAlMÿ1cmÿ2for AA and UA respectively. The later was sensible to the presence of AA in the mixture, making evidence of the catalytic mechanism of UA regeneration. The calibration curves were linear in the concentration range 5.0– 300lmol Lÿ1for AA and 2.0–600lmol Lÿ1for UA. The detection limits were 2.5lmol Lÿ1and 1.5lmol Lÿ1 respectively. The sensor response was unmodified in the presence of the major electroactive biomarkers. The application of the PEDOT modified microsensor to the analysis of human blood serum was evaluated.
1. Introduction
Ascorbic acid (AA) and uric acid (UA) are both present in most of the biological fluids (plasma, serum, urine, tears, cerebrospinal flu-ids). At physiological levels, AA is a powerful water soluble antiox-idant. It plays a key role in protecting living cells against oxidative injury and has been used clinically for the treatment and preven-tion of scurvy, common cold, mental illness, cancer and AIDS
[1–4]. In the reverse, extreme AA levels can cause gastric irritation, diarrhea and renal problems[2]. The role of UA in conditions asso-ciated with oxidative stress is not entirely clear. While commonly regarded as an indicator of gout, epidemiological studies suggest that high UA levels in serum represent a risk factor for cardiovas-cular diseases[5], uric acid stones[6]and Lesch–Nyhan syndrome
[7]. Both ascorbic and uric acids are useful in the monitoring of oxidative stress and moreover may be considered as biochemical markers in a lot of pathologies (neonatal hypoxia, coronary heart diseases. . .). Thus the selective and convenient detection of AA and UA is very important for biological researches as well as for routine analysis. This explains the numerous methods dedicated to their qualitative and quantitative determination.
Usual procedures for the quantitative determination of AA and UA are generally based on enzymatic methods[8], spectrofluorom-etry[9], HPLC analysis[10]or capillary electrophoresis[4]. How-ever these methods suffer from costly materials and complex experimental protocols, require sample pretreatment and are gener-ally time consuming. In the last two decades, electrochemical proce-dures have been greatly employed due to their advantages such as simplicity, low cost, fast analysis and good selectivity[11]. More-over, microelectrodes present some unique features that make their use advantageous as electrochemical sensors, i.e. enhanced mass transport rate of electroactive species to the electrode surface, re-duced double-layer capacitance and less susceptibility to ohmic drop[12]. These characteristics make it possible to perform analysis in short time scales and in relative resistive media with enhanced sensitivity[13,14]. Furthermore measurements can be done without any added electrolyte and steady state currents are obtained with-out stirring the solution. However, a major problem is that AA and UA require generally high overpotentials on usual non-modified bare electrodes. Furthermore both acids are in these conditions oxi-dized at very close potentials which make their simultaneous detec-tion and quantitative determinadetec-tion difficult[15].
Various approaches have been attempted to solve these prob-lems. Chemically modified electrodes have been particularly devel-oped to discriminate between the electrochemical responses of AA and UA oxidation. Several electrode modification processes have
* Corresponding author at: Université de Toulouse, France. Tel.: +33 (0) 5 61 55 82 69; fax: +33 (0) 5 61 55 61 39.
been tested, using highly oxidized metal electrodes [16], metal electrodeposition [17], metal complexes[18,19], electrochemical reduction of diazonium salts[20], mesoporous silica [21], single
[22] or multiwalled carbon nanotubes[23], self-assembled thiol monolayer[24], ion-exchange Nafion membrane[25]or conduct-ing polymers like poly vinyl alcohol[26], polypyrrole[27]or lumi-nol[28]for measurements in rat brain[29]or in human urine and serum samples [30]. All these studies allowed the simultaneous detection and determination of AA and UA under similar concen-trations[31–33]or the assay of UA in samples containing a large excess of AA[34–36]. The analytical performances of these modi-fied electrodes are listed inTable 1.
Concerning electrochemically generated polymers, attention has been devoted since the mid-1990s to poly(3,4-ethylenedioxy-thiophene) (PEDOT) [37]and its derivatives [38,39]. These poly-mers induce uniform and adherent polymer films on most of electrode materials, show quite high conductivity in their oxidized state, present a good stability in aqueous electrolytes and above all biocompatibility with biological media[40]. Moreover PEDOT was found to be resistant to fouling by the AA oxidation products[41], thus indicating PEDOT to be very promising in the design of amper-ometric sensors. Surprisingly works devoted to the detection of UA and AA by means of PEDOT modified electrodes are very scarce. In most of them AA and/or UA are considered as interfering species, particularly for the assay of dopamine[42–45]. To our knowledge the only paper dealing with the simultaneous detection of UA and AA was from Kumar et al.[41]. In this study UA was assayed in the presence of AA in large excess (in the ratio 1:1000), which does not reflect the healthy human situation (the concentration of AA in blood serum being one order of magnitude lower than that of UA in physiological conditions[4,46]). Consequently AA was only de-tected and not assayed while its quantification represents a task of interest as well important as UA in clinical analysis. The aim of our work is then to evaluate PEDOT modified electrodes to selec-tively detect and simultaneously determine ascorbic and uric acids in aqueous solution.
Many studies have focused on the influence of the electropoly-merization conditions on the morphological, structural and physi-cal properties of PEDOT films[37,47–53]. In contrast, only a few
studies have been concerned with the role of the PEDOT polymer-ization conditions on the amperometric response of the resulting sensors. In particular, to the best of our knowledge works dealing with the influence of PEDOT electropolymerization parameters on the electrochemical detection and the simultaneous assay of AA and UA has not been reported so far. In this paper the electro-chemical behavior of the modified electrode has been highlighted depending on the electrochemical parameters used for the voltam-metric PEDOT deposition (potential range, potential scan rate). In addition, the influence of the experimental conditions (monomer concentration, polymer film thickness) on the analytical perfor-mances of the resulting sensor is discussed.
2. Experimental 2.1. Chemicals
3,4-Ethylenedioxythiophene (EDOT) was purchased from Aldrich. Ascorbic acid (AA), uric acid (UA), dopamine, xanthine, hypoxanthine, glutamic acid, cysteine, N-acetyl-L-cysteine (NAC)
and b-Dglucose were purchased from Sigma. Tetrabutylammonium
perchlorate (TBAPC), potassium dihydrogenophosphate KH2PO4,
di-potassium hydrogenophosphate K2PHO4 and acetonitrile were
purchased from Acros. All reagents were of analytical grade and used as received. The aqueous solutions were prepared with dou-bled distilled water. High pure nitrogen was used for deaeration.
2.2. Materials
All electrochemical experiments were performed with an Auto-lab Metrohm potentiostat (Eco-Chimie) interfaced to a microcom-puter and using the GPES 4.9 software. A three-electrode system was used for all the experiments. A 50
l
m diameter gold wire was purchased from Goodfellow (Lille, France) and used as work-ing electrode. Microelectrodes were fabricated and characterized according to the procedure described by Ruffien-Ciszak et al.[54]. The protocol involved glass capillaries from Clark Electromed-ical Instruments (Phymep, Paris, France), a microelectrode puller
Table 1
Comparison of the analytical performances of different electrochemical microsensors for the determination of ascorbic (AA) and uric (UA) acids.
Ref. Ep/mV vs. SCE DEp/mV Sensitivity/lAlMÿ1cmÿ2 Limit of detection/lM Linear range/lM
AA UA AA UA AA UA AA UA [16] 200 599 399 – – 100 0.2 100–7000 0.2–60 [17] –100 300 400 – – – 0.01 1–40 20–50 [18] 5 320 270 0.645 3.97 5 0.5 9–2000 2–400 [19]* 314 400 104 0.116 0.156 0.1 0.06 0.5–100 0.1–100 [20] 263 600 337 0.167 89.32 0.3 14 2–20 150–600 [21] 0 250 250 – – 10 0.24 40–4000 0.5–75 [22] 13 376 363 0.283 84.35 5 0.2 30–400 0.06–10 [23]* – 252 – – 0.078 – 0.17 – 3.3–96.3 [24] 120 380 260 0.382 0.741 – 1 – 1–300 [26] 6 330 324 7.12 24.88 7.6 0.6 10–250 2–50 [28]* 29 295 266 Excess 0.06 – 2 – 30–1000 [29]* 50 – – 0.0048 – 40 – 100–1000 – [30] 270 460 190 – – 0.5 0.08 1–80 0.4–100 [31] 280 610 330 3.50 11.46 1.43 0.016 5–240 0.1–18 [32] 210 480 270 1.41 1.91 – – – – [33] 104 327 223 6.98 7.26 2 2 5–160 5–300 [34] 6 410 404 1.40 2.39 0.92 0.57 30–240 10–80 [35] 3 300 297 0.044 0.815 15 0.18 75–3000 0.74–230 [36] 5 300 295 Excess 2.80 – 1 – 1–50 [41] –35 335 370 Excess 6.76 – 1 – 1–20 [42] 100 420 320 – – – – – – [43] 8 – – 0.169 – – 6 300–1500 – [44] 100 350 250 – – – – – – This work –94 308 403 0.875 4.05 2.5 1.5 5–300 2–600
(Model PC 10) and a microgrinder (Model EG44) purchased from Narishige (London, UK). A 1 mm diameter platinum wire (1 cm length) was used as auxiliary electrode. All potentials reported in the text are referred to a saturated calomel reference electrode (SCE) (Hg/Hg2Cl2/KClsat) connected to the cell by a Luggin capillary.
2.3. Preparation of PEDOT-modified gold microelectrodes
The procedure of PEDOT electrodeposition on gold microelec-trodes was similar to that reported by Kumar et al.[41]. A gold disk microelectrode was polished with alumina slurry and rinsed with distilled water. The polished surface was then pretreated by cy-cling the electrode potential between ÿ0.88 V and 1.5 V for 10 min at 10 mV sÿ1 in 20 mL deaerated acetonitrile containing
0.1 mol Lÿ1TBAPC as supporting electrolyte. Deaeration was
ob-tained by purging the solution with nitrogen during 10 min; more-over a nitrogen atmosphere was maintained more-over the solution during the experiments. The electropolymerization was performed in deaerated acetonitrile containing different concentrations of EDOT monomer and 0.1 mol Lÿ1TBAPC. The polymer was
synthe-sized by cycling the electrode potential between ÿ0.88 V and a var-iable upper potential (see results). The scanning potential rate, the monomer concentration and the number of potential cycles were also variable. The modified electrode was then rinsed with acetoni-trile and distilled water successively to remove any physically ad-sorbed monomer. This modified electrode is hereafter referred to as
l
Au-PEDOT.2.4. Electrochemical detection of AA and UA
The
l
Au-PEDOT was immersed in a three-electrode cell, where a nitrogen flux was constantly maintained. Experiments were per-formed in 10 mL deaerated phosphate buffer solution (PBS) pH 7.0 containing well-known amounts of AA and/or UA. Two electro-chemical methods were applied, i.e. cyclic voltammetry (CV) and differential pulse voltammetry (DPV). Cyclic voltammograms (CVs) were plotted between ÿ0.2 V and 0.6 V (unless otherwise indicated), with a potential scan rate of 50 mV sÿ1, thus avoidingthe reduction of water and the oxidation of gold as well as the ove-roxidation of PEDOT which would irreversibly result in a non-con-ducting polymer [55]. For differential pulse voltammograms (DPVs), the potential waveform was optimized with respect to the determination of AA[56]: pulse amplitude 50 mV, step
poten-tial 6 mV, pulse time 119 ms, interval time 1 s, potenpoten-tial scan rate 6 mV sÿ1. The particular features of the microelectrodes made it
possible to perform experiments without stirring the solution. 2.5. Blood serum analysis
Human blood serum was kindly given by the Laboratoire de Biochimie from Hôpital Rangueil – Toulouse and stored at 4 °C be-fore being used. Owing to the microelectrode size, experiments were realized in 250
l
L sample volume. Furthermore no electro-lyte was added and the sample was undiluted and not stirred. Elec-trochemical measurements were performed by DPV using the same potential waveform described in Section 2.4. The sample was left to come at room temperature before the analysis. 3. Results and discussion3.1. PEDOT electrodeposition
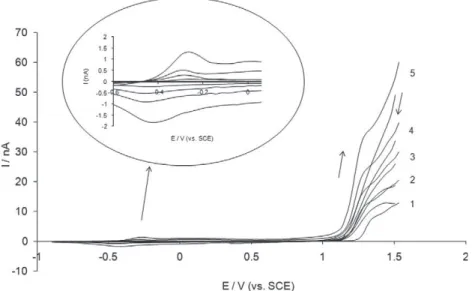
Fig. 1 shows five successive cyclic voltammograms recorded during EDOT electropolymerization. The oxidation of the monomer began at about 1 V on the first potential cycle and the anodic cur-rent reached a peak value at 1.3 V. In the reverse scan, the curcur-rent decreased with a crossover at about 1.2 V. By analogy with metal deposition process, this ‘‘nucleation loop” reveals a nucleation pro-cess of the polymer film[57]. On the following cycles, the oxidation reaction was shifted to more cathodic potential values. This phe-nomenon is related to the fact that the oligomers produced can be oxidized more easily than the monomer[58]. The anodic cur-rent increased from cycle to cycle consequently to the growth of a conductive PEDOT film, thus increasing the apparent surface of the active electrode. The voltammograms also revealed a quasi-reversible signal at a potential close to ÿ0.3 V corresponding to the redox activity of the polymer. Both anodic and cathodic peak currents increased with the number of potential cycles, thus depending on the amount of polymer synthesized on the electrode surface.
3.2. Electrochemical behavior of AA and UA on PEDOT modified electrode
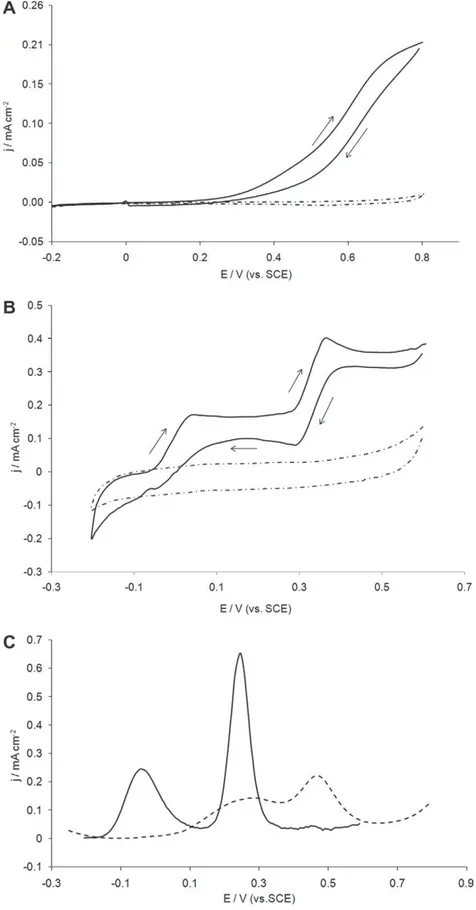
Fig. 2shows cyclic voltammograms recorded with a bare-gold microelectrode (Fig. 2A) and a
l
Au-PEDOT modified electrodeFig. 1.Successive CVs obtained with a 50lm diameter Au microelectrode in a deaerated 0.1 mol Lÿ1TBAPC–acetonitrile containing EDOT 10 mmol Lÿ1. Potential scan rate:
(Fig. 2B) immersed in an equimolar solution of AA and UA 1 mmol Lÿ1. The PEDOT modified electrode was obtained by
cy-cling the potential of the gold microelectrode five times between
ÿ0.88 V and 1.5 V with a scan rate of 100 mV sÿ1in the electropo-lymerization solution containing EDOT 10 mmol Lÿ1. Whatever the
electrode, no significant signal was observed in PBS pH 7.0 except
Fig. 2.(A) and (B) CVs obtained with (A) a 50lm Au microelectrode and (B) alAu-PEDOT modified electrode in PBS pH 7.0 (dotted line) and in an equimolar solution of AA and UA 1 mmol Lÿ1pH 7.0 (solid line). (C) DPVs recorded with a 50lm Au microelectrode (dotted line) and alAu-PEDOT (solid line) in the equimolar AA/UA solution.
for the electro-oxidation of gold starting at about 0.8 V. The oxida-tion of AA and UA on the unmodified electrode resulted in a broad anodic current. Two overlapped waves were present with half-wave potentials E1/2close to 0.4 V and 0.6 V for AA and UA
respec-tively. These results are in agreement with previous works making evidence that both antioxidant species cannot be detected selec-tively on bare electrodes[15]. In contrast, two well-defined oxida-tion signals were recorded with the
l
Au-PEDOT electrode. The anodic peak potentials for AA and UA were shifted to more nega-tive values, i.e. ÿ0.037 V and 0.33 V respecnega-tively, making the sen-sor less sensitive to possible interfering species when used in real media. The potential difference was more than 300 mV, thus allowing the simultaneous detection of both species with the same modified electrode. The peak separation was attributed to different surface accumulations by means of electrostatic and hydrophobic attractions. Several papers reported that conducting polymers coated on electrode surfaces contain a distribution of reduced and oxidized forms[59,60]. Ascorbic acid (pKa= 4.1) being in itsanionic form at physiological pH interacts electrostatically with the positively charged oxidized regions of the polymer. On the other hand, Schöpf and Kößmehl[61]reported that the reduced
form of polythiophene was hydrophobic in nature. Uric acid (pKa= 5.4) is more hydrophobic than AA and is therefore
concen-trated in the PEDOT matrix because of hydrophobic interactions. These interactions certainly explain also why the amperometric re-sponses at
l
Au-PEDOT (0.17 and 0.39 mA cmÿ2) were 2 and 3.5fold higher for AA and UA 1 mmol Lÿ1respectively compared to
those obtained on the unmodified electrode, thus improving the sensitivity of the sensor. Anyway the PEDOT modified electrode clearly demonstrates a catalytic activity for the oxidation of both antioxidant species.
Similar experiments were performed by differential pulse vol-tammetry (Fig. 2C). Results have led to the same conclusions, i.e. a broad non exploitable amperometric response with the bare-gold microelectrode and two distinct anodic peaks when using the
l
Au-PEDOT. By optimizing the potential waveform[56], it was possible to shift the peak potentials to even more cathodic values, i.e. ÿ0.039 V and 0.246 V for AA and UA oxidation respectively. Fur-thermore the response sensitivity was sensibly improved com-pared to that recorded by CV, i.e. 0.23 and 0.62 mA cmÿ2for AAand UA 1 mmol Lÿ1respectively. DPV was then chosen in all the
following electrochemical detection experiments.
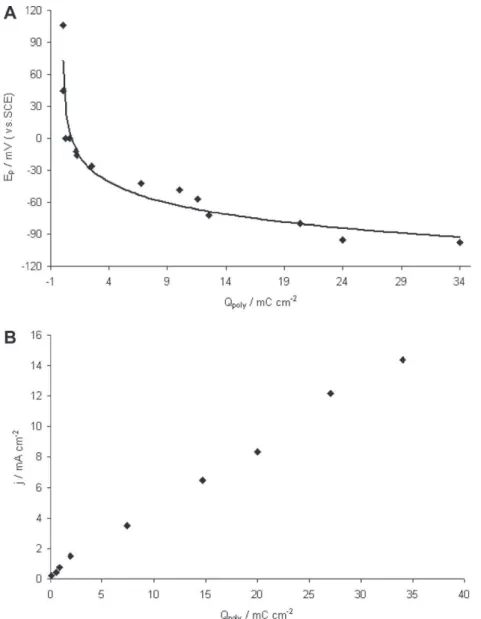
Fig. 3.Effect of the polymerization charge density on (A) the peak potential and on (B) the peak current density recorded for the oxidation of AA 1 mmol Lÿ1pH 7.0 on al
Au-PEDOT modified electrode by DPV. The polymerization was performed by cyclic voltammetry between ÿ0.88 and 1.5 V vs. SCE at 100 mV sÿ1in 0.1 TBAPC–acetonitrile
containing EDOT 10 mmol Lÿ1.
3.3. Influence of the electropolymerization parameters 3.3.1. PEDOT film thickness
As the improved detections of AA and UA result from particular interactions with PEDOT, investigation have been done concerning the effect of the PEDOT film thickness. The later was varied consec-utively to the number of potential cycles between ÿ0.88 V and 1.5 V at 100 mV sÿ1 in TBAPC–acetonitrile containing EDOT
10 mmol Lÿ1. However it was easier to control the polymer
thick-ness by means of the total charge consumed during the electropo-lymerization step since the charge consumed during one potential cycle did not keep a constant value from cycle to cycle. Different charge densities ranging from 1 to 34 mC cmÿ2have been tested.
Voltammograms were then recorded in PBS pH 7.0 containing AA and UA 1 mmol Lÿ1.Fig. 3shows the analytical performances
ob-tained for AA oxidation in terms of peak potential (Fig. 3A) and of peak current density (Fig. 3B). From these results two major con-clusions can be given: increasing the polymer film thickness im-proves the heterogeneous electron transfer rate of AA oxidation since the peak potential shifted to more cathodic values; the active surface area of the electrode increases with the polymer growth since the peak current density corresponding to AA oxidation also increased. In consequence both selectivity and sensitivity of the sensor were improved. Similar results have been obtained with UA (data not shown). The evolution of the oxidation peak poten-tials for both antioxidant species as a function of the electropoly-merization charge is indicated in Table 2. The most important shift in the oxidation potential occurred with charge densities ranging from 1 to 12 mC cmÿ2. In this later case, the potential
dif-ference reached 380 mV. Increasing further the thickness of the film did not improve significantly the selectivity of the sensor. Pre-vious studies have shown that thin films are compact while the polymer becomes more ordered and conjugated with thickness, inducing a higher conductivity [37]. It was also suggested that the increase of the PEDOT thickness makes the polymer more hydrophilic [53]. Since AA and UA are hydrophilic compounds, their interactions with the film would thus be amplified. It can be concluded from the above results that the morphology and structural properties of electrogenerated PEDOT films have consid-erable effects on the analytical performances of the sensor. In order to improve significantly the selectivity of the modified electrode without synthesizing a too thick polymer film, all the following experiments have been performed with an electropolymerization charge of 12 mC cmÿ2.
3.3.2. Monomer concentration
Several experiments were performed by changing the concen-tration of the monomer from 2.5 mmol Lÿ1 to 20 mmol Lÿ1. All
the electrodes were realized by cycling the electrode potential
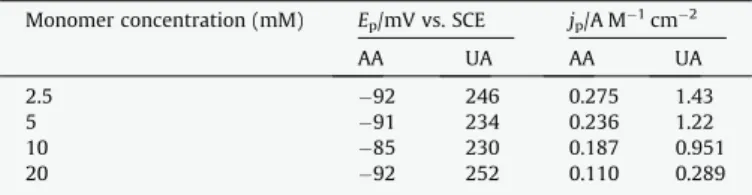
be-tween ÿ0.88 V and 1.5 V with a total electropolymerization charge of 12 mC cmÿ2.Table 3shows the analytical performances in terms
of peak potential and of peak current density for the oxidation of AA and UA 1 mmol Lÿ1by DPV. Whatever the modified electrode,
AA and UA oxidations occur approximately at the same potentials, i.e. ÿ90 ± 3 mV and 240 ± 9 mV respectively. On the contrary, the sensitivity for both substrates was strongly dependent on the com-position of the polymerization solution: the lower the monomer concentration, the higher the electrocatalytic activity of PEDOT film. This result is in agreement with previous studies showing that high monomer concentrations produce loose, poorly conducting films containing significant amounts of soluble oligomers, whereas low monomer concentrations improve both the cohesion and the conductivity of the polymer[37,47].
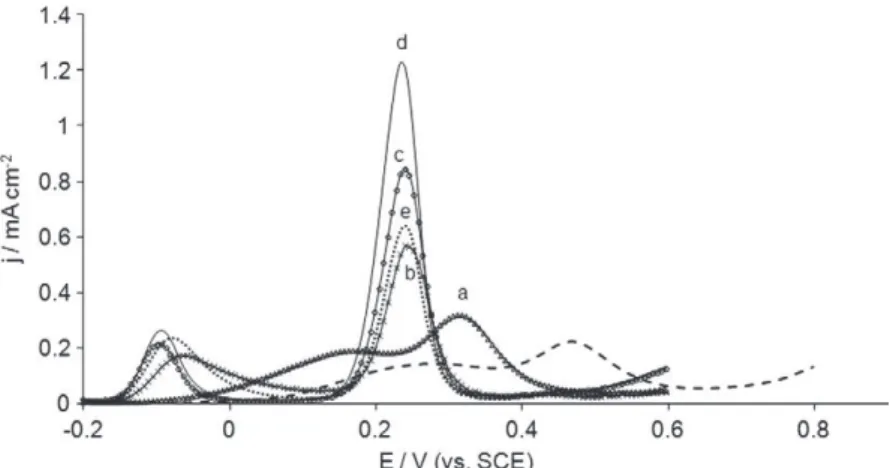
3.3.3. Electropolymerization potential range
Previous works have shown that the morphology of PEDOT films depends on the potential range used for electropolymeriza-tion: it changes from globular to fibrous morphology by increasing the upper potential limit with a significant enhancement of the porosity of PEDOT film[48]. In order to show the influence of the potential range on the analytical performances of the voltammetric sensor, the following experiments were performed. Several modi-fied electrodes were elaborated by changing the upper potential boundary from 1.2 V to 2 V. They were then tested in an equimolar solution of AA and UA 1 mmol Lÿ1pH 7.0. Results are shown in Fig. 4. When the upper potential was less than 1.2 V (curve a), a large oxidation signal was observed for the oxidation of AA and UA. This behavior was quite similar to that observed with the unmodified electrode, even if the curve was slightly shifted to cathodic potentials in the former case. When the upper potential reached 1.3 V (curve b), two well defined and separate peaks were recorded at ÿ0.1 V and 0.23 V. Further increase of the upper poten-tial to 1.5 V did not significantly improve the detection selectivity for both acids (curves c and d). However both peak current densi-ties increased with the upper potential boundary, thus improving the sensitivity of the sensor. When the upper electropolymeriza-tion potential was beyond 1.5 V, a second anodic peak appeared at about 1.6 V during the electropolymerization step, correspond-ing to the overoxidation of the polymer [48](result not shown). Overoxidation of PEDOT is known to reduce irreversibly its con-ductivity [55]. Consistently the DPVs of the resulting modified electrode highlighted that the peak current densities correspond-ing to the oxidation of AA and UA decreased (Fig. 4, curve e). Finally by increasing the upper potential to 2 V during the electropolymer-ization step induced a serious degradation of the polymer because the solvent was oxidized in the same time. In order to keep the electroactivity of the polymer while maximizing the sensitivity of the resulting sensor, the upper potential was limited to 1.5 V. 3.3.4. Potential scan rate during electropolymerization
Fig. 5shows the DPVs obtained for AA and UA oxidation when adopting various potential scan rates ranging from 50 to
Table 3
Variation of the peak potential and of the peak current density for the oxidation of AA and UA 1 mmol Lÿ1pH 7.0 by DPV as a function of the concentration of EDOT
monomer in the polymerization solution. PEDOT films were synthesized by cyclic voltammetry between ÿ0.88 V and 1.5 V vs. SCE at 250 mV sÿ1with a total charge of
12 mC cmÿ2.
Monomer concentration (mM) Ep/mV vs. SCE jp/A Mÿ1cmÿ2
AA UA AA UA 2.5 ÿ92 246 0.275 1.43 5 ÿ91 234 0.236 1.22 10 ÿ85 230 0.187 0.951 20 ÿ92 252 0.110 0.289 Table 2
Influence of the PEDOT polymerization charge density on the peak potential for the oxidation of AA and UA 1 mmol Lÿ1pH 7.0 by DPV. PEDOT films were synthesized by
cyclic voltammetry between ÿ0.88 V and 1.5 V vs. SCE at 100 mV sÿ1in 0.1 mol Lÿ1
TBAPC–acetonitrile containing EDOT 10 mmol Lÿ1.
Q/mC cmÿ2 E
pAA/mV vs. SCE EpUA/mV vs. SCE DEp/mV
0 263 475 212 0.2 20 357 337 0.6 0 347 347 1.2 ÿ16 349 365 2.5 ÿ26 352 378 6.7 ÿ42 338 380 10 ÿ48 322 370 12 ÿ72 308 380 20 ÿ80 308 388 23 ÿ93 308 401 34 ÿ95 308 403
400 mV sÿ1 during the voltammetric PEDOT
electropolymeriza-tion. In all cases, the amount of charge used was kept constant. For potential scan rates lower than 250 mV sÿ1, the lowest
oxida-tion potential and the highest amperometric response for both acids were obtained with the highest potential scan rate. Increas-ing the scan rate resulted in higher electrodeposition currents (re-sults not shown). The electropolymerization reaction rate increased in the same way, thus improving the film porosity[51]. Consequently the interaction between the polymer and both acids was improved. For potential scan rate higher than 250 mV sÿ1the
analytical performances of the resulting microsensor were not sig-nificantly improved. For instance the increase of the amperometric signal due to UA oxidation was only 17.5% (from 1.78 to 2.09 mA cmÿ2) when changing the potential scan rate from 250
to 400 mV sÿ1during the electropolymerization step. This result
is probably due to the difficulty to obtain an homogenous and or-dered polymer film with such high scan rate.
3.4. Analytical performances
The analytical performances of the
l
Au-PEDOT modified elec-trode for AA and UA assays were evaluated with the optimized val-ues of the electropolymerization parameters, i.e. potential range from ÿ0.88 V to 1.5 V, potential scan rate 250 mV sÿ1, monomerconcentration 2.5 mmol Lÿ1, electropolymerization charge density
12 mC cmÿ2.Fig. 6A and B exhibit the DPVs recorded under
increas-ing concentrations of AA and UA respectively. The resultincreas-ing calibration curves are also shown (inset). For AA, The peak current density increased linearly with the concentration in the range 5.0–300
l
mol Lÿ1with a sensitivity of 0.87l
Al
Mÿ1cmÿ2 and adetection limit of 2.5
l
mol Lÿ1(S/N = 3). The UA oxidation currentdensity varied linearly with the concentration in the range 2.0– 600
l
mol Lÿ1with a sensitivity of 3.06l
Al
Mÿ1cmÿ2and adetec-tion limit of 1.5
l
mol Lÿ1(S/N = 3). The relative standard deviations(R.S.D.) were 1.1% and 1.4% for three successive measurements of AA and UA 1 mM respectively. These analytical performances were compared to those obtained on different modified electrodes and reported recently in the literature (Table 1). To the best of our knowl-edge, the PEDOT modified voltammetric microsensor presented in this paper induced the highest separation peak potential and one of the greatest sensitivities for UA assay. Comparison concerning the sensitivity for AA was not so easy since AA was introduced in large excess and consequently not systematically assayed in most of the papers published. Anyway these analytical performances are well suited to the assay of both acids in biological fluids like blood serum, as well as under physiological conditions (the physio-logical concentrations in blood serum are between 34 and 79
l
mol Lÿ1 for AA and between 180 and 420l
mol Lÿ1 for UA [4,46]) as in the presence of one of the two acids at high concentra-tions. The DPVs were also recorded in the presence of both acids in the mixture solution (Fig. 6C). Both calibration curves exhibited a linear variation of the peak current as a function of the concentrationFig. 4.DPVs recorded with a 50lm Au microelectrode (dotted line) and with alAu-PEDOT (solid lines) in an equimolar AA/UA solution 1 mmol Lÿ1pH 7.0 solution. Influence
of the upper potential used for the electropolymerization in 0.1 mol Lÿ1TBAPC–acetonitrile containing EDOT 2.5 mmol Lÿ1: (a) 1.2 V; (b) 1.3 V; (c) 1.4 V; (d) 1.5 V; (e) 1.6 V vs.
SCE.
Fig. 5.DPVs recorded with alAu-PEDOT in an equimolar AA/UA 1 mmol Lÿ1pH 7.0. Influence of the potential scan rate used during the electropolymerization between
of the corresponding antioxidant specie (not shown). The resulting sensitivity was roughly unchanged for AA, whereas it increased to 4.05
l
Al
Mÿ1cmÿ2for UA. This enhancement of the sensitivity ofthe microsensor for UA in the presence of AA reveals an EC’
mecha-nism resulting from a chemical reaction in solution coupled to the electrochemical step[62]. The apparent standard potential of the (ascorbyl radical/ascorbate ion) redox system being lower than that of the (alloxan/urate) one (0.28 V and 0.59 V vs. SCE at pH 7.0
Fig. 6.(A) and (B): DPVs recorded with alAu-PEDOT in (A) different AA solutions and in (B) different UA solutions pH 7.0. Inset: calibration curves. (C): DPV recorded with the modified electrode in mixture solutions containing AA and UA respectively at: (1): 5 and 6lmol Lÿ1; (2): 17 and 12; (3): 38 and 30; (4): 54 and 50; (5): 69 and 89; (6): 84
and 135; (7): 103 and 181; (8): 122 and 210; (9): 148 and 279; (10): 181 and 396 and (11): 220 and 499lmol Lÿ1. PEDOT film was electropolymerized between ÿ0.88 V and
respectively[63,64]), a spontaneous oxidoreduction reaction be-tween AA and the UA oxidation product takes place, thus regener-ating the reduced form of UA at the vicinity of the modified electrode surface. Further experiments have been performed in the laboratory to highlight this mechanism. For example, addition of 200
l
L of a solution of AA 8 mmol Lÿ1in 10 mL of a solution ofUA 300
l
mol Lÿ1(corresponding to a final concentration of AA equalto 156
l
mol Lÿ1) induced an amplification of 14.5% of the anodiccurrent corresponding to UA oxidation recorded near 0.3 V by DPV. If the coupled chemical reaction was not present, the later would be constant or would decrease slightly due to the dilution of the initial solution. This was for instance the case when aliquots contained only buffered solution without AA. The amplification of the current was not due to the polymer since similar results were observed when the experiments were realized on a non-modified gold microelectrode: using the same protocol, the increase of the anodic current recorded at 0.8 V was each time about three fold the increase that was expected by considering only the additional current due to the introduction of AA in solution. In consequence, in contrast with several previous published papers indicating that AA induced no interference in the assay of UA (sometimes in contra-diction with the experimental results presented, see for example Ref.[26,28,33]), an obvious change was observed in our case in the UA oxidation current depending on whether AA was present in the sample or not. Consequently two different protocols have to be prac-tically adopted depending on the composition of the samples: in the case, where all samples contain AA (particularly if in large excess), the assay of UA would induce no bias provided that the calibration curve is performed in the presence of AA. In the case, where AA is not present or is in concentration similar to that of UA, AA has to be assayed before UA, the calibration curve of UA taking account of the presence or the absence of AA.
3.5. Interfering species
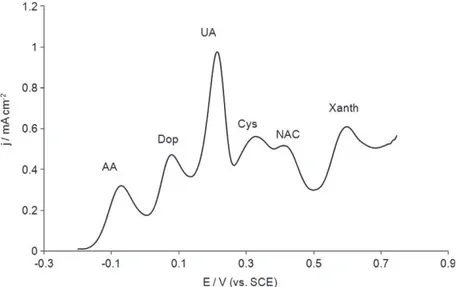
In order to be used further in real samples the voltammetric sensor has been tested in the presence of the main common sub-stances co-existing in the same concentration range and which could interfere with the detection of AA and UA in biological fluids. In this respect the effect of dopamine, xanthine, hypoxanthine, glutamic acid, NAC, cysteine, glucose and albumin was examined.
Fig. 7shows the DPVs obtained with a solution containing all these
species. Compared to the curve obtained with only AA and UA (Fig. 2C) no change was observed in the oxidation peak potentials of both antioxidant species. Furthermore, their amperometric re-sponses were not affected except in the presence of xanthine. In this later case the peak current density corresponding to UA oxida-tion increased during the second potential sweep only when the potential reached 0.64 V in the first scan, thus allowing the elec-trochemical oxidation of xanthine into uric acid [61]. In conse-quence, the potential range of the
l
Au-PEDOT voltammetric sensor has to be reduced from ÿ0.3 V to 0.5 V in order to obtain selective and reliable results for the assay or AA and UA in complex media. In this potential range, glutamic acid was not detected and glucose presented no electrochemical activity. Finally the presence of albumin induced a slight positive shift of about 30 mV in the oxidation peak potentials of all the electrochemically detected species.3.6. Blood serum analyses
The application of the
l
Au-PEDOT modified electrode to the detection of AA and UA in human blood serum was evaluated.Fig. 7.DPV recorded with alAu-PEDOT in PBS 0.1 mol Lÿ1pH 7.0 containing ascorbic acid 200lmol Lÿ1, dopamine 50lmol Lÿ1, uric acid 150lmol Lÿ1, xanthine
100lmol Lÿ1, hypoxanthine 100lmol Lÿ1, cysteine 200lmol Lÿ1, NAC 100lmol Lÿ1, glutamic acid 500lmol Lÿ1, glucose 5.5 mmol Lÿ1and albumin 2 g Lÿ1. PEDOT film was
electropolymerized between ÿ0.88 V and 1.5 V vs. SCE at 250 mV sÿ1in 0.1 mol Lÿ1TBAPC–acetonitrile containing EDOT 2.5 mmol Lÿ1.
Fig. 8.DPV recorded with alAu-PEDOT in (a) 250lL undiluted blood serum; (b) addition of AA 19lmol Lÿ1; (c) addition of UA 35lmol Lÿ1. PEDOT film was
electropolymerized between ÿ0.88 V and 1.5 V vs. SCE at 250 mV sÿ1in 0.1 mol Lÿ1
Fig. 8shows preliminary results obtained by DPV in 250
l
L undi-luted sample (curve a). The voltammogram showed two well de-fined and separate peaks recorded at ÿ0.03 V and 0.20 V. It was verified that these anodic signals corresponded to the oxidation of AA and UA respectively by successively adding both acids in the sample (curves b and c). This confirms that the voltammetric PEDOT modified microsensor is suitable to detect simultaneously submicromolar AA and UA concentrations in real samples. Never-theless the peak potentials were not exactly the same as those re-corded in standard aqueous solutions (Fig. 6C). This was certainly due to the matrix effect in blood serum. Works are now in progress to quantitatively assay both antioxidant species taking into account the EC0mechanism of UA regeneration.4. Conclusion
Modification of gold microelectrode surface by means of PEDOT electropolymerization has proved to be efficient to elaborate a vol-tammetric sensor for the assay of AA and UA. Optimization of the major electropolymerization parameters (monomer concentration, potential range, potential scan rate, polymer film thickness) in-duced analytical performances (in terms of sensitivity, concentra-tion range and detecconcentra-tion limit) in agreement with the concentration of both species in biological fluids. As reported in lit-erature studies, these parameters determine to a large extent the structure and the electrocatalytic properties of the polymer. The optimized selectivity and sensitivity of the sensor have been reached with parameters inducing ordered and porous matrix with high electrical conductivity. The
l
Au-PEDOT electrode thus exhib-its a potential and persistent electrocatalytic behavior which makes possible to consider it as a convenient probe for the assay of many compounds of biological importance. Works are in pro-gress in our laboratory to evaluate the performances of such sensor in real physiological fluids.Acknowledgements
The authors would like to thank Professor Maurice Comtat from the Laboratoire de Génie Chimique and Benjamin Huerta Ortega from Vivelys Company for fruitful scientific discussions, Laure Latapie from the Laboratoire de Génie Chimique for technical sup-port and Anne Galinier from the Laboratoire de Biochimie – Hôpital Rangueil Toulouse for blood serum gift.
References
[1] O. Arrigoni, M. Tullio, Biochim. Biophys. Acta 1569 (2002) 1–9. [2] H.K. Choi, X. Gao, G. Curhan, Arch. Intern. Med. 169 (2009) 502–507. [3] D.T. Alexandrescu, C.A. Dasanu, C.L. Kauffman, Clin. Exp. Dermatol. 34 (2009)
811–814.
[4] M.C. Polidori, W. Stahl, O. Eichler, I. Niestroj, H. Sies, Free Radical Biol. Med. 30 (2001) 456–462.
[5] M.H. Alderman, Curr. Opin. Pharmacol. 2 (2002) 126–130. [6] G.C. Curhan, E.N. Taylor, J. Urol. 181 (2009) 1721–1723. [7] H.A. Jinnah, Dis. Models Mech. 2 (2009) 116–121.
[8] Y. Zhao, X. Yang, W. Lu, H. Liao, F. Liao, Microchim. Acta 164 (2009) 1–6. [9] S.L. Feng, J. Wang, X.G. Chen, J. Fan, Spectrochim. Acta, Part A 61 (2005)
841–844.
[10] Z. Gazdik, O. Zitka, J. Petrlova, V. Adam, J. Zehnalek, A. Horna, V. Reznicek, M. Beklova, R. Kizek, Sensors 8 (2008) 7097–7112.
[11] S.A. Wring, J.P. Hart, Analyst 117 (1992) 1215–1229.
[12] R. M. Wightman, D.O. Wipf, in: A.J. Bard, M. Dekker (Eds.), Electroanalytical Chemistry – Voltammetry at Ultramicroelectrodes, New York and Basel, vol. 15, 1989, pp. 267–363.
[13] T. Hepel, J. Osteryoung, J. Phys. Chem. 86 (1982) 1406–1411. [14] J.O. Howell, R.M. Wightman, J. Phys. Chem. 88 (1984) 3915–3918.
[15] D. Zheng, J. Ye, L. Zhou, Y. Zhang, C. Yu, J. Electroanal. Chem. 625 (2009) 82–87. [16] J. Premkumar, S.B. Khoo, J. Electroanal. Chem. 576 (2005) 105–112. [17] T. Selvaraju, R. Ramaraj, Electrochim. Acta 52 (2007) 2998–3005. [18] C.-X. Li, Y.-L. Zeng, Y.-J. Liu, C.-R. Tang, Anal. Sci. 22 (2006) 393–397. [19] S. Sharokhian, H.R. Zare-Mehrjardi, Electroanalysis 19 (2007) 2234–2242. [20] H.M. Nassef, A.-E. Radi, C. O’Sullivan, Anal. Chim. Acta 583 (2007) 182–189. [21] D. Sun, Y. Zhang, F. Wang, K. Wu, J. Chen, Y. Zhou, Sens. Actuators B 141 (2009)
641–645.
[22] S. Zhu, H. Li, W. Niu, G. Xu, Biosens. Bioelectron. 25 (2009) 940–943. [23] S. Zhang, M. Xu, Y. Zhang, Electroanalysis 21 (2009) 2607–2610. [24] C.R. Raj, T. Ohsaka, J. Electroanal. Chem. 540 (2003) 69–77. [25] H. Jeong, S. Jeon, Sensors 8 (2008) 6924–6935.
[26] Y. Li, X. Lin, Sens. Actuators B 115 (2006) 134–139.
[27] T.F. Kang, G.L. Shen, R.Q. Yu, Chem. Res. Chin. Univ. 13 (1997) 207–214. [28] S.A. Kumar, H.-W. Cheng, S.-M. Chen, Electroanalysis 21 (2009) 2281–2286. [29] M. Zhang, K. Liu, L. Xiang, Y. Lin, L. Su, L. Mao, Anal. Chem. 79 (2007)
6559–6565.
[30] S. Shahrokhian, M. Ghalkhani, Electrochim. Acta 51 (2006) 2599–2606. [31] A.A. Ensafi, M. Taei, T. Khayamian, J. Electroanal. Chem. 633 (2009) 212–220. [32] P. Kalimuthu, S.A. John, Anal. Chim. Acta 647 (2009) 97–103.
[33] M.Y. Wang, X.Y. Xu, F. Yang, S.Y. Zhang, X.J. Yang, J. Appl. Electrochem. 38 (2008) 1269–1274.
[34] P. Kalimuthu, S.A. John, Bioelectrochemistry 77 (2009) 13–18. [35] X. Zhu, X. Lin, Chin. J. Chem. 27 (2009) 1103–1109.
[36] J.-B. He, G.-P. Jin, Q.-Z. Chen, Y. Wang, Anal. Chim. Acta 585 (2007) 337–343. [37] J. Roncali, Chem. Rev. 92 (1992) 711–738.
[38] L. Groenendaal, F. Jonas, D. Freitag, H. Pielartzik, J.R. Reynolds, Adv. Mater. 12 (2000) 481–494.
[39] L. Groenendaal, G. Zotti, P.-H. Aubert, S.M. Waybright, J.R. Reynolds, Adv. Mater. 15 (2003) 855–879.
[40] N.K. Guimard, N. Gomez, C.E. Schmidt, Prog. Polym. Sci. 32 (2007) 876–921. [41] S.S. Kumar, J. Mathiyarasu, K.L. Phani, Y.K. Jain, V. Yegnaraman, Electroanalysis
17 (2005) 2281–2286.
[42] A. Balamurugan, S.-M. Chen, Anal. Chim. Acta 596 (2007) 92–98. [43] V.S. Vasantha, S.-M. Chen, J. Electroanal. Chem. 592 (2006) 77–87. [44] V.S. Vasantha, S.-M. Chen, Electrochim. Acta 52 (2006) 665–674.
[45] S. Lupu, A. Mucci, L. Pigani, R. Seeber, C. Zanardi, Electroanalysis 14 (2002) 519–525.
[46] P. Boulanger, J. Polonovski, F. Tayeau, P. Mandel, G. Biserte, Biochimie Médicale, eighth ed., Masson, Paris, 1971.
[47] M.A. Sato, S. Tanaka, K. Kaeriyama, Chem. Soc. Chem. Commun. 11 (1985) 713–714.
[48] S. Patra, K. Barai, N. Munichandraiah, Synth. Met. 158 (2008) 430–435. [49] M.C. Morvant, J.R. Reynolds, Synth. Met. 92 (1998) 57–61.
[50] L. Niu, C. Kvarnström, K. Fröberg, A. Ivaska, Synth. Met. 122 (2001) 425–429. [51] A.I. Melato, M.H. Mendonça, L.M. Abrantes, J. Solid State Electrochem. 13
(2009) 417–426.
[52] H. Randriamahazaka, V. Noël, C. Chevrot, J. Electroanal. Chem. 472 (1999) 103– 111.
[53] T. Darmanin, M. Nicolas, F. Guittard, Phys. Chem. 10 (2008) 4322–4326. [54] A. Ruffien-Ciszak, P. Gros, M. Comtat, A.-M. Schmitt, E. Questel, C. Casas,
D. Redoules, J. Pharm. Biomed. Anal. 40 (2006) 162–167.
[55] E. Tamburri, S. Orlanducci, F. Toschi, M.L. Terranova, D. Passeri, Synth. Met. 159 (2009) 406–414.
[56] A. Bello, M. Gianneto, G. Mori, R. Seeber, F. Terzi, C. Zanardi, Sens. Actuators, B 121 (2007) 430–435.
[57] A.J. Downard, D. Pletcher, J. Electroanal. Chem. 206 (1986) 147–152. [58] C.P. Andrieux, P. Audebert, P. Hapiot, J.-M. Saveant, J. Phys. Chem. 95 (1991)
10158–10164.
[59] C.R. Martin, L.S. Van Dyke, in: R.W. Murray (Ed.), Mass and Charge Transport in Electronically Conductive Polymers, Wiley, New York, 1992, pp. 403–424. [60] M.E.G. Lyons, in: M.E.G. Lyons (Ed.), Charge Percollation in Electroactive
Polymers, Electroactive Polymer Electrochemistry Part I, Plenum Press, New York, 1994, pp. 65–116.
[61] G. Schöpf, G. Kößmehl, Electrically Conductive Polymers, Springer-Verlag, Germany, 1997. p. 80.
[62] A.J. Bard, L.R. Faulkner, Electrochimie: Principes, Méthodes et applications, Masson, Paris, 1983. p. 486.
[63] G.R. Buettner, B.A. Jurkiewicz, in: E. Cadenas, L. Packer (Eds.), Handbook of Antioxidants, M. Dekker, New York, 1996, pp. 91–115.
[64] C. Jacob, G.I. Giles, N.M. Giles, H. Sies, Angew. Chem. Int. Ed. 42 (2003) 4742– 4758.