Publisher’s version / Version de l'éditeur:
Optics Express, 25, 13, pp. 14247-14259, 2017-06-26
READ THESE TERMS AND CONDITIONS CAREFULLY BEFORE USING THIS WEBSITE.
https://nrc-publications.canada.ca/eng/copyright
Vous avez des questions? Nous pouvons vous aider. Pour communiquer directement avec un auteur, consultez la première page de la revue dans laquelle son article a été publié afin de trouver ses coordonnées. Si vous n’arrivez pas à les repérer, communiquez avec nous à PublicationsArchive-ArchivesPublications@nrc-cnrc.gc.ca.
Questions? Contact the NRC Publications Archive team at
PublicationsArchive-ArchivesPublications@nrc-cnrc.gc.ca. If you wish to email the authors directly, please see the first page of the publication for their contact information.
This publication could be one of several versions: author’s original, accepted manuscript or the publisher’s version. / La version de cette publication peut être l’une des suivantes : la version prépublication de l’auteur, la version acceptée du manuscrit ou la version de l’éditeur.
For the publisher’s version, please access the DOI link below./ Pour consulter la version de l’éditeur, utilisez le lien DOI ci-dessous.
https://doi.org/10.1364/OE.25.014247
Access and use of this website and the material on it are subject to the Terms and Conditions set forth at
Nonlinear photoluminescence imaging applied to femtosecond laser
manufacturing of fiber Bragg gratings
Hnatovsky, C.; Grobnic, D.; Mihailov, S. J.
https://publications-cnrc.canada.ca/fra/droits
L’accès à ce site Web et l’utilisation de son contenu sont assujettis aux conditions présentées dans le site LISEZ CES CONDITIONS ATTENTIVEMENT AVANT D’UTILISER CE SITE WEB.
NRC Publications Record / Notice d'Archives des publications de CNRC:
https://nrc-publications.canada.ca/eng/view/object/?id=66408131-2c2a-4e45-91f5-737fd3ad8494 https://publications-cnrc.canada.ca/fra/voir/objet/?id=66408131-2c2a-4e45-91f5-737fd3ad8494Nonlinear photoluminescence imaging applied
to femtosecond laser manufacturing of fiber
Bragg gratings
C
YRILH
NATOVSKY,
*D
ANG
ROBNIC,
ANDS
TEPHENJ. M
IHAILOVNational Research Council of Canada, Security and Disruptive Technologies, 100 Sussex Dr., Ottawa, ON, Canada, K1A 0R6
*Cyril.Hnatovsky@nrc-cnrc.gc.ca
Abstract: Nonlinear photoluminescence imaging is used to visualize the intensity distribution of femtosecond laser pulses inside the optical fiber during Bragg grating inscription based on side illumination through a phase mask. This technique, which results in direct imaging of the inscription laser field inside the optical fiber, facilitates i) the characterization of the laser focus in the vicinity of the fiber core and ii) the optimization of the fiber alignment with respect to the laser focus while using pulses with energies several times lower than those used during the actual inscription process. The applicability of this imaging technique is demonstrated for Bragg grating inscription in different optical fibers, including direct inscription through the fiber coating.
© 2017 Optical Society of America
OCIS codes: (060.3738) Fiber Bragg gratings, photosensitivity; (060.7140) Ultrafast processes in fibers; (110.0180) Microscopy; (140.3390) Laser materials processing.
References and Links
1. S. J. Mihailov, “Fiber Bragg grating sensors for harsh environments,” Sensors (Basel) 12(2), 1898–1918 (2012). 2. S. J. Mihailov, C. W. Smelser, P. Lu, R. B. Walker, D. Grobnic, H. Ding, G. Henderson, and J. Unruh, “Fiber
bragg gratings made with a phase mask and 800-nm femtosecond radiation,” Opt. Lett. 28(12), 995–997 (2003). 3. R. R. Gattass and E. Mazur, “Femtosecond laser micromachining in transparent materials,” Nat. Photonics 2(4),
219–225 (2008).
4. K. M. Davis, K. Miura, N. Sugimoto, and K. Hirao, “Writing waveguides in glass with a femtosecond laser,” Opt. Lett. 21(21), 1729–1731 (1996).
5. S. J. Mihailov, D. Grobnic, C. W. Smelser, P. Lu, R. B. Walker, and H. Ding, “Bragg grating inscription in various optical fibers with femtosecond infrared lasers and a phase mask,” Opt. Mater. Express 1(4), 754–765 (2011).
6. A. Martinez, I. Y. Khrushchev, and I. Bennion, “Direct inscription of Bragg gratings in coated fibers by an infrared femtosecond laser,” Opt. Lett. 31(11), 1603–1605 (2006).
7. S. J. Mihailov, D. Grobnic, and C. W. Smelser, “Efficient grating writing through fibre coating with femtosecond IR radiation and phase mask,” Electron. Lett. 43(8), 442–443 (2007).
8. K.-i. Kawamura, N. Sarukura, M. Hirano, N. Ito, and H. Hosono, “Periodic nanostructure array in crossed holographic gratings on silica glass by two interfered infrared-femtosecond laser pulses,” Appl. Phys. Lett. 79(9), 1228–1230 (2001).
9. R. Kashyap, Fiber Bragg Gratings (Academic, 2009), Chap. 3.
10. C. Smelser, S. Mihailov, and D. Grobnic, “Formation of Type I-IR and Type II-IR gratings with an ultrafast IR laser and a phase mask,” Opt. Express 13(14), 5377–5386 (2005).
11. M. Watanabe, S. Juodkazis, H.-B. Sun, S. Matsuo, and H. Misawa, “Luminescence and defect formation by visible and near-infrared irradiation of vitreous silica,” Phys. Rev. B 60(14), 9959–9964 (1999).
12. P. G. Kazansky, H. Inouye, T. Mitsuyu, K. Miura, J. Qiu, K. Hirao, and F. Starrost, “Anomalous anisotropic light scattering in Ge-doped silica glass,” Phys. Rev. Lett. 82(10), 2199 (1999).
13. J. Thomas, E. Wikszak, T. Clausnitzer, U. Fuchs, U. Zeitner, S. Nolte, and A. Tünnermann, “Inscription of fiber Bragg gratings with femtosecond pulses using a phase mask scanning technique,” Appl. Phys., A Mater. Sci. Process. 86(2), 153–157 (2007).
14. J. Qiu, L. Wang, and B. Zhu, “Femtosecond laser induced various luminescent phenomena in solid materials,” in Progress in Ultrafast Intense Laser Science, Volume 91, K. Yamanouchi, A. Becker, R. Li, and S. L. Chin, ed. (Springer, 2009).
15. D. Grobnic, C. Hnatovsky, R. Lausten, and S. J. Mihailov, “Dynamics of the fluorescence intensity during fiber Bragg grating inscription in SMF-28 and pure silica core fiber using 800 nm fs radiation,” in Photonics and
Fiber Technology 2016 (2016), paper BTh3B.7.
#293431 https://doi.org/10.1364/OE.25.014247
16. Y. Duval, R. Kashyap, S. Fleming, and F. Ouellette, “Correlation between ultraviolet-induced refractive index change and photoluminescence in Ge-doped fiber,” Appl. Phys. Lett. 61(25), 2955–2957 (1992).
17. L. Paccou, M. Lancry, and M. Douay, “Kinetics of UV-induced blue luminescence linked with the observation of the local mean index in fiber Bragg gratings,” Opt. Express 13(19), 7342–7349 (2005).
18. T. Komukai and N. Nakazawa, “Fabrication of high quality long fiber Bragg grating by monitoring 3.1 eV radiation (400 nm) from GeO defects,” IEEE Photonics Technol. Lett. 8(11), 1495–1497 (1996).
19. C. Hnatovsky, D. Grobnic, and S. J. Mihailov, “Optimization of the Bragg Grating Inscription Process Using Fluorescence Microscopy,” in Photonics and Fiber Technology 2016 (2016), paper BW4B.5.
20. C. Hnatovsky, D. Grobnic, D. Coulas, M. Barnes, and S. J. Mihailov, “Self-organized nanostructure formation during femtosecond-laser inscription of fiber Bragg gratings,” Opt. Lett. 42(3), 399–402 (2017).
21. T. D. Monte, L. Wang, and R. Dyott, “Elliptical core and D-shape fibers,” in Specialty Optical Fibers
Handbook, A. Méndez and T. F. Morse, ed. (Academic, 2007).
22. J. D. Mills, C. W. J. Hillman, B. H. Blott, and W. S. Brocklesby, “Imaging of free-space interference patterns used to manufacture fiber bragg gratings,” Appl. Opt. 39(33), 6128–6135 (2000).
23. C. W. Smelser, S. J. Mihailov, D. Grobnic, P. Lu, R. B. Walker, H. Ding, and X. Dai, “Multiple-beam interference patterns in optical fiber generated with ultrafast pulses and a phase mask,” Opt. Lett. 29(13), 1458– 1460 (2004).
24. M.-S. Kim, T. Scharf, C. Menzel, C. Rockstuhl, and H. P. Herzig, “Talbot images of wavelength-scale amplitude gratings,” Opt. Express 20(5), 4903–4920 (2012).
25. C. Bourgenot, C. D. Saunter, J. M. Taylor, J. M. Girkin, and G. D. Love, “3D adaptive optics in a light sheet microscope,” Opt. Express 20(12), 13252–13261 (2012).
26. T. Meinert, B. A. Gutwein, and A. Rohrbach, “Light-sheet microscopy in a glass capillary: feedback holographic control for illumination beam correction,” Opt. Lett. 42(2), 350–353 (2017).
27. S. Hell, G. Reiner, C. Cremer, and E. H. K. Stelzer, “Aberrations in confocal fluorescence microscopy induced by mismatches in refractive index,” J. Microsc. 169(3), 391–405 (1993).
28. P. Török, P. Varga, Z. Laczic, and G. R. Booker, “Electromagnetic diffraction of light focused through a planar interface between materials of mismatched refractive indices: an integral representation,” J. Opt. Soc. Am. A 12(2), 325–332 (1995).
29. P. Török, P. Varga, and G. R. Booker, “Electromagnetic diffraction of light focused through a planar interface between materials of mismatched refractive indices: structure of the electromagnetic field,” J. Opt. Soc. Am. A 12(10), 2136–2144 (1995).
30. C. W. Smelser, D. Grobnic, and S. J. Mihailov, “Generation of pure two-beam interference grating structures in an optical fiber with a femtosecond infrared source and a phase mask,” Opt. Lett. 29(15), 1730–1732 (2004). 31. M. Gallagher and U. Osterberg, “Time resolved 3.10 eV luminescence in germanium-doped silica glass,” Appl.
Phys. Lett. 63(22), 2987–2989 (1993).
32. D. Grobnic, C. W. Smelser, S. J. Mihailov, R. B. Walker, and P. Lu, “Fiber Bragg gratings with suppressed cladding modes made in SMF-28 with a femtosecond IR laser and a phase mask,” IEEE Photonics Technol. Lett. 16(8), 1864–1866 (2004).
33. D. Grobnic, S. J. Mihailov, and C. W. Smelser, “Localized high birefringence induced in SMF-28 fiber by femtosecond IR laser exposure of the cladding,” J. Lightwave Technol. 25(8), 1996–2001 (2007). 34. S. J. Mihailov, D. Grobnic, and C. W. Smelser, “Efficient grating writing through fibre coating with
femtosecond IR radiation and phase mask,” Electron. Lett. 43(8), 442–443 (2007).
35. D. Grobnic, S. J. Mihailov, R. Lausten, and C. Hnatovsky, “High Temperature Stable Fiber Bragg Gratings (FBGs) Inscribed Through Polyimide Coating of Optical Fibers Using a Phase Mask,” in Photonics and Fiber
Technology 2016 (2016), paper BM3B.2.
36. M. Bernier, F. Trépanier, J. Carrier, and R. Vallée, “High mechanical strength fiber Bragg gratings made with infrared femtosecond pulses and a phase mask,” Opt. Lett. 39(12), 3646–3649 (2014).
37. C. W. Smelser, F. Bilodeau, B. Malo, D. Grobnic, and S. J. Mihailov, “Novel Phase Mask Apparatus for “Through the Jacket” Inscription of FBGs in Unloaded SMF-28 Fiber”, in Bragg Gratings, Photosensitivity, and
Poling in Glass Waveguides (2010), paper BThD3.
38. S. O. Kucheyev and S. G. Demos, “Optical defects produced in fused silica during laser-induced breakdown,” Appl. Phys. Lett. 82(19), 3230–3232 (2003).
39. S. J. Mihailov, C. W. Smelser, D. Grobnic, R. B. Walker, P. Lu, H. Ding, and J. Unruh, “Bragg gratings written in all-SiO2 and Ge-doped core fibers with 800-nm femtosecond radiation and a phase mask,” J. Lightwave
Technol. 22(1), 94–100 (2004).
1. Introduction
Fiber Bragg gratings (FBGs) are typically made by inducing a periodic or aperiodic modulation of refractive index in the fiber core with intense laser radiation. Among the many different methods to fabricate FBGs [1], side illumination of the fiber through a phase mask with focused femtosecond laser pulses [2] can be highly advantageous for some applications. Indeed, nonresonant multiphoton absorption of laser light inside transparent media can be easily achieved with focused ultrashort pulses [3]. The material surrounding the focal volume
remains unaffected by the light passing through it, which allows one to inscribe structures at any depth in 3-D fashion [3, 4]. Ultrafast lasers can be used for direct FBG inscription in almost any optical fiber, as compared with UV lasers where some photosensitization of the fiber core is required to make the UV light absorption possible [5]. For the very same reason, inscription of FBGs through the protective coating of a fiber is also achievable with tightly focused ultrashort pulses [6, 7], where it is impossible to do so with standard UV laser based FBG inscription methods. The use of a phase mask in order to produce an interference pattern in the fiber has its own advantages [2]. Specifically, this approach is more robust and easier to introduce than the majority of interference schemes with long optical paths [8, 9].
Despite the demonstrated feasibility to fabricate high-quality low-loss Type I and Type II FBGs using femtosecond lasers and the phase mask technique [10], both in research laboratories and industrial environments, the method is inherently sensitive to alignment of the sharp line-shape laser focus with respect to the fiber inside which an FBG is to be written. This sensitivity to alignment is especially true when tight focusing geometries needed for inscription through protective fiber coatings (transjacket FBGs) are considered. For FBG based sensing applications, writing gratings through the fiber coating is desirable since the device maintains the same mechanical integrity as the pristine fiber (~50,000 μstrains). The mechanical strength of traditional UV gratings is seriously degraded because of the fiber strip and recoat techniques that need to be employed [1]. More generally, grating inscription through protective coatings with femtosecond lasers is desirable from a manufacturing perspective as several processing steps associated with UV grating inscription process are removed, namely, fiber photosensitization by hydrogen loading, removal of the protective coating and its reapplication after grating inscription.
The main objective of this work is to shed light on the complex propagation through the optical system used to inscribe Bragg gratings as well as the interaction of the infrared femtosecond radiation with it. It is also a goal of this paper to demonstrate that the alignment procedure pertinent to femtosecond laser writing of FBGs using the phase mask technique can be significantly improved by using in situ nonlinear microscopy. Our technique is based on the fact that a focused femtosecond laser beam can excite nonlinear photoluminescence in silica-based optical fibers and other bulk materials [11–15]. Photoluminescence from Ge-doped optical fiber has been observed when exposed to high photon energy UV light [16, 17] and can be used as an alignment tool for FBG inscription by monitoring the UV light induced photoluminescence signal that is guided along the optical fiber to its end face [18]. Recently, we demonstrated that the femtosecond IR interference field used to write the Bragg grating generates nonlinear photoluminescence that could be imaged during inscription and correlated with the formed grating using dark-field microscopy [19]. In the present work, we demonstrate that such nonlinear photoluminescence imaging can be used to adjust the femtosecond laser focus position as well as the laser focus parameters inside the fiber during the alignment process, that is, at pulse energies that are much lower than those employed to induce strong permanent index changes in the fiber during the actual FBG inscription process. We show that nonlinear photoluminescence is a precursor of multiphoton ionization/optical breakdown, which occurs at higher pulse energies. We confirm this using dark-field optical microscopy [20], which can quite accurately pinpoint the regions in the fiber core where light-induced index changes have been produced, thus correlating their position with the nonlinear photoluminescence intensity distribution. In this context, we note that other alignment techniques that are based on monitoring nonlinear photoluminescence generated in the fiber core during the FBG inscription process lack such a direct imaging capability as they rely on measuring only the magnitude of the photoluminescence signal, either at the side of the fiber [13] or at its end [15].
2. Experiment
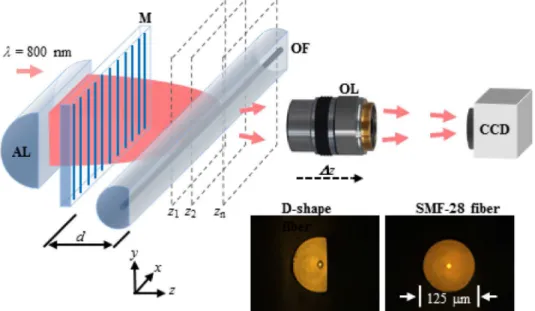
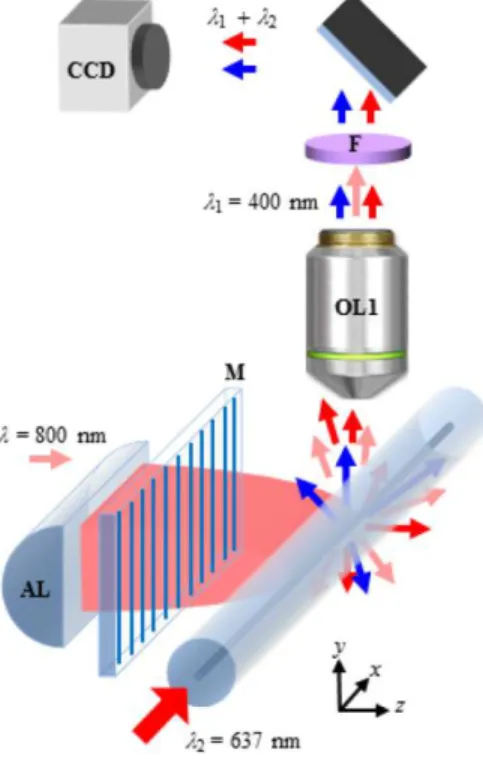
An 80 fs Ti-sapphire regeneratively amplified femtosecond laser system operating at a central wavelength of λ = 800 nm was used in the experiments. The laser pulse energies were typically varied between 80 and 300 μJ, depending on the experiment being performed, with the pulse repetition rate kept at 1 kHz. The ~7 mm diameter Gaussian beam was linearly polarized and focused through a phase mask (M) onto the optical fiber (OF), with the resultant line-shape laser focus being aligned parallel to the fiber axis (Fig. 1). The focusing optics used were either an f = 8 mm or 12 mm plano-convex acylindrical lens (AL). The curved surfaces of the ALs are specifically designed to reduce spherical aberration in one dimension. The phase masks used had a pitch of either 1.07 μm or 3.17 μm (defined as 1st order and 3rd order, respectively). The linear polarization of the femtosecond beam was aligned to be perpendicular to the mask grooves. Exposed optical fibers were one of Andrews
D-fiber [21] or acrylate and polyimide coated Corning SMF-28 optical fiber. The laser beam
was swept periodically across the fiber core at ~3 µm/s by dithering the focusing lens using a piezo-actuated translation stage. During the grating inscription, the evolution of the grating reflectivity was continuously monitored using an erbium broadband source and an optical spectrum analyzer. For this work, an uncooled “off-the-shelf” CCD camera was used to record the images. For direct imaging of the infrared beam, the integration time for each image was < 0.1 seconds. For imaging the nonlinear photoluminescence in the blue, the integration time was increased to ~1 second since the nonlinear photoluminescence signal is much weaker.
3. Results and Discussion
3.1 Direct imaging of laser focus inside optical fiber
Even though femtosecond light interference patterns generated by phase masks in free space are well understood [22, 23], they have never been visualized inside optical fiber during the FBG inscription process. The value of this missing piece of information arises from the fact that the front surface of the fiber represents a strong positive cylindrical lens in the beam path and unavoidably affects the intensity distribution in the core region where an FBG is to be inscribed [13].
In this set of experiments, the intensity distribution in the fiber core region was imaged by means of a high numerical aperture (i.e., NA = 0.9) objective lens (OL), as shown in Fig. 1. In this context, we note that high-resolution interference microscopy – a technique that also relies on collecting light with a high-NA optic for further processing to extract its amplitude and phase – has been demonstrated to provide remarkably accurate results in characterizing Talbot interference patterns produced by wavelength-scale amplitude gratings [24].
Generally, the geometry of a standard optical fiber makes accurate microscopy imaging inside it difficult due to severe astigmatism introduced by the cylindrical glass-air interface through which the imaging optics (i.e., OL) must collect the light [25, 26]. To eliminate the astigmatism, we used a so-called D-shape fiber (D-fiber), with its flat surface oriented toward the OL. The flat surface was aligned perpendicularly to the optical axis of OL and the femtosecond beam propagation direction. Additionally, the core of the D-fiber is located near to the flat surface (~15 μm), which also allowed us to image the core region without introducing a significant amount of spherical aberration caused by the planar glass-air interface [27–29].
The laser beam propagation inside the D-fiber and a standard SMF-28 fiber was expected to be very similar. Indeed, based on the cross-sectional bright-field microscopy images presented in Fig. 1, the radius of curvature of the cylindrical surface of the D-fiber is ~65 μm, which only slightly exceeds the corresponding nominal value for 125 μm-diameter SMF-28 fibers. Further, the cladding of the D-fiber is made of undoped fused silica (i.e., SiO2), which
The light intensity inside the D-fiber was mapped by translating OL along the beam propagation direction z in Δz = 1 μm steps and recording the respective transverse 2-D intensity patterns with the CCD camera (CCD). It should be noted that the actual distance between the sampling planes inside the fiber, which are denoted by z1, z2, zn in Fig. 1, was
Δzn, where n is the refractive index of the core region. A sequence of the collected intensity
slices was used to reconstruct the intensity distribution in 3-D. After removing the D-fiber from the optical path, the same procedure was repeated to retrieve the corresponding 3-D intensity distribution in free space, for comparison.
Fig. 1. A schematic of the microscopy setup used to measure the light intensity distribution in the core region of optical fibers. The bright-field microscopy images of the cleaved D-fiber and SMF-28 fiber are shown at the bottom. The distance between the mask M and the core of the optical fiber OF is denoted by d.
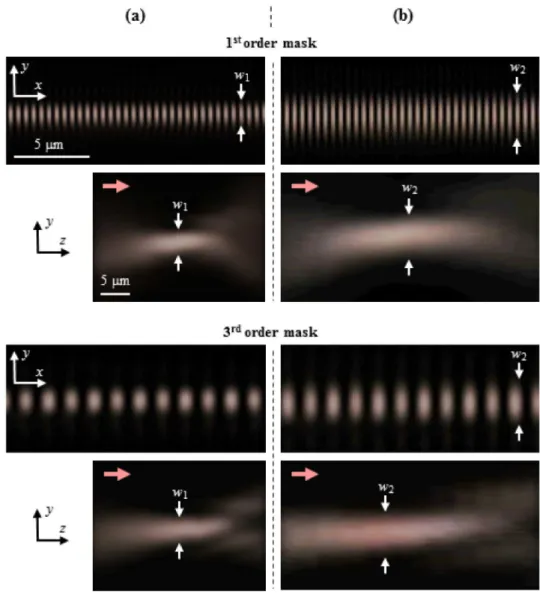
Figure 2 presents the results of the abovementioned intensity reconstruction technique when the femtosecond laser beam was focused inside the D-fiber (left column of images) and in free space (right column of images) with the f = 8 mm AL. To obtain the intra-focal sequences of free-space images the fiber was removed from the optical path and the objective lens was shifted toward the mask by ~25 μm – the distance by which the acylindrical lens’ focal planes in the fiber and free space are separated. While recording images, the laser power was kept at a < 1 mW level.
In the case of the 1st order mask, ~70% of the total diffracted power was contained in ± 1 orders and ~30% in the 0th order. Considering the order walk-off effect, this results in a 535 nm fringe pattern as seen in Fig. 2. For the 3rd order mask, ~5% of the total diffracted power was in the 0th order, while 35% was coupled into each of the ± 1 orders. For this case, the interference fringe pattern has a periodicity of 1.59 µm.
The most salient features of the images in Fig. 2 can be summarized as follows. The width of laser focus inside the fiber along the y-axis (w1 ~1.6 µm) is almost ~2 times smaller than
that measured in free space (w2 ~3.2 µm). This is a result of the lensing effect caused by the
front cylindrical surface of the fiber. As a consequence, the extent of the laser focus along the
z-axis, i.e., along the beam propagation direction, is 2-2.5 times smaller inside the fiber than
in free space. We note that for ideal aberration-free focusing, the confocal parameters for these two situations should scale as w22/nw12 ~2.7, assuming n ~1.45. Additionally, there is a
regular ~15% intensity modulation along the x-axis in the interference pattern produced by the 3rd order mask due to the Talbot effect [22]. In this case, the spatial walk-off [30] of the
neighboring diffracted orders (e.g., 2nd and 3rd orders) is insufficient to completely separate them along the z-axis because of the relatively small angle between them. Conversely, the Talbot effect is very weak for the 1st order mask as the diffracted beams are separated by a much larger angle and at a certain distance behind the mask the pulse fronts corresponding to the 0th and 1st diffraction orders no longer overlap.
Fig. 2. Light intensity distributions in optical fiber and free space produced by focusing a femtosecond laser beam through a phase mask with the f = 8 mm AL. (a) focal intensity distribution inside the D-fiber. (b) focal intensity distribution in free space recorded after removing the D-fiber from the optical path. The scale along the x- and y-axis is the same, whereas the scale along the z-axis is smaller, as indicated with the corresponding scale bars. The beam propagation direction in the yz-planes is denoted by arrows. The distance between the mask and the core of the optical fiber is d = 450 μm.
3.2 Visualization of the laser focus inside optical fiber by means of nonlinear photo-luminescence
The various photoluminescence phenomena occurring in dielectrics under excitation with intense ultrashort-pulse infrared radiation are well described in the literature [11–15]. Below it will be shown how the position of the line-shape laser focus with respect to the fiber core
can be adjusted by monitoring the nonlinear photoluminescence signal arising from the beam-fiber interaction. For standard telecommunication optical beam-fibers, Germanium (Ge) dopants in the silica matrix of the core increases the nonlinear photoluminescence yield, which allows one to localize the core based on a strong photoluminescence signal generated inside it. The nonlinear photo-luminescence spectrum of the core depends on its composition [15]. For the
D-fiber and SMF-28 fiber, each having Ge-doped silica cores, the spectrum is centered at λ1
~400 nm which is associated with the GeO-defect [31].
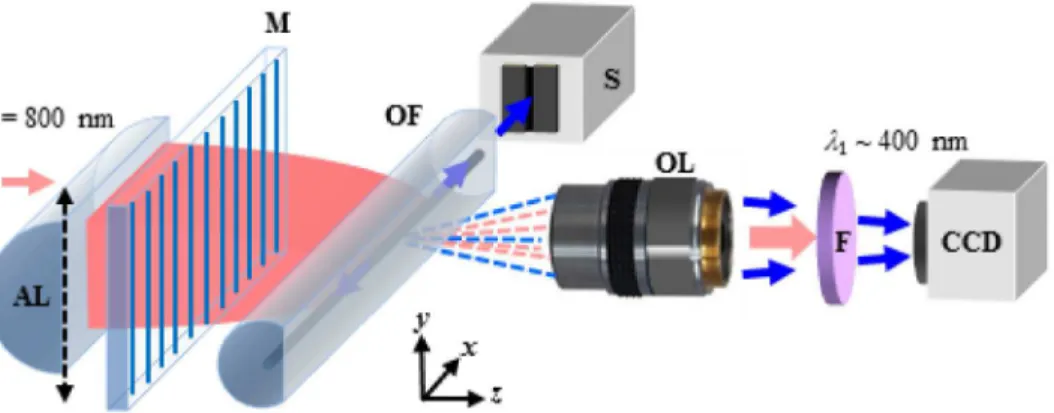
A schematic of the setup for these studies is presented in Fig. 3. Essentially, it is the same setup used in the previous section (i.e., Fig. 1) except that the laser power was increased to ~80 mW and a short-pass filter (F) was inserted into the beam path to pass the weak blue photoluminescence radiation from the core region and block the strong excitation radiation at
λ = 800 nm.
The laser focus after the 3rd order phase mask described earlier was scanned inside the
D-fiber along the y-axis by vertically translating the acylindrical lens with a piezo-actuated
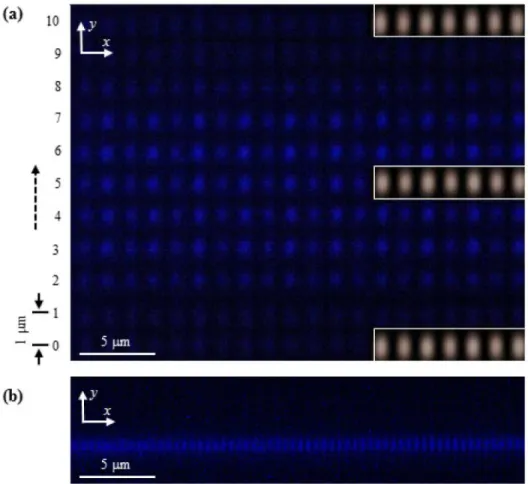
translation stage. Photoluminescence images were recorded at 1 μm intervals along the y-axis in the object plane of OL and then assembled into a collage, as shown in Fig. 4(a). As predicted, the Ge-doped silica elliptical fiber core, whose semi-major axis is nominally 4 μm (see Fig. 1), could be easily identified based on its appreciably stronger photoluminescence signature. On the other hand, the intensity patterns of the incoming femtosecond laser radiation, which we present for comparison in the 0th, 5th and 10th row of Fig. 4(a), remained unchanged (see superimposed images in Fig. 4(a)). Additionally, to verify that the strong blue photoluminescence was indeed associated with the core, the end of the D-fiber was coupled to a spectrometer (S) and the respective spectra recorded, showing a distinct peak at λ1 ~400 nm
[13, 15]. For completeness, an intra-core photoluminescence intensity distribution produced by the 1st order mask was also recorded in order to demonstrate that submicron features can be easily resolved using the proposed microscopy setup. As a final point, because of the nonlinear nature of the photoluminescence, the interference fringes in Fig. 4 are tighter and the Talbot effect in the case of the 3rd order mask is more pronounced than in the corresponding images in Fig. 2. These photoluminescence fringes give a good approximation of the actual modulation of the refractive index.
Fig. 3. A schematic of the microscopy setup to monitor nonlinear photoluminescence in the Ge-doped core of the D-fiber.
Fig. 4. Aligning the femtosecond laser focus with the fiber core using nonlinear microscopy. (a) Alignment procedure for the 3rd order mask (see text). The center of the core corresponding to the brightest photoluminescence is at the 5th row. (b) Nonlinear microscopy image of the laser focus after the 1st order mask when the focus is in the middle of the core.
3.3 SMF-28 fiber alignment based on nonlinear microscopy
Using the laser field monitoring technique presented above, we have shown that the intra-focal intensity distribution inside an optical fiber can be reconstructed by, for instance, side polishing the fiber and collecting light through the flat surface. Nonlinear photoluminescence generated by the femtosecond laser radiation inside fibers with cores composed of Ge-doped silica becomes markedly stronger when the laser focus overlaps the core. The photoluminescence radiation intensity distribution follows the intensity distribution in the laser focus, albeit in a nonlinear fashion. In this section we show that laser-induced changes in the fiber core can be deduced from the corresponding nonlinear photoluminescence patterns. This, in turn, makes nonlinear microscopy a useful tool during the alignment procedure that precedes the actual FBG inscription process.
To validate this idea, nonlinear photoluminescence imaging was coupled with dark-field optical microscopy imaging for the visualization of femtosecond-laser-induced changes in optical fibers. The key idea behind the dark-field optical microscopy technique is to launch visible probe light (λ2 = 637 nm in Fig. 5) into the fiber core and collect scattered light
originating from the laser-modified regions or intrinsic fiber defects. Only a few milliwatts of coupled probe light are needed to allow one to detect weakly written Bragg gratings in the fiber core (refractive index modulations Δn ~10−5) [20].
Fig. 5. A schematic of the nonlinear microscopy/dark-field microscopy setup used to adjust the FBG inscription process.
As shown in Fig. 5, nonlinear and dark-field microscopy studies of the FBG inscription can be performed simultaneously using the same optical system (i.e., the same NA = 0.26
OL1, short-pass filter F and CCD). In order to monitor spectral characteristics of the FBG
during inscription, broadband radiation centered at ~1550 nm was also coupled into the fiber core and monitored in reflection or transmission using an optical spectrum analyzer (not depicted in Fig. 5).
The light collection perpendicular to the laser beam propagation, as shown in Fig. 5, allows one to observe the photoluminescence pattern (and light-induced changes) along the beam propagation, i.e., in the xz-plane. Taking into account that the line-shape laser focus is usually scanned across the fiber perpendicular to its axis in order to maximize the overlap of the Bragg grating structure with the fiber core [32], the exact knowledge of the photoluminescence radiation intensity distribution in the focal plane or another xy-plane may not be necessary as it is averaged along the y-axis by the scanning and can vary from one xy-plane to another because of the Talbot effect. On the other hand, the xz-intensity pattern remains unchanged during the scanning and in this respect is more important to know.
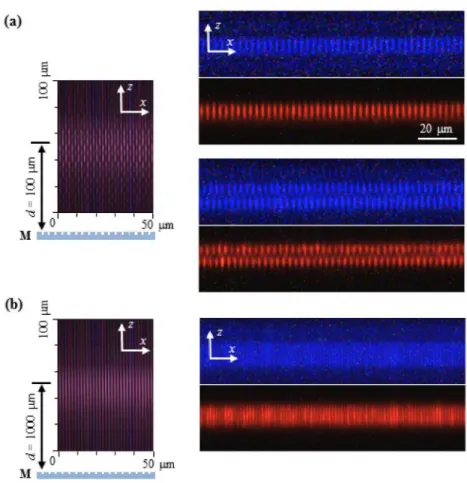
The following experiments were performed with SMF-28 fiber using the 3rd order mask and the f = 8 mm AL described earlier. The laser focus extent in SMF-28 fiber in the xy- and yz-planes can be deduced from the images in Fig. 2. To record nonlinear photoluminescence images while aligning the fiber, the laser power was kept at ~80 mW. During the FBG inscription process, the power was increased to ~160 mW, which resulted in the production of different refractive index modulation patterns depending on the fiber position inside the interference pattern generated by the mask. Despite the strong astigmatism introduced by the fiber curvature, a clear image of the fiber core could still be obtained (see Fig. 6). It should be noted, however, that the scale in the photoluminescence and dark-field images of Fig. 6 applies only along the x-axis (fiber axis) and is not the same along the z-axis.
Fig. 6. Correlation between nonlinear microscopy of the SMF-28 fiber core performed at the alignment stage and dark-field microscopy of the same region after the FBG inscription has been completed. (a) At d = 100 μm, a clear multiple-beam interference pattern from the 3.17 μm pitched phase mask (i.e., the 3rd order mask) is observed. The top and bottom panels represent different positions of the fiber along the z-axis in the Talbot interference pattern. (b) At d = 1000 μm after the 3rd order mask, order walk-off results in a two-beam interference pattern. The nonlinear photo-luminescence microscopy images at λ1 ~400 nm are in blue; the
corresponding dark-field microscopy images at λ2 ~637 nm are in red; the free-space intensity
distributions at λ = 800 nm presented in the left panels are in pink. Due to astigmatism generated by the fiber, the scaling in the nonlinear photoluminescence and dark-field microscopy images applies only to the x-axis.
Two limiting situations are presented in Fig. 6. Approximately 100 μm away from the 3rd order mask (Fig. 6(a)), the pulse fronts corresponding to different diffraction orders still have a significant overlap and thus form a pronounced Talbot pattern. In this case, by moving the mask with respect to the fiber by only a few micrometers, the xz-intensity distribution in the fiber core can be changed from a regular 3.17 μm-pitch pattern to an interleaved pattern, which we observe using in situ nonlinear microscopy. On the other hand, at a 1000 μm mask-to-fiber distance, the pulse fronts of the 0th, 1st, 2nd and 3rd diffracted mask orders are well separated along the z-axis due to the walk-off effect and pure two-beam interference patterns are formed. A nonlinear microscopy image of the two-beam interference pattern that originates from the interference of the ± 1 diffracted orders is shown in Fig. 6(b). Obviously, under these conditions the fiber alignment becomes much less sensitive to the mask-to-fiber distance d. The on-axis free-space laser intensity distributions in the xz-plane presented in the left panels of Fig. 6 clearly illustrate the above two situations. However, one should keep in
mind that the Talbot length inside the SMF-28 fiber is larger than in free space by a factor of
n, where n is the refractive index of the core region.
Most importantly, Fig. 6 demonstrates that nonlinear microscopy analysis performed at low laser power (below the threshold for index change) can quite accurately predict the shape of the modification that will be produced at a significantly higher laser power used for the actual FBG inscription process.
3.4 Transjacket FBG inscription in acrylate-coated SMF-28 fiber
Nonlinear photoluminescence microscopy is a powerful technique when applied to FBG inscription processes where beam alignment in the fiber is critical, such as selective processing of optical fiber claddings [33] or, more importantly, grating inscription through protective buffer coatings of optical fiber [34]. Empirically, FBG transjacket inscription using 800 nm radiation is improved by i) using a phase mask that produces a fundamental Bragg resonance in the fiber [30] but at the same time has good zero order suppression [35], ii) by reducing the pulse duration of the femtosecond source (from 120 to 35 fs) [36], and iii) by using tight focusing optics that create a large differential in intensity between the fiber coating or jacket and the fiber core, such as a multiple lens system [37] or an adapted acylindrical lens that dramatically reduces spherical aberration present in short focal length cylindrical lenses [36].
By utilizing nonlinear photoluminescence and dark-field microscopy, as shown in Fig. 5, critical alignment of the femtosecond beam through the phase mask and acrylate coating of
SMF-28 fiber was realized using a standard pure silica phase mask, a larger form factor f = 12
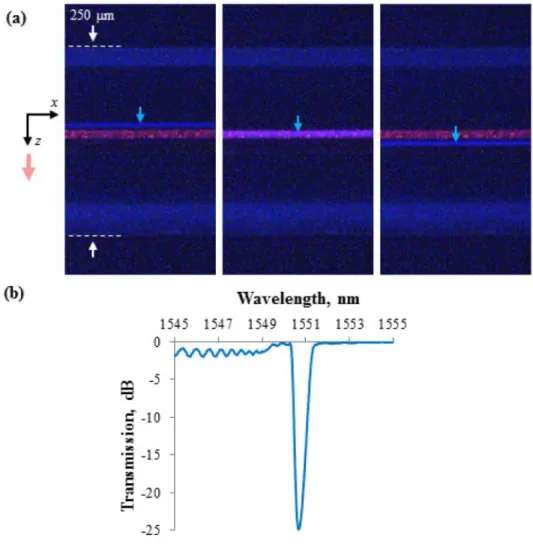
mm AL and 80 fs, λ = 800 nm pulses. The 7 mm femtosecond writing beam was passed through a × 2 beam expander in order to maximize the filling factor for the acylindrical lens. In Fig. 7(a), Rayleigh scattering of launched λ2 = 637 nm light highlights the core region of
the coated SMF-28 fiber. The alignment beam used had an average power of ~160 mW, which resulted in a blue photoluminescence line focus in front of the core (left-hand image of Fig. 7(a)). Since the cladding region is pure silica, rather than Ge-doped silica, the blue photoluminescence in the cladding likely arose from a 460 nm photoluminescence band due to oxygen deficient defects in the silica [38]. It should be noted that for the alignment intensity used, this photoluminescence signal in the cladding appeared proximate the core, ~10 µm away from the cladding/core interface. With a more sensitive camera this cladding photoluminescence may have been observed farther away from the core.
By translating the AL along the z-axis towards the fiber, the line focus overlapped with the core, resulting in large increase in blue photoluminescence (middle image Fig. 7(a)). Continued translation of the AL resulted in the passage of the line focus through the core back into the cladding region and a consequent reduction in photoluminescence. Using this approach, the line-shape focus position was adjusted to overlap with the core region. The average power of the writing beam was then increased to 350 mW and an FBG was written after a few-minute exposure without any deterioration to the acrylate coating. The resultant grating had a transmission of −25 dB at the Bragg resonance and a −3 dB bandwidth of 0.86 nm. The length of the photoluminescence along the fiber core was approximately 6 mm. The transmission spectrum is shown in Fig. 7(b). Assuming a grating length of 6 mm with a Gaussian apodization profile, the corresponding index modulation of the grating is Δn = 1.5 × 10⁻³.
Fig. 7. a) Femtosecond laser focus alignment through an acrylate-coated SMF-28 fiber as facilitated by nonlinear and dark-field microscopy. The fiber core is imaged by Rayleigh scattering of coupled λ2 = 637 nm light. The left-hand image shows blue photoluminescence in
front of the core, the middle image the increased photoluminescence as the line focus overlaps the core, and the right-hand image the photoluminescence of the laser line focus beyond the core. (b) The transmission spectrum of a transjacket FBG written with the photoluminescence line focus aligned on the core (middle image Fig. 7(a)).
3.5 Transjacket FBG inscription in acrylate- and polyimide-coated SMF-28 fiber with a high efficiency phase mask
Silica phase masks optimized for λ = 800 nm irradiation that are capable of producing a fundamental Bragg resonance in the telecom band (~1550 nm) in standard telecom fiber are nominally 1.07 μm in periodicity. Because the mask pitch approaches that of the irradiation wavelength, the best zero order suppression that can be realized through precision etching of pure silica alone is > 20% [39]. By using proprietary thin film deposition techniques, Ibsen
Photonics can produce a silica-based phase mask with zero order transmission that is reduced
to only a few percent for an irradiating beam with a given state of polarization. Unfortunately, these specialized phase masks are somewhat more difficult to manufacture as compared to standard pure silica masks.
A 1.07 μm pitched phase mask from Ibsen Photonics that was optimized for λ = 800 nm exposure and having nearly no coupling of the incident light into the zero order, was used to
inscribe transjacket gratings in acrylate- and polyimide-coated SMF-28 fiber. Using the optical setup described in Section 3.4, nonlinear photoluminescence was used to optimize the alignment with pulse energies of 80 μJ. Increasing pulse energies to 160 μJ, gratings were easily written through the acrylate coating of the fiber producing a reflection at the Bragg resonance greater than 35 dB. Increasing the pulse energy further but keeping below the coating damage threshold, Type II thermally stable structures could also be written directly through the coating. The Type II structures were identified by increased scattering of the probe light at λ2 = 637 nm [20].
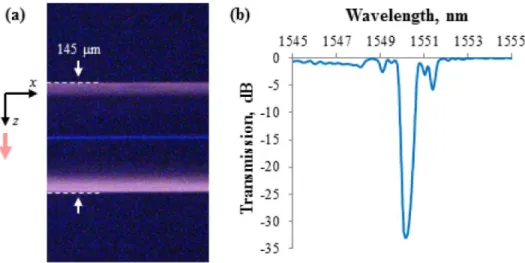
Nonlinear photoluminescence microscopy could also be used for polyimide coated fiber. Although more difficult to visualize due to the large absorption coefficient of polyimide for wavelengths below 450 nm, alignment pulse energies of 100 μJ resulted in detectable blue photoluminescence, which could be imaged when the laser focus was aligned with the fiber core (see Fig. 8(a)). By increasing the pulse energy to 200 μJ, a high reflectivity FBG was inscribed through the polyimide coating (Fig. 8(b)). The side lobes observed in the spectrum are likely due to vignetting of the femtosecond beam by the focusing lens.
Fig. 8. Femtosecond laser focus alignment through a polyimide-coated SMF-28 fiber as facilitated by nonlinear and dark-field microscopy. (a) The image shows the blue photoluminescence as the line focus overlaps the core. (b) The transmission spectrum of a transjacket FBG written with the photoluminescence line focus aligned on the core.
4. Conclusion
This paper presents a study of the inscription laser beam propagation through the complex optical system used to inscribe fiber Bragg gratings with a phase mask. Using nonlinear photoluminescence microscopy coupled with dark-field microscopy, intensity distributions of femtosecond 800 nm laser radiation are visualized within optical fibers during the inscription process. Correlation between the femtosecond laser intensity distribution in the fiber core and the resultant Bragg grating is demonstrated by comparisons of the structure of the induced photoluminescence and that of the red light scattered from the fabricated fiber Bragg grating. Nonlinear photoluminescence imaging is shown to be a powerful tool for transjacket grating inscription where precise alignment of a narrow line focus within the fiber core is needed.
![[PDF] Supports de cours sur les Bases du langage XML | Cours informatique](data:image/gif;base64,R0lGODlhAQABAIAAAP///wAAACH5BAEAAAAALAAAAAABAAEAAAICRAEAOw==)