Science Arts & Métiers (SAM)
is an open access repository that collects the work of Arts et Métiers Institute of
Technology researchers and makes it freely available over the web where possible.
This is an author-deposited version published in: https://sam.ensam.eu
Handle ID: .http://hdl.handle.net/10985/15795
To cite this version :
Christophe SAURET, Vanel Steve SIYOU FOTSO, Joseph BASCOU, Hélène PILLET, Engelbert MEPHU-NGUIFO, Pascale FODÉ, Philippe VASLIN - Cluster analysis to investigate
biomechanical changes during learning of manual wheelchair locomotion: a preliminary study Computer Methods in Biomechanics and Biomedical Engineering Vol. 18, n°sup1, p.20582059 -2015
Any correspondence concerning this service should be sent to the repository Administrator : archiveouverte@ensam.eu
Cluster analysis to investigate biomechanical changes during learning of manual
wheelchair locomotion: a preliminary study.
C. Sauret
a*, V. Siyou Fotso
b, J. Bascou
c, H. Pillet
a, E. Mephu N Guifo
b, P. Fodé
cand P. Vaslin
baInstitut de Biomécanique Humaine Georges Charpak, Arts et Métiers ParisTech, Paris, France; bClermont Université,
LIMOS, Aubière, France; cINI/CERAH, Woippy, France;
Keywords: manual wheelchair, learning, biomechanics, cluster analysis
1. Introduction
Learning a new motor task is characterized by improvements in movement smoothness and kinematics repeatability (Shmuelof et al., 2012). Hence, demonstrating biomechanical changes during the early phase of learning can be difficult due to high standard deviations that directly affect statistical analysis. Especially for curve analysis, timing variability results in wide corridor of normality. In addition, in the early phase of learning, each trial participates to the learning process, compromising the collection of redundant data. Besides, for further biomechanical analysis, curves selection/exclusion is often required, and is generally done manually based on a single parameter. The aim of this study was to investigate the interest of cluster analysis (i) to describe biomechanical changes during the early phase of learning manual wheelchair (MWC) locomotion and (ii) to define representative time courses of the locomotion parameters at different steps of the leaning process.
2. Materials & Methods
One young male able-bodied subject without any experience in MWC locomotion participated in this study. He was asked to train himself without indication at low intensity during 120 minutes distributed within 3 weeks. Two experimental sessions were performed allowing to analyze the 15 first and last minutes using an instrumented wheelchair (FRET-2) that allowed both the measurement of the mechanical actions applied on the handrims and the determination of the MWC velocity. The measurement session was repeated 6 months later without any practice. Each measurement session was composed of 3 blocks of 5 minutes, including about 10 start-ups each (84 start-ups in all).
Data from the FRET-2 were used for cluster analysis based on k-mean algorithm (Esling and Agon, 2012), considering 6 parameters: total (P1) and push phase (P2)
durations, total impulse of both (left and right) propelling torques (P3) and its distribution between the
resultant of both propelling torques (P5), and linear velocity at the end of the push phase (P6). Because involved parameters did not have the same units and in order to attribute the same weight to all of them, data of each parameter were centred and reduced. Finally, the number of clusters was arbitrarily fixed to 8 and named from A to H.
3. Results
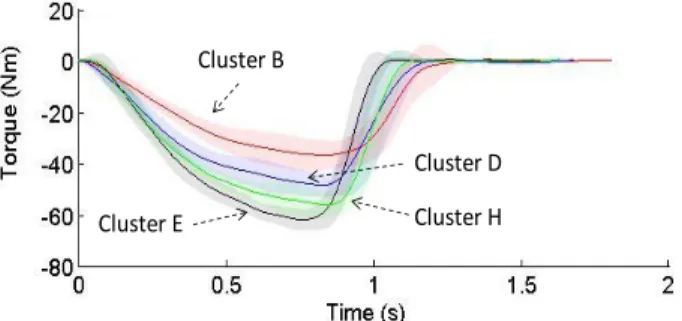
The 8 clusters gathered from 3 to 22 trials each. Main clusters where clusters B, D, E and H, gathering 14, 22, 11 and 12 trials, respectively. Time courses of the resultant of both (right & left) propelling torques for clusters B, D, E and H are depicted in Figure 1 and their features are reported in Table 1.
The 1st block of the 1st session of practice gave the
following sequence: C-B-B-B-B-C-B-F-F-F where each letter refers to the cluster to which belonged each start-up: in this block, start-ups had mainly the features of clusters B and F. During the 3rd block of the 1st session,
the sequence was B-D-B-F-D-F-E-D-G showing the apparition of start-ups of cluster D.
During the first session (3 blocks), start-ups mainly belonged to cluster B (44%), whereas they mainly belonged to clusters E (35%) and H (31%) during the second session, and to cluster D (55%) during the session carried out after 6 months without any practice.
B D E H P1 (s) 1.8 ± 0.1 1.7 ± 0.1 1.5 ± 0.1 1.6 ± 0.1 P2 (s) 1.2 ± 0.1 1.1 ± 0.1 1.0 ± 0.1 1.2 ± 0.1 P3 (Nm.s) -27 ± 3 -34 ± 2 -38 ± 2 -38 ± 2 P4 (%) 40 ± 5 39 ± 3 37 ± 3 42 ± 3 P5 (Nm) -40 ± 5 -52 ± 4 -64 ± 3 -59 ± 4 P6 (m/s) 0.7 ± 0.1 0.9 ± 0.1 1.0 ± 0.1 1.0 ± 0.1
Table 1: Features of the four main clusters. Two distances between clusters have been computed: inter-centroids distance and minimal distance between the nearest points of two different clusters. These distances allow identifying what were the clusters that most resembled while considering all parameters. These distances showed that Cluster E and H were the most
resembling. Cluster B was closer to cluster D than to clusters E and H but cluster D resembled more to cluster E and H than to cluster B. So, cluster D can be seen as intermediate between cluster B on the one hand and clusters E and H on the other hand.
Figure 1: Average time courses of the resultant of both propelling torques for clusters B, D, E and H.
Finally, using a more classical approach, standard deviations computed for each block of practice were generally from 1.5 to 2.0 times higher than within clusters, representing up to 30% of the nominal value (10% in average). In the same way, average time courses calculated for each block of practice could be significantly different from clusters means. For instance, curves obtained during the first and third blocks of the first session of practice were clearly different from those of the clusters (B and D) to which they mainly belonged (Figure 2).
Figure 2: Average time courses of the resultant of both propelling torques for clusters B and D; and for the 1st
and the 3rd blocks of practice.
4. Discussion
The symbolic representation method (Siyou Fotso et al., submitted) used in this study for classifying and analysing start-up pushes showed that even if large differences were observed between curves, no single trial was secluded in a cluster and thus considered as an outlier.
Cluster occurrence frequency allowed identifying the main clusters, which were depending on the expertise level. However, for the studied subject, features of
cluster D, which was the most frequent cluster during the 3rd session (after 6 months), need further
investigations to identify if the decrease of the dynamics properties (torque and impulse), compared to the 2nd
session (after 120 minutes of training) where clusters E and H were the most frequent, was due to a lower self-selected intensity or to a loss of motor ability.
The use of a symbolic representation (i.e. string) gives an easier readability of the strategies used by a subject to perform a task than the comparison of individual trials, especially when considering several parameters simultaneously (here: phase durations, torques, impulses and velocities).
The comparison with a more classical approach showed that cluster analysis yielded lower standard deviations that would allow a better definition of the different strategies and to obtain some significant statistical differences between motor patterns used during the learning process.
However, one limitation of this method is that the number of strategies is defined by the number of clusters chosen as input in the algorithm. If some methods already exist to estimate the best number of clusters based on different criteria (Sugar and James, 2003), their appropriateness with the present research question remains to be evaluated.
5. Conclusion
This preliminary study showed the potential of cluster analysis to study biomechanical changes during the learning of MWC locomotion. The interest of this processing method relies on both its direct use for locomotion analysis and its integration into the whole data processing workflow. It is, thus, able to provide representative data prior to further biomechanical analysis such as the use of musculoskeletal models, for instance. However, further work is still required before it could be used in an efficient and generalized way.
References
Shmuelof L, Krakauer JW, Mazzoni P. 2012. How is a motor skill learned? Change and invariance at the levels of task success and trajectory control. J Neurophysiology. 108(2): 578-594.
Esling P, Agon C. 2012. Time-series data mining. ACM Computing Surveys. 45:1-34.
Siyou Fotso VS, Mephu-Nguifo E, Vaslin Ph. (in this issue) Symbolic representation of propulsion cycles in manual wheelchair locomotion.
Sugar CA, James GM. 2003. Finding the number of clusters in a data set: An information theoretic approach. Journal of the American Statistical Association. 98: 750–763.
Cluster B
Cluster D Cluster E Cluster H