SF2A 2008
C. Charbonnel, F. Combes and R. Samadi (eds)
RADIAL VELOCITIES WITH THE GAIA RVS SPECTROMETER
Viala, Y.P.
1, Blomme, R.
2, Damerdji, Y.
3, Delle Luche, C.
1, Fr´emat, Y.
2, Gosset, E.
3, Jonckheere,
A.
2, Katz, D.
1, Martayan, C.
2, Morel, T.
3, Poels, J.
3and Royer, F.
1Abstract. Four different method are used to derive radial velocities from spectra observed by the Gaia Radial Velocity Spectrometer (RVS). They are briefly presented here together with very preliminary results. 1 Introduction
The main aim of the Gaia Radial Velocity Spectrometer (RVS) is to determine the radial velocities of nearly 100 to 200 millions of stars, with an expected accuracy of 1 km/s up to magnitude V = 13 and 15 km/s down to V = 16. These data will be a very useful tool for kinematics and dynamics studies of our Galaxy.
The Gaia data will be processed and analyzed by an international consortium (DPAC) including ESA and european institutes participating to the mission (Mignard & Drimmel 2007). Within DPAC nine coordination units CU have in charge a specific scientific or management problem. The processing of spectroscopic data provided by the RVS is devoted to CU6. The aim of this paper is to briefly present the work done within the development unit (DU) ”Single transit analysis (STA)” in charge of analysing the data obtained during a unique transit of an object through the RVS field of view.
2 Radial velocity determination of single stars during a single transit
Deriving radial velocities of the observed object is an important task of DU STA. We restrict here to radial velocity determination of single stars. Four different algorithms have been developped using Java programming language : i) Cross-correlation between the object spectrum and a template spectrum in direct space, ii) Cross-correlation between the object spectrum and a template spectrum in Fourier space, iii)Cross-correlation between the object spectrum and a template spectrum in Fourier space using the Chelli’s method (Chelli 2000), iv) Method of minimum distance between the object spectrum and a series of templates. A detailed escription of these methods can be found in (Viala et al. 2007).
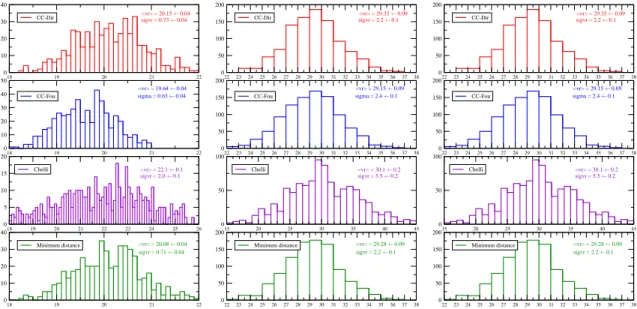
For a given set of astrophysical parameters/magnitude, Monte-Carlo simulations (provided by CU2) led to 1000 spectra differing only by noise realisation but all shifted by 20 km/s. Radial velocities from the series of spectra were derived by the 4 algorithms. As an example, figure 1 shows histograms of the radial velocities for solar type stars of magnitude 8.6, 10.6 and 12.6. The mean value of the distribution slighly differ from 20 km/s : this small bias is due to different slopes of the continuum between the object and the template spectrum. The dispersion of the distribution gives the error on the radial velocity determination. Preliminary error derivations are listed in table 1 for several spectral types.
3 Conclusion
For a single transit and for the three methods discussed, radial velocities can be determined with an fairly good accuracy in the range 1 to 8 km/s down to magnitude GRV S ≤14 for F-G-K spectral types. Accuracies
and magnitude limit are much less good for hotter stars (Spectral types O, B and A). Tests have not yet been done for cool M stars. Tentative determination of the projected rotational velocities, using the three algorithms developped within DU STA is planned for a near future.
1
Observatoire de Paris, GEPI, 92195 Meudon Cedex
2
Observatoire Royal de Belgique, Avenue circulaire 3, B 1180 Uccle(Bruxelles)
3
Institut d’Astrophysique et de Geophysique, Universite de Liege, Allee du 6 aout, B-4000 Liege c
52 SF2A 2008 18 19 20 21 22 0 10 20 30 40 Minimum distance 18 19 20 21 22 0 10 20 30 40 CC-Dir 18 19 20 21 22 0 10 20 30 40 50 CC-Fou 18 19 20 21 22 23 24 25 26 0 5 10 15 20 Chelli sigma = 0.63 +- 0.04 <vr> = 20.15 +- 0.04 <vr> = 20.08 +- 0.04 sigvr = 2.0 +- 0.1 sigvr = 0.73 +- 0.04 sigvr = 0.71 +- 0.04 <vr> = 19.64 +- 0.04 <vr> = 22.1 +- 0.1 22 23 24 25 26 27 28 29 30 31 32 33 34 35 36 37 38 0 50 100 150 200 Minimum distance 22 23 24 25 26 27 28 29 30 31 32 33 34 35 36 37 38 0 50 100 150 200 CC-Dir 22 23 24 25 26 27 28 29 30 31 32 33 34 35 36 37 38 0 50 100 150 200 CC-Fou 15 20 25 30 35 40 45 0 50 100 Chelli sigma = 2.4 +- 0.1 <vr> = 29.35 +- 0.09 <vr> = 29.28 +- 0.09 sigvr = 5.5 +- 0.2 sigvr = 2.2 +- 0.1 sigvr = 2.2 +- 0.1 <vr> = 29.15 +- 0.09 <vr> = 30.1 +- 0.2 22 23 24 25 26 27 28 29 30 31 32 33 34 35 36 37 38 0 50 100 150 200 Minimum distance 22 23 24 25 26 27 28 29 30 31 32 33 34 35 36 37 38 0 50 100 150 200 CC-Dir 22 23 24 25 26 27 28 29 30 31 32 33 34 35 36 37 38 0 50 100 150 200 CC-Fou 15 20 25 30 35 40 45 0 50 100 Chelli sigma = 2.4 +- 0.1 <vr> = 29.35 +- 0.09 <vr> = 29.28 +- 0.09 sigvr = 5.5 +- 0.2 sigvr = 2.2 +- 0.1 sigvr = 2.2 +- 0.1 <vr> = 29.15 +- 0.09 <vr> = 30.1 +- 0.2
Fig. 1.Histograms derived radial velocities by the 4 algorithms for a G5V star of RVS magnitude 8.6, 10.6 and 12.6
Table 1.Errors from Monte Carlo simulations on radial velocity derivation for single stars of various spectral types Sp. type Tef f logg Fe/H RVS magnitude error on vrad in km/s
CCDir CCFou Chelli MinDist
K5V 4000 K 4.0 0.0 8.7 0.63 0.63 1.8 0.62 12.7 7.1 7.5 22.2 7.4 G5V 5500 K 4.0 0.0 8.6 0.73 0.63 2.0 0.71 12.6 7.9 8.1 26.6 8.1 F5V 7500 K 4.0 0.0 8.2 0.87 0.85 3.7 0.86 12.2 8.6 8.8 46.2 8.5 A5V 10000 K 4.0 0.0 7.5 0.94 0.92 5.9 0.96 11.5 11.1 12.9 46.2 10.6 B2V 20000 K 4.0 0.0 6.8 3.0 3.1 15.5 2.4 10.8 31.9 33.7 315 24.8 B0V 30000 K 4.0 0.0 6.4 2.7 2.8 17.0 2.3 9.9 33.5 18.3 204 28.9 O6V 39000 K 4.0 0.0 6.4 4.1 0.5 14.5 53.0 References Chelli, A. 2000, AA, 358, L59
Mignard, F., & Drimmel, R. 2007, ESA Note, GAIA-CD-SP-DPAC-FM-030-2
Viala, Y., Blomme, R., Dammerdji, Y., et al. 2007, ESA Note, GAIA-C6-SP-OPM-YV-004-1 Viala, Y., Blomme, R., Dammerdji, Y., et al. 2008, ESA Note, GAIA-C6-SP-OPM-YV-002-3